4385
Arterial spin labeling-based machine learning for idiopathic rapid eye movement sleep behavior disorder and Parkinson's disease1Suzhou Institute of Biomedical Engineering and Technology, Chinese Academy of Sciences, Suzhou, Jiangsu, People’s Republic of China, suzhou, China, 2Department of Radiology, The Second Affiliated Hospital of Soochow University, Suzhou, Jiangsu, People’s Republic of China, suzhou, China, 3Department of Neurology, The Second Affiliated Hospital of Soochow University, Suzhou, Jiangsu, People’s Republic of China, suzhou, China, 4Institute of Artificial Intelligence and Clinical Innovation, Neusoft Medical Systems Co., Ltd., Shanghai, People’s Republic of China, shanghai, China, 5Florey Institute of Neuroscience and Mental Health, The University of Melbourne, Melbourne, VIC, Australia, Melbourne, Australia, 6MR Research Collaboration Team, Siemens Healthineers Ltd. Shanghai, China., shanghai, China
Synopsis
Keywords: Parkinson's Disease, Arterial spin labelling, Neurodegenration, Neuroscience
Motivation: Investigating cerebral blood flow (CBF) alterations between idiopathic REM sleep behavior disorder (iRBD) and Parkinson's disease (PD) using arterial spin labeling (ASL) can provide crucial insights into the shared neurobiological underpinnings of these conditions, facilitating effective disease management and treatment.
Goal(s): Analyzing the cerebral blood flow (CBF) variations and CBF-connectivity and evaluating their diagnostic utility.
Approach: By employing ASL, we conducted a detailed analysis of CBF variations and constructed a CBF-connectivity network.
Results: Observed increased CBF in PD vs iRBD in specific regions, as well as elevated connectivity.
Impact: The present study provides objective biomarkers for the progression of iRBD and PD through the study of cerebral perfusion. It also provides direction for adjunctive treatment of microcirculatory abnormalities to further inhibit the progression of associated dysfunction.
Introduction
Idiopathic REM sleep behavior disorder (iRBD) serves as a prodromal stage for Parkinson's disease (PD) and related neurodegenerative conditions[1]. A comprehensive understanding of the neurophysiological changes associated with iRBD can aid in the development of effective diagnostic and treatment strategies. The aim of this study is to employ arterial spin labeling (ASL)[2], a non-invasive MRI technique, to examine cerebral blood flow (CBF) discrepancies and CBF-connectivity[3] patterns in iRBD, PD, and healthy controls (HC). Furthermore, we aim to identify potential biomarkers that could facilitate the early diagnosis and monitoring of iRBD and PD progression.Methods
Subjects: Fifty-nine right-handed were enrolled, including 15 subjects with iRBD (M/F: 7/8, age: 60 ± 12), 20 subjects with PD[4] (M/F: 10/10, age: 60±10), and 24 healthy controls (M/F: 11/13, age: 65±9).Data acquisition: All subjects underwent cranial magnetic resonance scans on a 3.0T MRI scanner (Prisma, Siemens Healthcare, Erlangen, Germany) equipped with a 64-channel phased array head coil. T1-weighted (T1w) imaging was performed using a three-dimensional Magnetization Prepared Rapid Acquisition Gradient Recalled Echo (3D MP-RAGE), sequence with parameters: TR=2300ms, TE=3ms, TI=900ms, spatial resolution=0.8×0.8×0.8mm3. A pulsed ASL (PASL) sequence was employed to obtain quantitative CBF maps. The acquisition parameters were as follows: TR=3200ms, TE=12ms, flip angle=90°, FOV=256mm, voxel size=4×4×6 mm3, slice thickness=6mm, total scan time = 6min32s.
Data analysis: T1-weighted data processing procedures including resampling and reorientation, brain extraction, and brain label. ASL images were preprocessed using a Matlab-based toolkit[5] with procedures as follows: motion correction, co-registration to the anatomical image, smoothing, and normalization to MNI standard space. Quantification of CBF and construction of CBF-connectivity network: Initially, the CBF was quantified within each region based on the Automated Anatomical Labeling (AAL)[6] employing arterial spin labeling (ASL) techniques. Our analysis focused on distinct brain regions associated with significant CBF changes in iRBD, PD, and HC. We estimated CBF connectivity through Pearson correlation coefficients between each pair of brain regions, subsequently constructing a CBF-connectivity network with the identified brain regions as seed points.
Statistical analysis: The normality distribution of CBF and demographic data was tested by Kolmogorov-Smirnov methods. An independent t-test with age and sex as the nuisance variables was performed for CBF (Cerebral Blood Flow) variations in a voxel-size manner among the three groups. Multiple comparisons were corrected using the classical Benjamini-Hochberg procedure of FDR correction with a corrected threshold of 0.05. For each subject, the region with significant group differences was extracted and used as the region of interest (ROI). Then, we used Cohen’s d to describe the effect size (ES) of each ROI-based comparison. Likewise, the group differences in the CBF connectivity were compared using an independent t-test and a family-wise error (FEW) method with a corrected threshold of 0.05. The t-value was used as the indicator of correlation.
Results
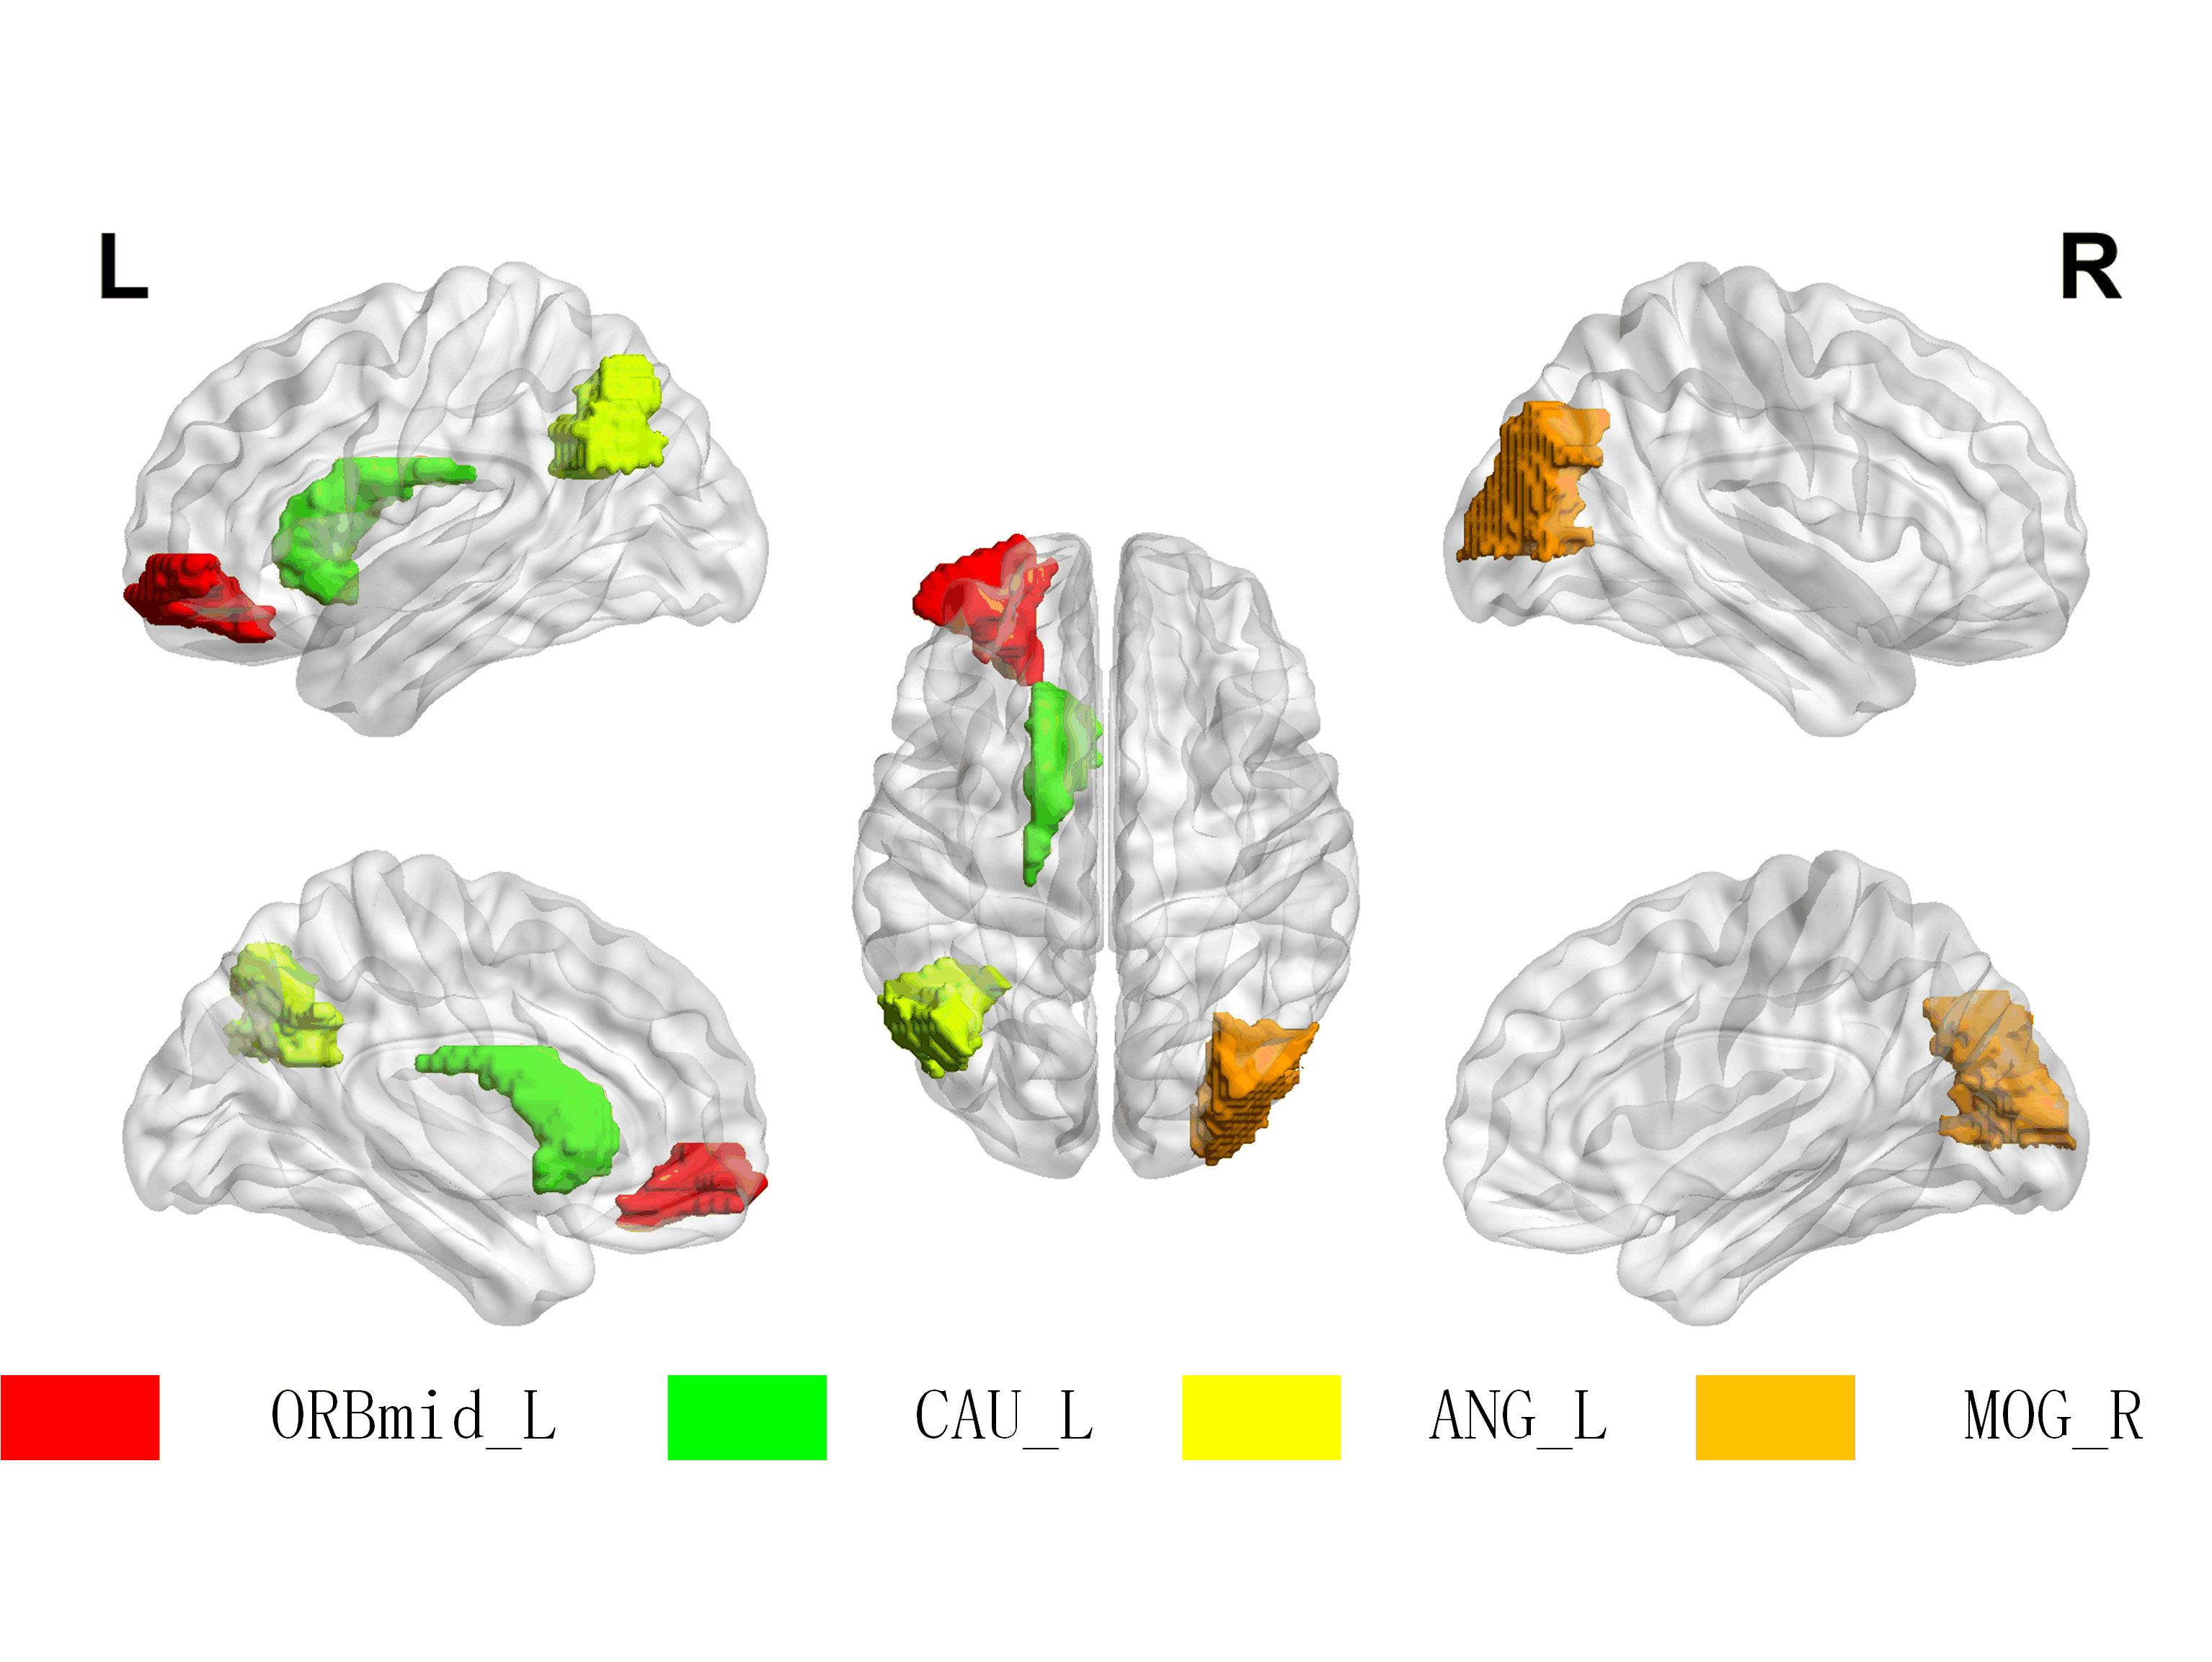
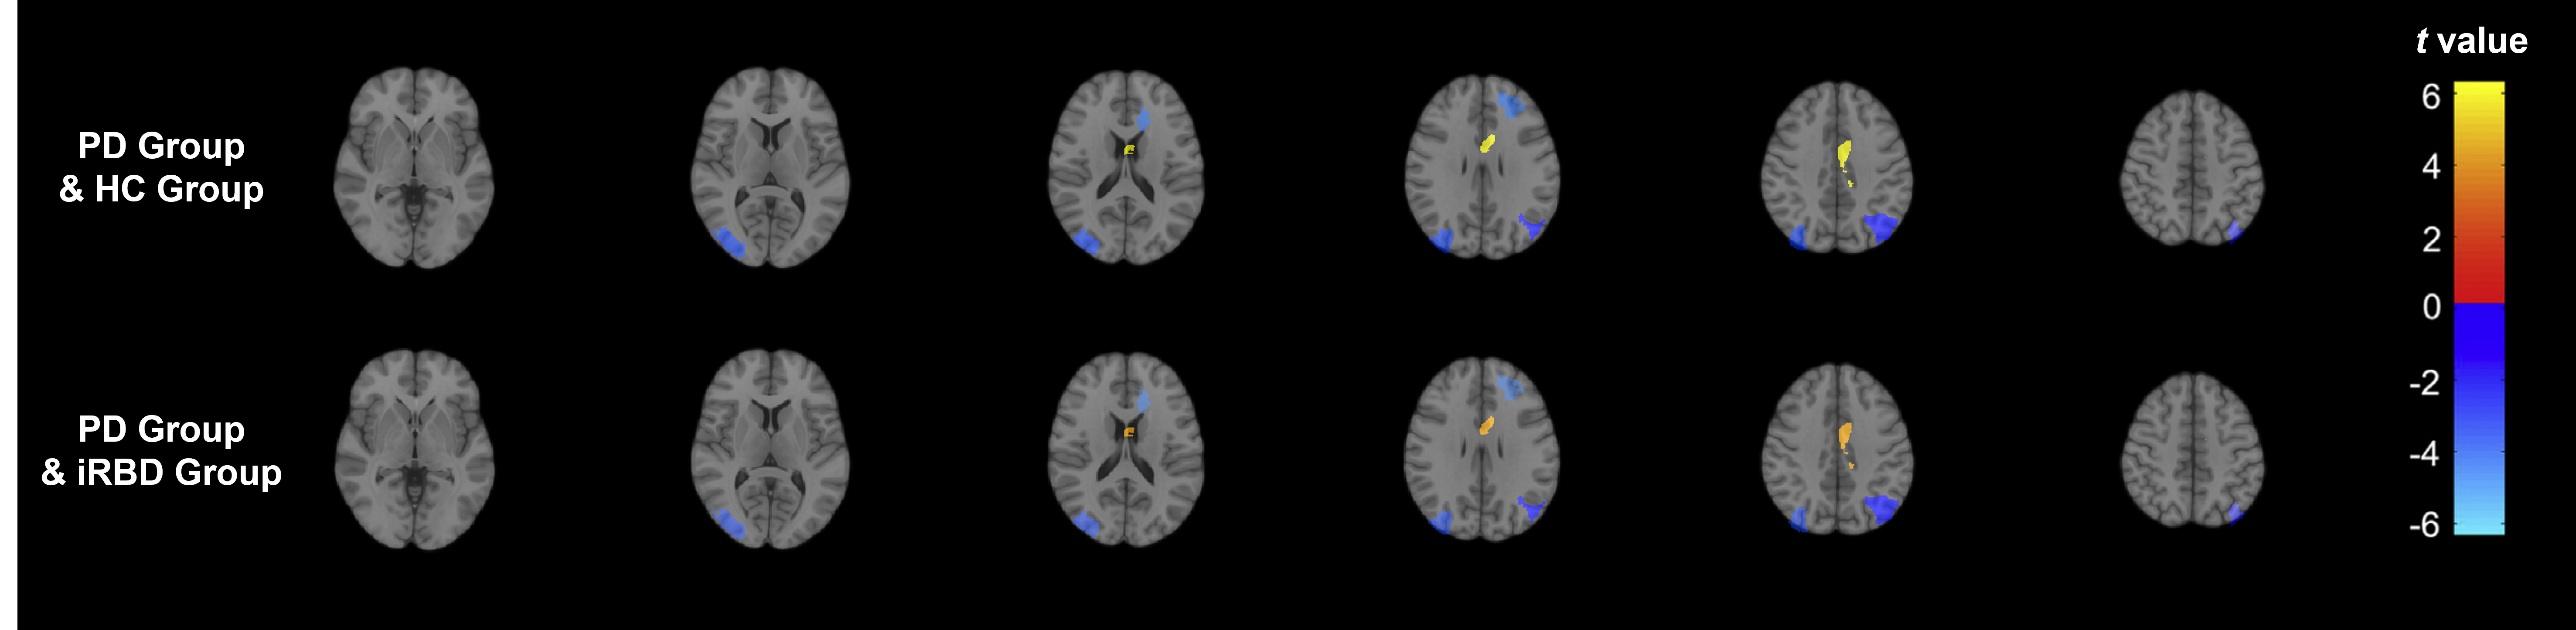
Figure 1 shows the brain regions of significant CBF differences between the PD and iRBD, and PD and HC.Figure 2 shows group differences in CBF. Compared with healthy subjects, the PD patients showed increased CBF in the Frontal_Mid_Orb_L(ES=1.08), Occipital_Mid_R,(ES=1.37), and Angular_L(ES=0.83). In contrast, these patients had significantly decreased CBF in Caudate_L(ES=-1.64). Similarly, compared to iRBD patients, PD showed the same trend. Frontal_Mid_Orb_L(ES=0.95), Occipital_Mid_R,(ES=1.16), and Angular_L(ES=1.46). Caudate_L(ES=-0.94).
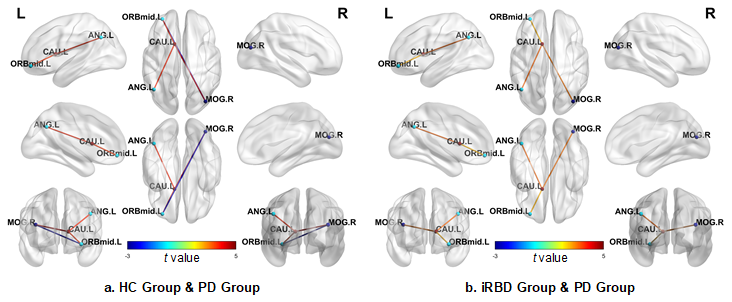
Figure 3 denotes the group differences in CBF connectivity. Compared with the iRBD group, the PD group exhibited elevated connectivity between the left orbital part of the middle frontal gyrus and the left caudate nucleus (t =2.536), the right middle occipital gyrus and the left caudate nucleus (t=3.153), left angular gyrus and the left caudate nucleus (t=3.220). Compared with the HC group, the PD group demonstrates a similar trend in the regions where increased connectivity was observed above. Additionally, between the left orbital part of the middle frontal gyrus and the right middle occipital gyrus (t=-2.619), the PD group exhibited decreased CBF connectivity.
Discussion
Significant changes of CBF values and CBF connectivity have been revealed in PD patients as compared to iRBD patients and healthy controls, demonstrating that ASL is valuable in detecting cerebral perfusion and network changes. This provides a direction for us to understand the characteristics of the lesions from the aspect of cerebral perfusion, as well as to interfere with the possible brain atrophy and functional abnormalities. To achieve more robust results, multi-modal studies will be conducted by increasing the sample size.Conclusion
Arterial spin labeling is able to detect alterations in brain perfusion and network in iRBD and PD and is valuable for individualized diagnosis, which is of potential clinical value in revealing its pathophysiological basis and assisting further treatment.Acknowledgements
No acknowledgement found.References
[1] Iranzo A, Tolosa E, Gelpi E, et al. Neurodegenerative disease status and post-mortem pathology in idiopathic rapid-eye-movement sleep behaviour disorder: an observational cohort study[J]. The Lancet Neurology, 2013, 12(5): 443-453.
[2] Puig O, Henriksen O M, Vestergaard M B, et al. Comparison of simultaneous arterial spin labeling MRI and 15O-H2O PET measurements of regional cerebral blood flow in rest and altered perfusion states[J]. Journal of Cerebral Blood Flow & Metabolism, 2020, 40(8): 1621-1633.
[3] Buxton R B, Uludağ K, Dubowitz D J, et al. Modeling the hemodynamic response to brain activation[J]. Neuroimage, 2004, 23: S220-S233. w
[4] Postuma R B, Berg D, Stern M, et al. MDS clinical diagnostic criteria for Parkinson's disease[J]. Movement disorders, 2015, 30(12): 1591-1601.
[5] Ze Wang, Geoffrey Aguirre, Hengyi Rao, JiongJiong Wang, Anna R. Childress, John A. Detre, Empirical ASL data analysis using an ASL data processing toolbox: ASLtbx, Magnetic Resonance Imaging, 2008, 26(2):261-9.
[6] Tzourio-Mazoyer N, Landeau B, Papathanassiou D, et al. Automated anatomical labeling of activations in SPM using a macroscopic anatomical parcellation of the MNI MRI single-subject brain[J]. Neuroimage, 2002, 15(1): 273-289.
Figures