4381
AI based neuromelanin MRI analysis in a multi-site longitudinal Parkinson’s Disease study1Clario., San Mateo, CA, United States, 2Clario., Lyon, France, 3Biogen Inc., Boston, MA, United States
Synopsis
Keywords: Parkinson's Disease, Parkinson's Disease, Neuromelanin contrast MRI, AI, clinical trial, longitudinal
Motivation: Neuromelanin (NM) MRI is a proposed biomarker of dopaminergic neurodegeneration in the substantia nigra pars compacta (SNpc).
Goal(s): To automate post-hoc analysis on NM-MRI data acquired from a large multi-center clinical trial.
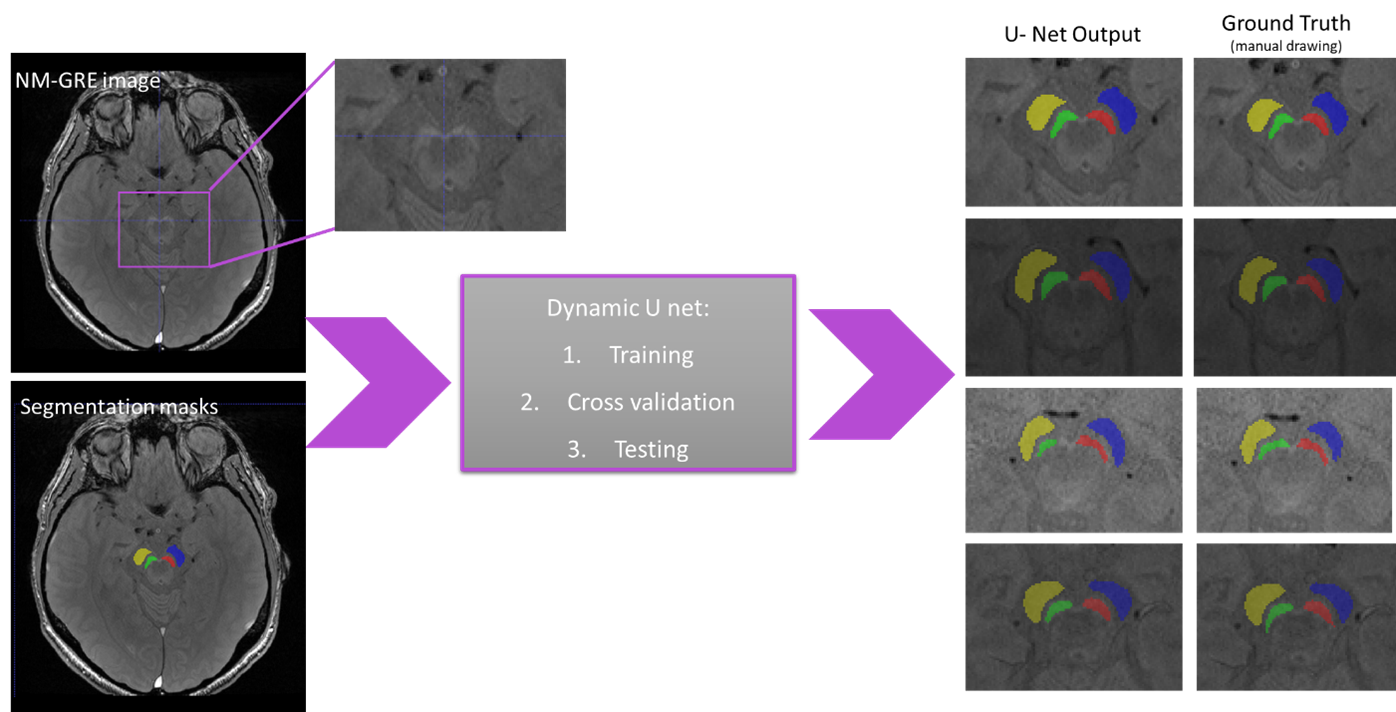
Approach: A deep dynamic u-net model was built to segment the SNpc and the background region automatically and was used to analyze a large multi-center longitudinal PD dataset.
Results: Within-subject change from baseline effects were significant at the population level for SNpc volume (left and right). These results suggest an AI-derived SNpc volume, estimating the atrophied hyperintense region on an NM-MRI scan, is a viable marker of disease progression in PD.
Impact: The dynamic AI model on NM-MRI trained/tested on multiple sites/scanners accurately and robustly delineates the SNpc and may have applicability in trials where NM-MRI is used as a marker of nigrostriatal degeneration.
Introduction
Parkinson’s disease (PD) is a progressive neurodegenerative disease that is characterized by motor and non-motor symptoms1. The degeneration of dopaminergic neurons in the substantia nigra pars compacts (SNpc) can be considered a hallmark of PD pathology1,2. These dopaminergic neurons contain neuromelanin, the loss of which manifests as depigmentation of the SNpc and that can be captured via Neuromelanin MRI (NM-MRI), which is sensitized to paramagnetic melanin-iron complexes3.Earlier studies using NM-MRI have illustrated significantly reduced contrast in the SNpc in patients with PD compared to healthy controls4,5. Although SNpc atrophy in early and progressing PD has been compared, longitudinal studies evaluating the trajectory of atrophy in SNpc via its change in structure and/or contrast relied on manual delineation of the SNpc ROI or used a small representative region (e.g., 5mm circle) inside the SNpc to assess NM contrast6. To mitigate these limitations and to operationalize the process for a large multi-center clinical trial, we built and validated a dynamic AI model to automatically delineate the SNpc as well as the background reference region required for computing the contrast ratio. We employ this model using data acquired from a large multi-center clinical trial (SPARK; NCT03318523) to characterize NM-MRI sensitivity to longitudinal change irrespective of treatment arm.
Methods
332 subjects from the SPARK study with PD diagnosis ≤ 3 yrs, a modified Hoehn and Yahr score ≤ 2.5, no symptomatic treatment within 12 weeks, and abnormal striatal DaTscan uptake confirmed via visual read were included. 177 subjects out of the 332 that were followed longitudinally had assessable data at all timepoints (screening, 24, 52, and 96 weeks). NM-MRI was acquired at 80 sites globally with 3T capabilities using a 3D-GRE sequence with 36 slices to cover the mid-brain (TE=6-7.5mm, TR=55ms, 0.62 in-slice resolution, 1.3mm slice thickness).Training and cross-validation data consisted of eighty-two random cases on which the SNpc and background ROI were manually drawn by an expert and edited, if required. A dynamic U-Net implemented in MONAI was trained using default parameters7. This U-Net is a semantic segmentation method that analyzes the training cases and automatically configures a matching U-Net-based segmentation pipeline. Eight test subjects which were picked from sites/scanners that were not used in the training dataset, were used to compute, and visualize the accuracy of segmentation. The model was also compared with another standard deep-medic CNN model8. Dice score was used as a performance index. Finally, the model was applied to the complete longitudinal SPARK dataset. Using the automated segmentation, SNpc volume and contrast ratio (CR) were computed. The mean intensity (I) of SNpc and reference region (RR) (Figure 1) was used to compute the CRs ((ISN-IRR)/IRR). The change in volume and CR at week 24, 52, and 96 was computed for each subject. An ANOVA model was employed to test for significant volume and CR change.
Results
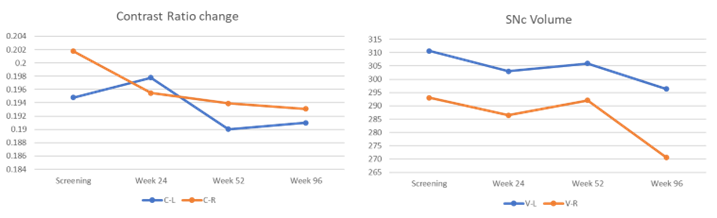
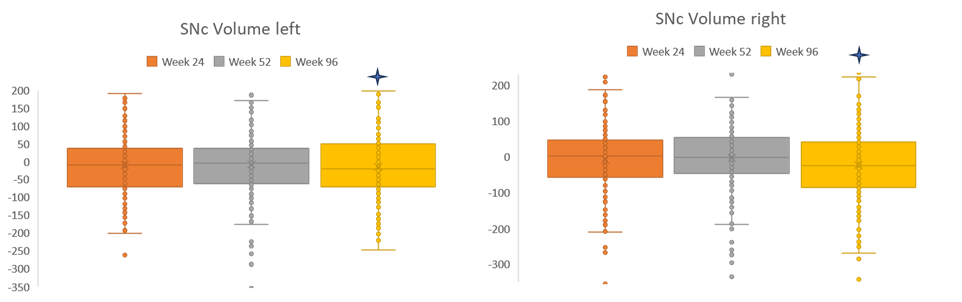
Visual inspection from Figure 1 illustrates the accuracy of the AI model. The average test dice score was 91.3%, with balanced sensitivity and specificity. The deep-medic model dice score was limited to 74.5%. Based on the accuracy of our model, it was deemed suitable to be used on the complete SPARK dataset. On the SPARK study, the mean CR, and the volumes of SNpc (left and right) decreased consistently as time progressed (Figure 2). However, the change was only significant in SNpc left and right volumes (p<0.05) at week 96, while the CR did not show a significant change (Table 1, Figure 3).Discussion
In this work, we successfully built a robust AI model that was trained on data from multiple sites, to accurately segment SNpc region and background. Test cases chosen from completely different site/scanner illustrated superior accuracy of the model. Results on the SPARK dataset suggests that volume of SNpc on NM-MRI is a viable marker of PD progression. Earlier studies comparing PD patients and healthy controls emphasized the use of a contrast ratio; however, with an AI-based technique, we see that automatic segmentation captures the hyperintense region illustrating a volume change associated with disease progression more consistently.In conclusion, the AI model robustly delineates the SNpc and has a wide applicability in large parkinsonian studies or clinical trials or where NM-MRI is used as a proxy for dopamine function, as it removes the need for manual delineation, reduces interobserver disparity and segments the region with high reliability.
Acknowledgements
No acknowledgement found.References
1. Bloem, B. R., Okun, M. S., & Klein, C. (2021). Parkinson's disease. The Lancet, 397(10291), 2284-2303.
2. Damier, P., Hirsch, E. C., Agid, Y., & Graybiel, A. (1999). The substantia nigra of the human brain: II. Patterns of loss of dopamine-containing neurons in Parkinson's disease. Brain, 122(8), 1437-1448.
3. Sasaki, M., Shibata, E., Tohyama, K., Takahashi, J., Otsuka, K., Tsuchiya, K., ... & Sakai, A. (2006). Neuromelanin magnetic resonance imaging of locus ceruleus and substantia nigra in Parkinson's disease. Neuroreport, 17(11), 1215-1218.
4. Cho, S. J., Bae, Y. J., Kim, J. M., Kim, D., Baik, S. H., Sunwoo, L., ... & Kim, J. H. (2021). Diagnostic performance of neuromelanin-sensitive magnetic resonance imaging for patients with Parkinson’s disease and factor analysis for its heterogeneity: a systematic review and meta-analysis. European radiology, 31, 1268-1280.
5. Sulzer, D., Cassidy, C., Horga, G., Kang, U. J., Fahn, S., Casella, L., ... & Zecca, L. (2018). Neuromelanin detection by magnetic resonance imaging (MRI) and its promise as a biomarker for Parkinson’s disease. NPJ Parkinson's disease, 4(1), 11.
6. Gaurav R, Yahia-Cherif L, Pyatigorskaya N, Mangone G, Biondetti E, Valabrègue R, Ewenczyk C, Hutchison RM, Cedarbaum JM, Corvol JC, Vidailhet M, Lehéricy S. Longitudinal Changes in Neuromelanin MRI Signal in Parkinson's Disease: A Progression Marker. Mov Disord. 2021
7. Isensee, F., Kickingereder, P., Wick, W., Bendszus, M., & Maier-Hein, K. H. (2019). No new-net. In Brainlesion: Glioma, Multiple Sclerosis, Stroke and Traumatic Brain Injuries: 4th International Workshop, BrainLes 2018, Held in Conjunction with MICCAI 2018, Granada, Spain, September 16, 2018, Revised Selected Papers, Part II 4 (pp. 234-244). Springer International Publishing.
8. Kamnitsas, K., Ferrante, E., Parisot, S., Ledig, C., Nori, A. V., Criminisi, A., ... & Glocker, B. (2016). DeepMedic for brain tumor segmentation. In Brainlesion: Glioma, Multiple Sclerosis, Stroke and Traumatic Brain Injuries: Second International Workshop, BrainLes 2016, with the Challenges on BRATS, ISLES and mTOP 2016, Held in Conjunction with MICCAI 2016, Athens, Greece, October 17, 2016, Revised Selected Papers 2 (pp. 138-149). Springer International Publishing.
Figures