4378
Utilizing synthetic MRI and brain regional analysis for early Parkinson's disease diagnosis1hulunbuir people’s hospital, Hulunbuir, China, 2MR Research China, GE HealthCare, Beijing, China
Synopsis
Keywords: Parkinson's Disease, Parkinson's Disease
Motivation: Early detection of Parkinson's disease (PD) is crucial, and MRI has been a valuable tool. Synthetic MRI, allows for comprehensive analysis of brain regions, offering potential for early diagnosis.
Goal(s): Evaluate the feasibility of synthetic MRI in early PD diagnosis by studying brain regions.
Approach: 31 PD patients and 25 controls underwent MRI. Synthetic MRI provided T1, T2, and PrD maps. Brain regions were analyzed and a combined diagnostic model was developed.
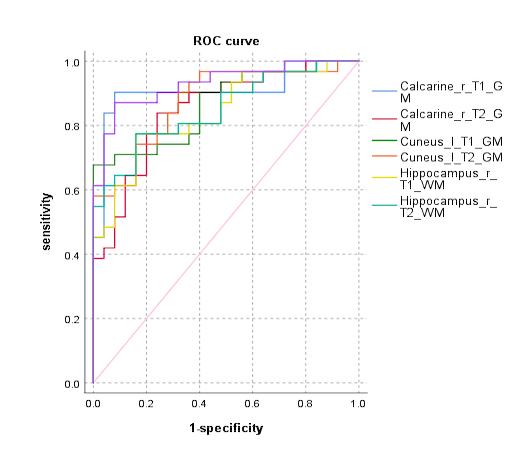
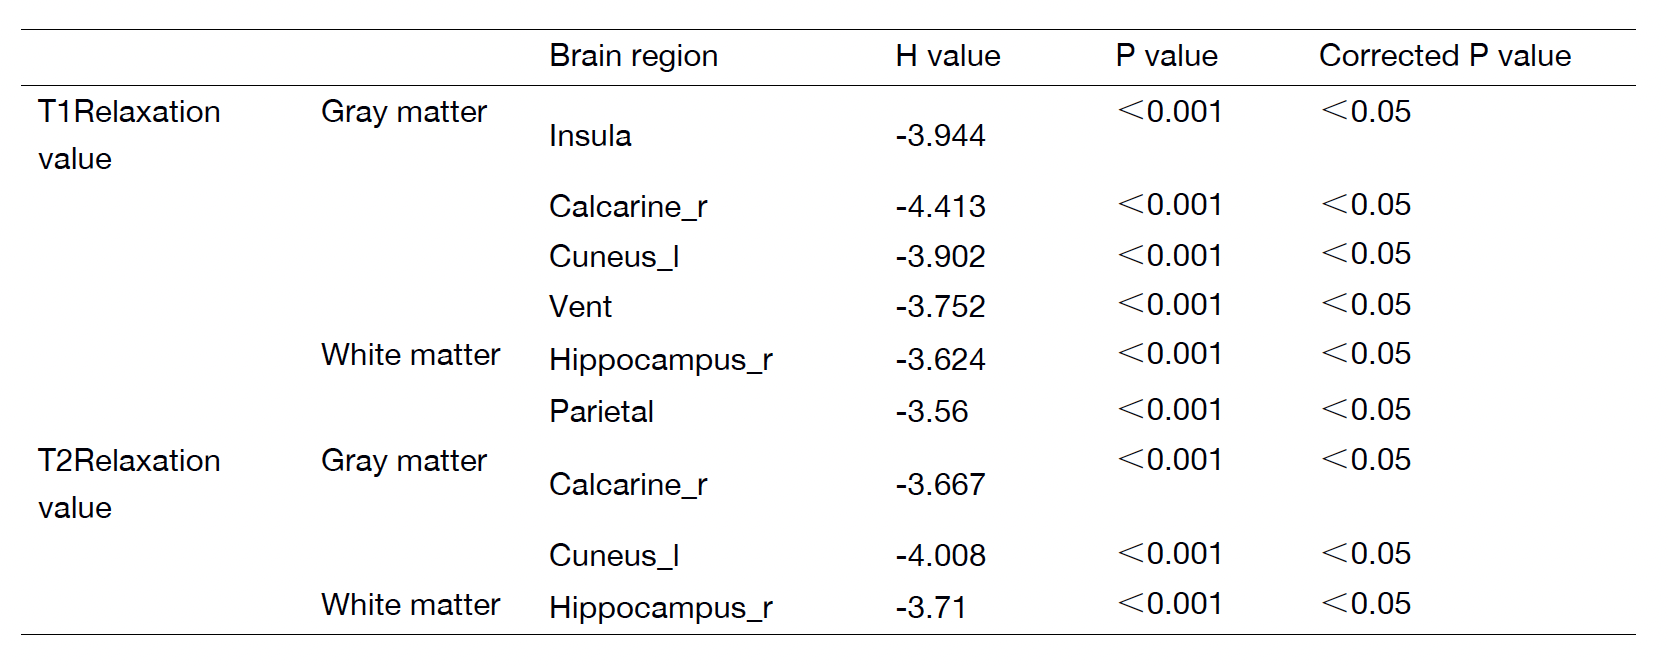
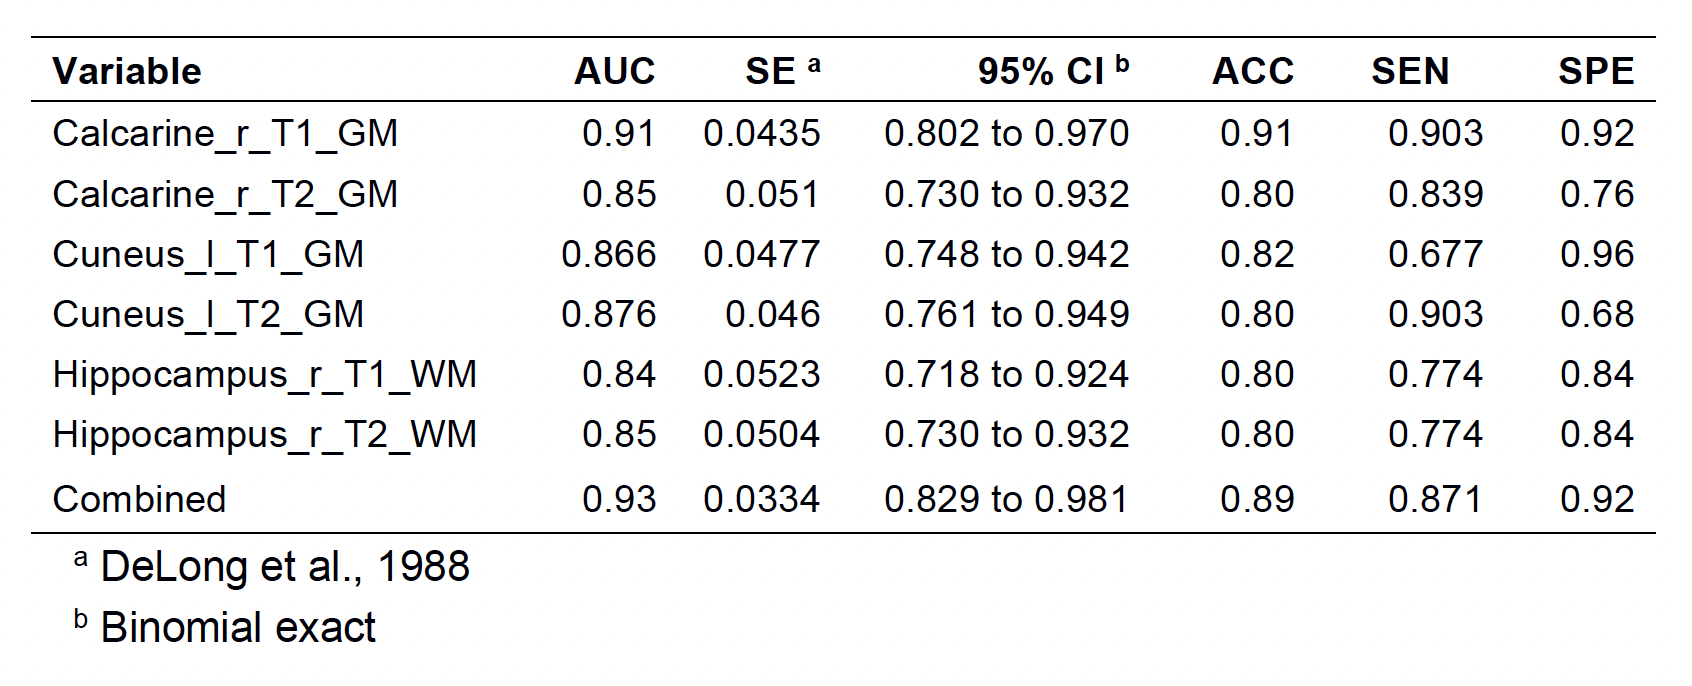
Results: Differences in T1 and T2 values were found in the calcarine, cuneus, and hippocampus. The model achieved an AUC of 0.930, suggesting synthetic MRI-derived parameters can serve as biomarkers.
Impact: The combined diagnosis using T1 and T2 values in specific brain regions effectively distinguished early-stage Parkinson's disease (ESP) from healthy controls (HC). This suggests that synthetic MRI-derived parameters have the potential to serve as precise early PD diagnostic biomarkers.
Introduction
Parkinson’s disease (PD) is a progressive neurodegenerative disorder characterized by the loss of neuromelanin-containing dopaminergic neurons and iron deposition in the substantia nigra. Early detection of preclinical PD is essential. MRI, known for its noninvasiveness and detailed tissue information, has been widely used for PD diagnosis, investigating various MRI biomarkers. Recent advancements in MRI technology, particularly synthetic MRI, offer the ability to quantify T1, T2, and proton density (PrD) relaxivity simultaneously. In this study, synthetic MRI was employed to assess brain regions in PD patients at different stages for early diagnosis.Methods
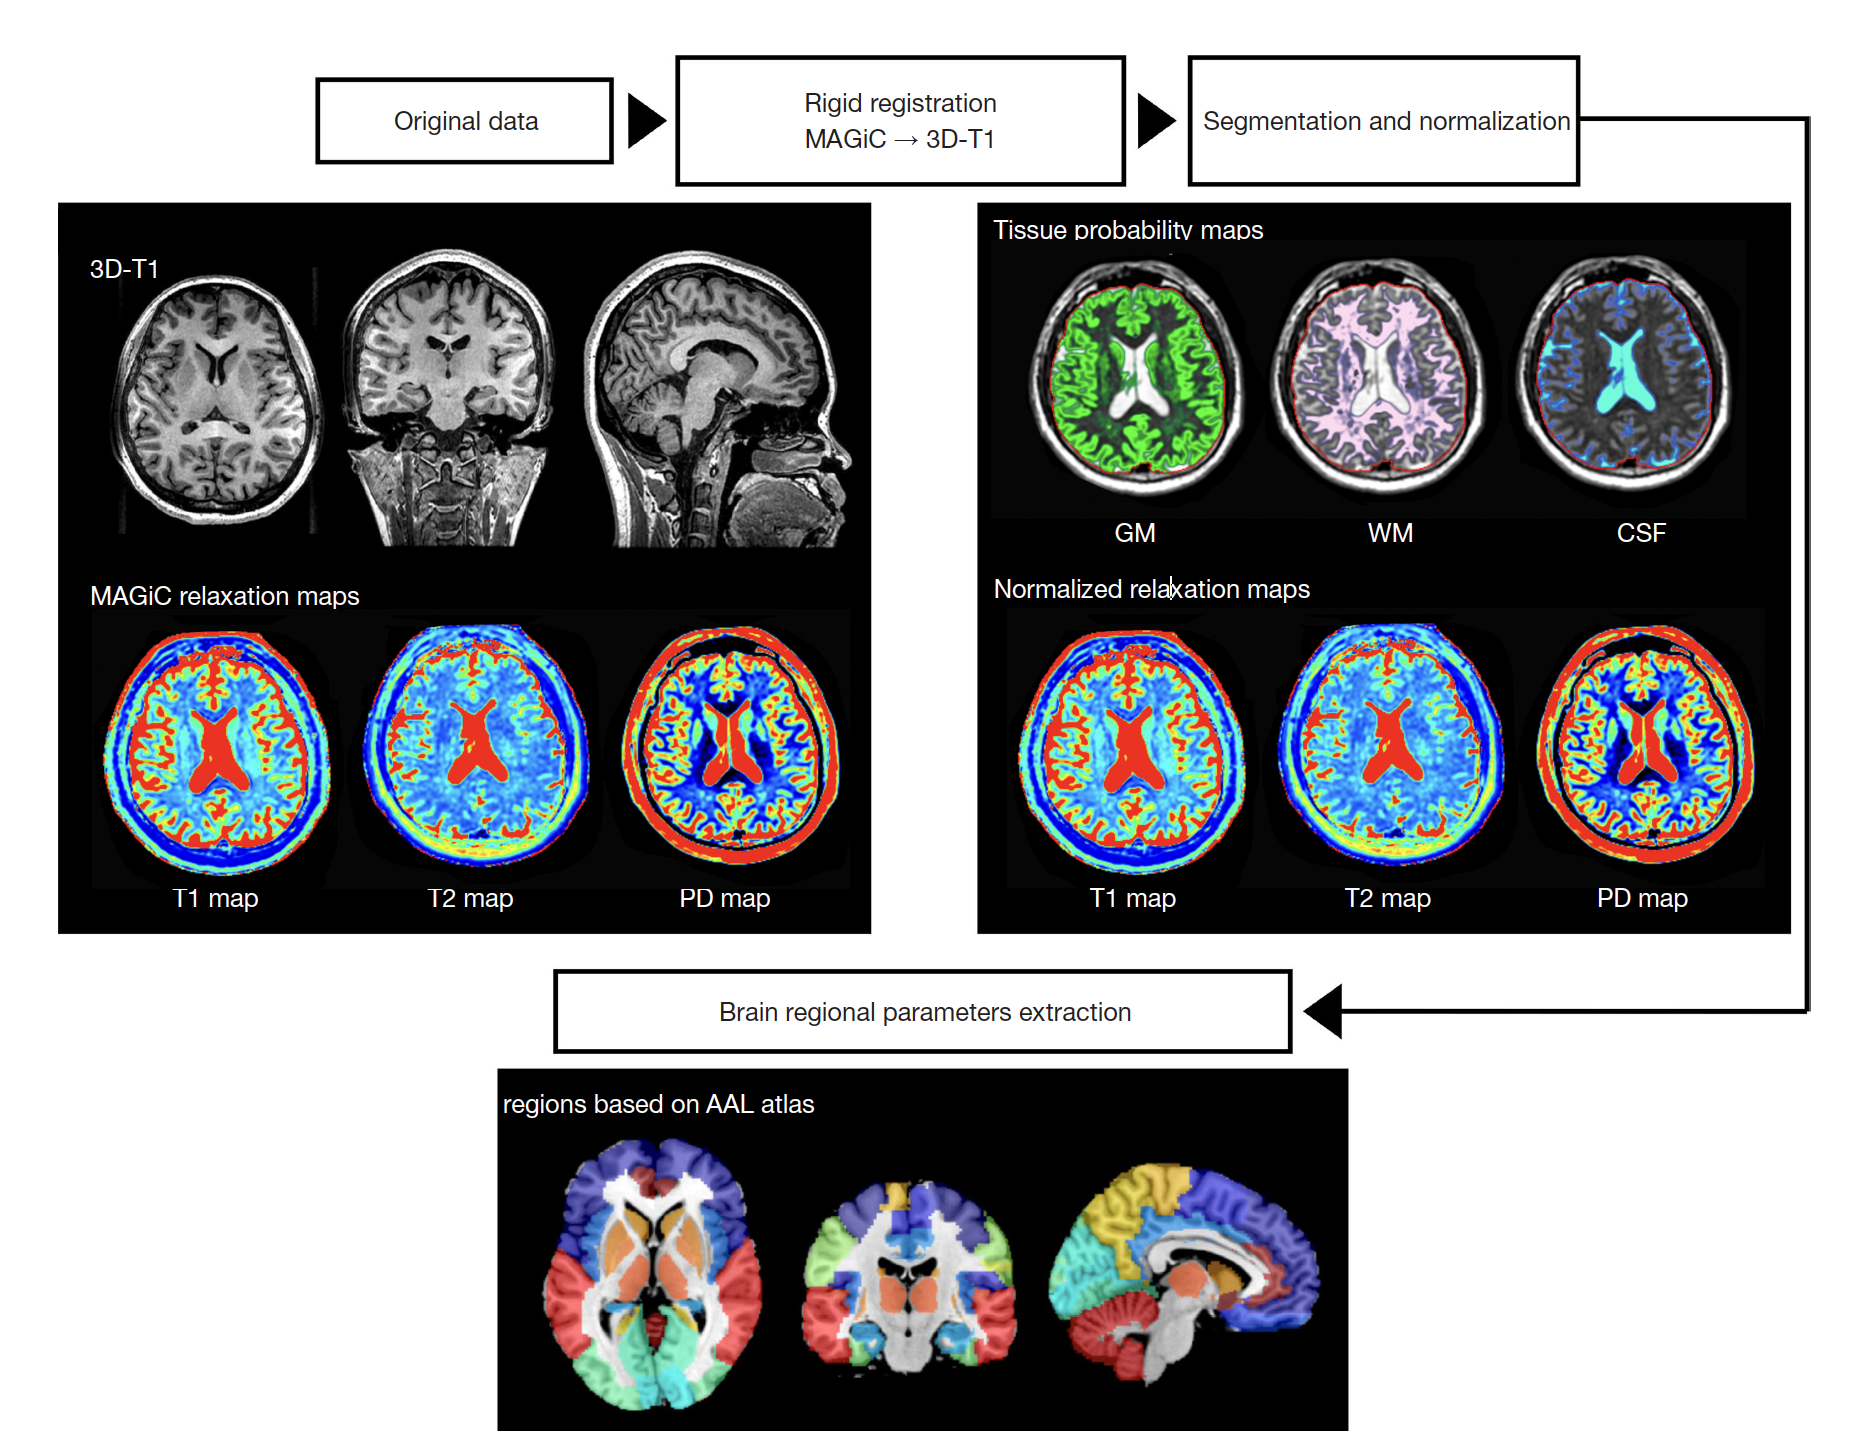
The study included 31 PD patients and 25 age- and gender-matched healthy controls. PD patients were categorized into early (ESP, 22 patients) and late (ASP, 9 patients) groups based on the Hoehn and Yahr (H&Y) grading. Brain MRI was performed using a 3.0-T MR system. The imaging protocol included conventional MRI, 3D T1-weighted imaging (T1WI), and synthetic MRI acquisition. Synthetic MRI data were processed to generate quantitative T1, T2, and PrD maps. Brain segmentation was performed, and values were extracted from 50 brain regions based on an atlas. Statistical analyses included Kruskal-Wallis tests for volume and brain regional relaxivity differences among the three groups and Mann-Whitney tests to compare ESP and HC groups. Multiple comparisons were corrected using the Bonferroni method. Receiver operating characteristic (ROC) analysis was conducted to distinguish ESP and HC groups, and area under the ROC curve (AUC), accuracy, sensitivity, and specificity were recorded. Multivariate logistic regression was used for joint diagnosis.Results
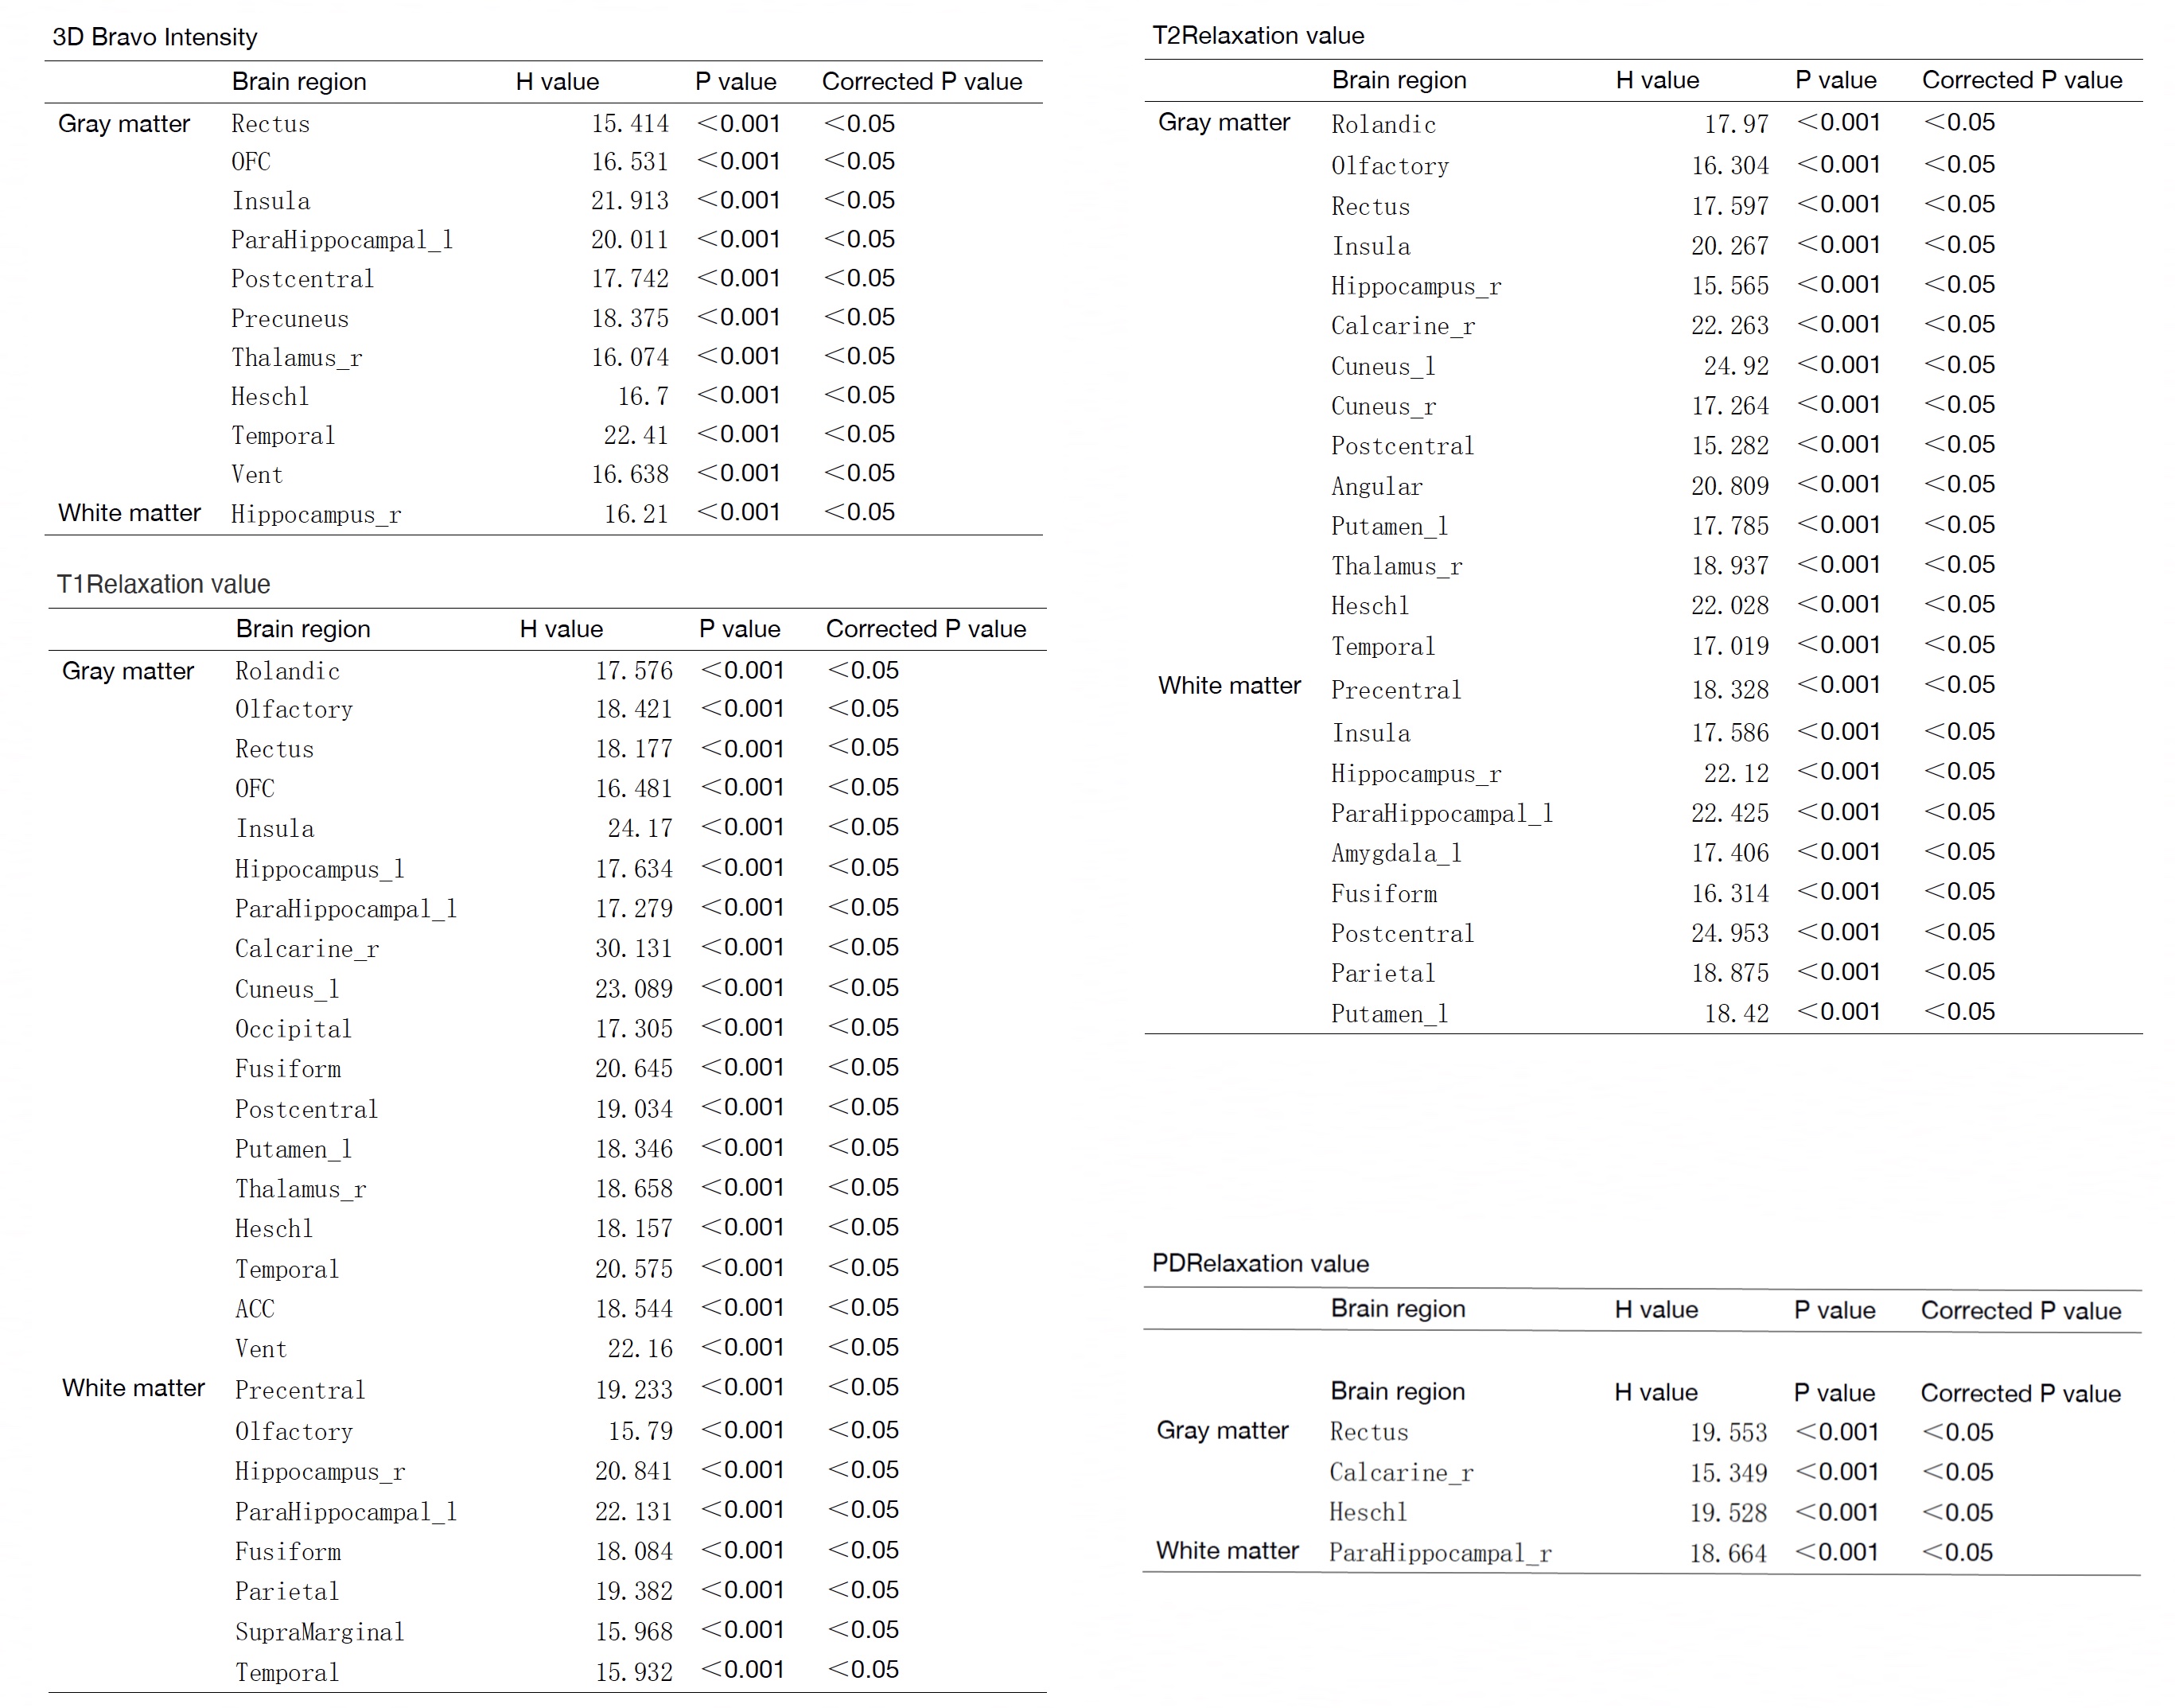
Significant differences in T1, T2, and PrD values were observed among the three groups. Notably, ESP and HC groups showed significant differences in T1 values in several brain regions. There were also significant differences in T2 values in specific brain regions. However, no significant difference was found in PrD values between ESP and HC groups. Six quantitative parameters from the calcarine, cuneus, and hippocampus were selected for further ROC analysis. The combined diagnosis model significantly improved diagnostic performance, with an AUC of 0.930, accuracy of 0.890, sensitivity of 0.871, and specificity of 0.920.Discussion and Conclusion
The study utilized synthetic MRI to systematically investigate brain regions in PD patients at different stages. Notably, alterations in relaxivity were found primarily in the calcarine, cuneus, and hippocampus, aligning with previous research indicating early white matter changes in the hippocampus in PD patients. The combined diagnosis model, using T1 and T2 values in these three brain regions, showed satisfactory diagnostic performance in distinguishing ESP patients from HC. In summary, the study suggests that synthetic MRI-derived parameters could potentially serve as specific quantitative biomarkers for the early diagnosis of PD.Acknowledgements
Thanks to the Department of Science and Technology of Inner Mongolia Autonomous Region for the financial support of the Application Technology and Development Fund project of multimodal magnetic resonance functional imaging in the brain of Parkinson's disease patients (project number: 2020GG0179).References
[1] Ehringer H, and Hornykiewicz O (1998) Distribution of noradrenaline and dopamine (3-hydroxytyramine) in the human brain and their behavior in diseases of the extrapyramidal system. Parkinsonism Relat Disord. 4:53–57. doi:10.1016/S1353-8020(98)00012-1.
[2] Nyatega CO, Qiang L, Adamu MJ and Kawuwa HB (2022) Gray matter, white matter and cerebrospinal flfluid abnormalities in Parkinson’s disease: A voxel-based morphometry study. Front. Psychiatry. 13:1027907. doi: 10.3389/fpsyt.2022.1027907.
[3] Hagiwara A, Warntjes M, Hori M, et al. (2017) SyMRI of the brain: rapid quantification of relaxation rates and proton density, with synthetic MRI, automatic brain segmentation, and myelin measurement. Investig Radiol. 52:647-657.
[4] Saudargiene A, Radziunas A, Dainauskas JJ, Kucinskas V, Vaitkiene P, Pranckeviciene A, Laucius O, Tamasauskas A and Deltuva V (2022) Radiomic features of amygdala nuclei and hippocampus subfifields help to predict subthalamic deep brain stimulation motor outcomes for Parkinson‘s disease patients. Front. Neurosci. 16:1028996. doi: 10.3389/fnins.2022.1028996.
Figures