4377
Abnormalities of brain functional network in Parkinson’s disease at different stage1Zhengzhou University People’s Hospital & Henan Provincial People’s Hospital, Zhengzhou, China, 2Henan University People’s Hospital & Henan Provincial People’s Hospital, Zhengzhou, China, 3Xinxiang Medical University & Henan Provincial People’s Hospital, Zhengzhou, China, 4MR Research Collaboration, Siemens Healthineers Ltd., Beijing, China, 5Zhengzhou University People’s Hospital & FuWai Central China Cardiovascular Hospital, Zhengzhou, China
Synopsis
Keywords: Parkinson's Disease, Brain Connectivity, Parkinson's disease, fMRI
Motivation: Currently there are no effective non-invasive neuroimaging biomarkers to evaluate the progression of Parkinson's disease (PD).
Goal(s): To use graph theory analysis of resting-state functional MRI (rs-fMRI) to investigate the abnormalities of brain functional network in PD at different disease stages.
Approach: We evaluated the global and nodal indicators changes between PD at different disease stages by comparison with healthy control.
Results: Brain functional network topology was disrupted to a varying extent in patients with PD at different disease stages.
Impact: The findings of this study may enhance our understanding of the mechanisms underlying the progression of Parkinson's disease and contribute to the development of non-invasive neuroimaging biomarkers for monitoring disease progression.
Background or Purpose
Parkinson’s disease (PD) is a neurodegenerative disorder with some progressive impairment and an unclear pathogenesis. As a multi-system disease, some deficits in PD are suggested to arise from alterations in integrity of distributed brain neural networks. So many researchers have applied the resting-state functional magnetic resonance imaging (rs-fMRI) to investigate the characteristics of the functional network in PD patients and found impaired functional connectivity. However, most studies have primarily focused on early-stage PD patients and have not extensively explored the progressive brain changes across different stages of the disease [1-3]. Graph theory analysis of rs-fMRI data has been proven to be a powerful tool to characterize the global topological organization of brain networks. Therefore, this study aims to investigate the brain functional network topology alterations in different disease stages of PD using graph theory approaches.Methods
This study recruited 49 patients diagnosed with PD according to the clinical diagnostic criteria of the Movement Disorder Society, along with 22 age- and sex-matched healthy controls (HC). All PD patients underwent assessments using the Movement Disorder Society's Unified Parkinson's Disease Rating Scale (MDS-UPDRS), Hoehn and Yahr (H&Y) stage, and Mini-Mental State Examination (MMSE). Patients with H&Y ≤ 2.5 were assigned to the early-stage PD group (PD-E, n=26), while those with H&Y ≥ 3 were assigned to the middle-to-late stage PD group (PD-M, n=23).All participants underwent MR imaging using a 3-T system (MAGNETOM Prisma, Siemens Healthcare, Erlangen, Germany) equipped with a 64-channel head/neck coil. The rs-fMRI data was acquired with the following parameters: TR= 2s, TE= 35ms, resolution = 2.2mm×2.2mm×2.2mm, measurements = 180. PD patients were scanned in the "on" state while taking antiparkinsonian drugs.
Image processing was performed using the Graph Theoretical Network Analysis (GRETNA) toolbox [4]. The global metrics including clustering coefficient (Cp), characteristic path length (Lp), local efficiency (Eloc) and global efficiency (Eglobal) were acquired. The nodal centrality metrics inlcuding nodal degree, nodal efficiency, and nodal betweenness were obtained.
Statistical analyses were conducted using SPSS 23.0 and GRETNA statistics modules. One-way analysis of variance with age, gender, and education as covariates was used to determine network differences among the three groups. Post hoc two-sample t-tests were performed. P< 0.005 with false discovery rate correction was considered statistically significant.
Results
In the defined threshold range, all three groups exhibited small-world topologic organization. Significant group effects were observed in the area under the curves (AUCs) of Cp and Eloc. Post-hoc tests revealed that PD-M had significantly lower Cp and Eloc compared to HC, while no significant differences in global metrics were found between PD-E and HC or between PD-E and PD-M (Fig 1).We identified brain regions with significant between-group differences in at least one nodal metric (p<0.005, FDR corrected). Significant group differences were found in the left middle frontal gyrus (MFG.L), orbital part of the right middle frontal gyrus (ORBmid.R), left fusiform gyrus (FFG.L), temporal pole of the left middle temporal gyrus (TPOmid.L), and temporal pole of the right middle temporal gyrus (TPOmid.R) (Fig 2). Post-hoc tests demonstrated that PD-M had increased nodal centralities in MFG.L and ORBmid.R compared to HC and PD-E. Furthermore, no significant differences in nodal centralities were observed between HC and PD-E. PD-E and PD-M exhibited decreased nodal centralities in FFG.L, TPOmid.L, and TPOmid.R compared to HC, but no significant differences in nodal centralities were found between PD-E and PD-M.
Discussion and Conclusion
Significant decreases in Cp and Eloc were observed in PD-M, suggesting an imbalance in the brain functional network in middle and late stages of PD [5]. In addition to these global topologic changes, PD patients at different disease stages exhibited specific and significant impairments in nodal centralities in several regions of the brain functional network [6]. Both PD subgroups showed decreased nodal centralities in temporal-occipital regions, indicating early visual processing difficulties in PD patients, consistent with previous findings showing functional changes in the cortical visual system before the clinical manifestation of visual symptoms [7, 8]. Increased node-centrality in the medial frontal gyrus was observed in PD-M patients compared to HC and PD-E patients, suggesting a compensatory mechanism in which PD patients enhance executive control to overcome weak anatomical connections between suppressed regions as the disease progresses [9]. In conclusion, this study found that the brain functional connectome was disrupted at varying degree in patients with PD at different disease stages. These findings contribute to our understanding of the topological changes in the neural network associated with the severity of PD.Acknowledgements
National Natural Science Foundation of China(82371934), Joint Fund of Henan Province Science and Technology R&D Program(225200810062), Medical Science and Technology Research Project of Henan Province(SBGJ202303007).References
[1]Sang L, Zhang J, Wang L, et al. Alteration of Brain Functional Networks in Early-Stage Parkinson's Disease: A Resting-State fMRI Study. Plos One. 2015, 10(10): e0141815.
[2]Fang J, Chen H, Cao Z, et al. Impaired brain network architecture in newly diagnosed Parkinson's disease based on graph theoretical analysis. Neurosci Lett. 2017, 657: 151-158.
[3]Göttlich M, Münte T F, Heldmann M, et al. Altered resting state brain networks in Parkinson's disease. Plos One. 2013, 8(10): e77336.
[4]Wang J, Wang X, Xia M, et al. GRETNA: a graph theoretical network analysis toolbox for imaging connectomics. Front Hum Neurosci. 2015, 9: 386.
[5]Latora V, Letters M M J P r. Efficient behavior of small-world networks. Phys Rev lett. 2001, 87(19): 198701.
[6]Luo C Y, Guo X Y, Song W, et al. Functional connectome assessed using graph theory in drug-naive Parkinson's disease. J Neurol. 2015, 262(6): 1557-1567.
[7]Cardoso E F, Fregni F, Maia F M, et al. Abnormal visual activation in Parkinson's disease patients. Movement Disord. 2010, 25(11): 1590-1596.
[8]Uc E Y, Rizzo M, Anderson S W, et al. Visual dysfunction in Parkinson disease without dementia. Neurology. 2005, 65(12): 1907-1913.
[9]Li C-s R, Neuroscience R S J, Reviews b. Inhibitory control and emotional stress regulation: neuroimaging evidence for frontal-limbic dysfunction in psycho-stimulant addiction. Neurosci Biobehav R. 2008, 32(3): 581-597.
Figures
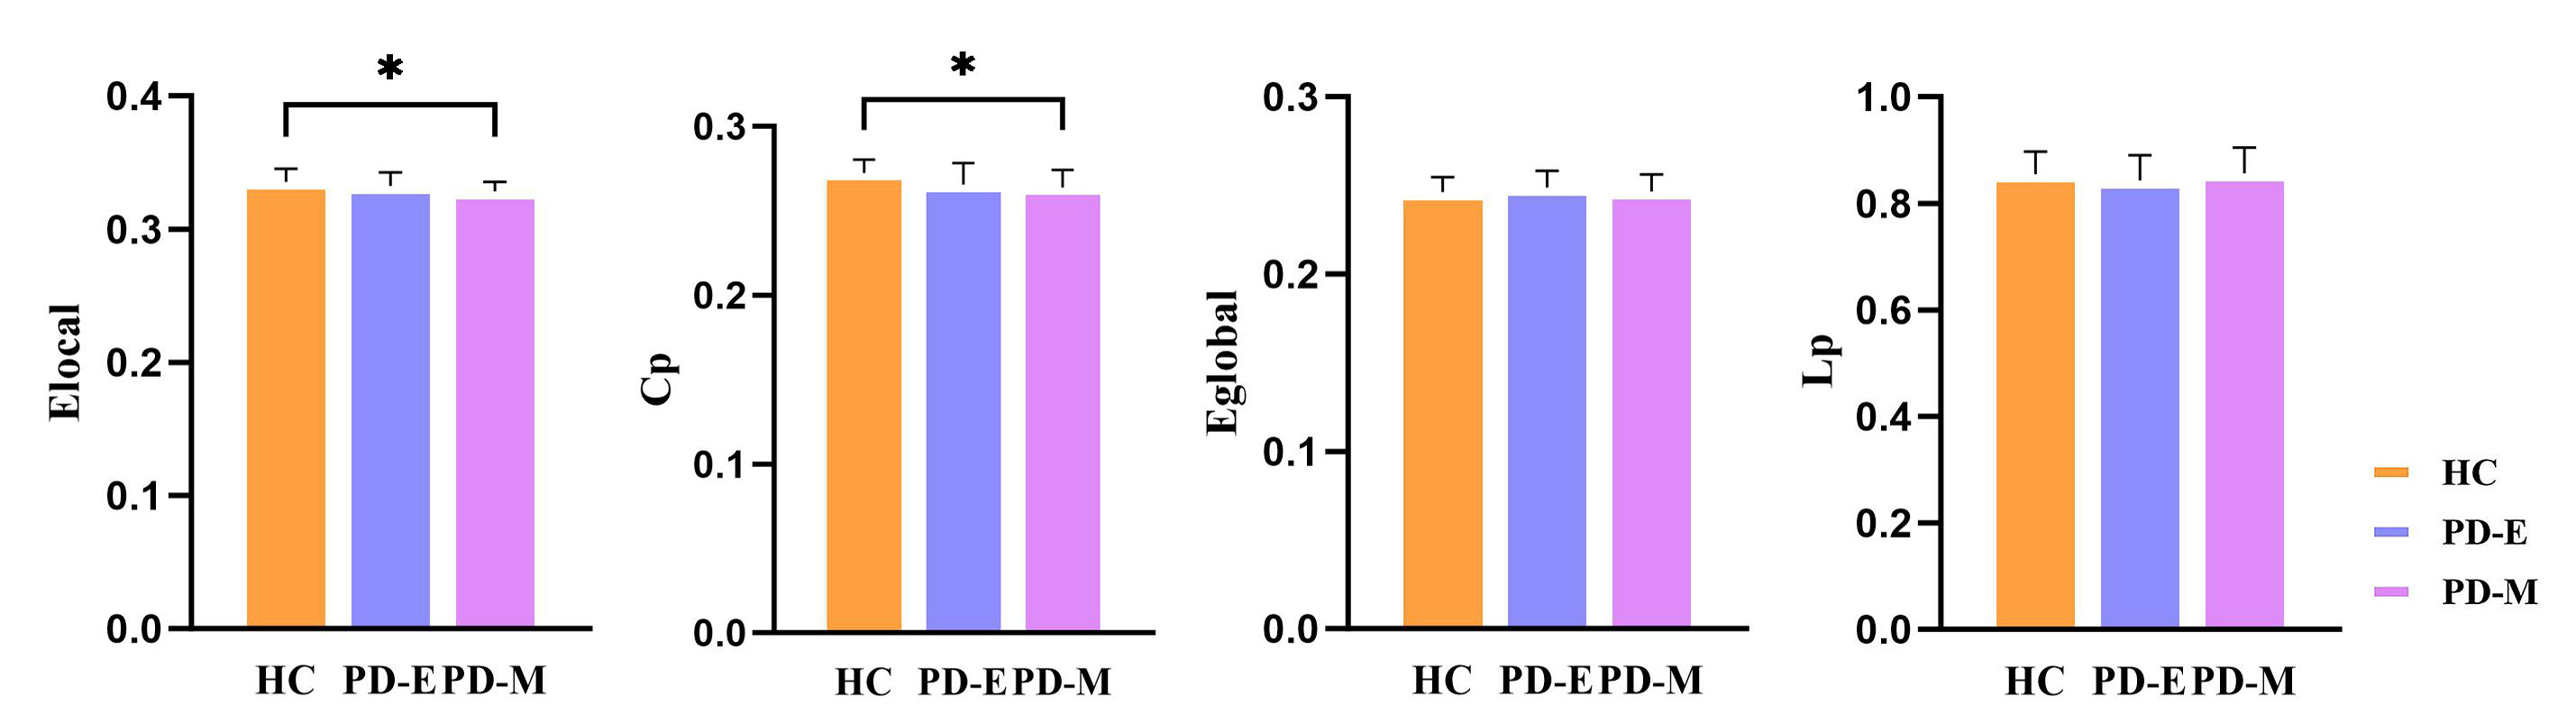
Figure.1. Global network properties comparison among the three groups.
Asterisks indicate significant differences (P < 0.05) in post hoc testing. Abbreviations:PD-E, PD with early-stage; PD-M, PD with middle-to-late stage; HC, healthy control. Network parameters: Cp, clustering coefficient; Lp, characteristic path length; Eloc, local efficiency; Eglob, global efficiency.
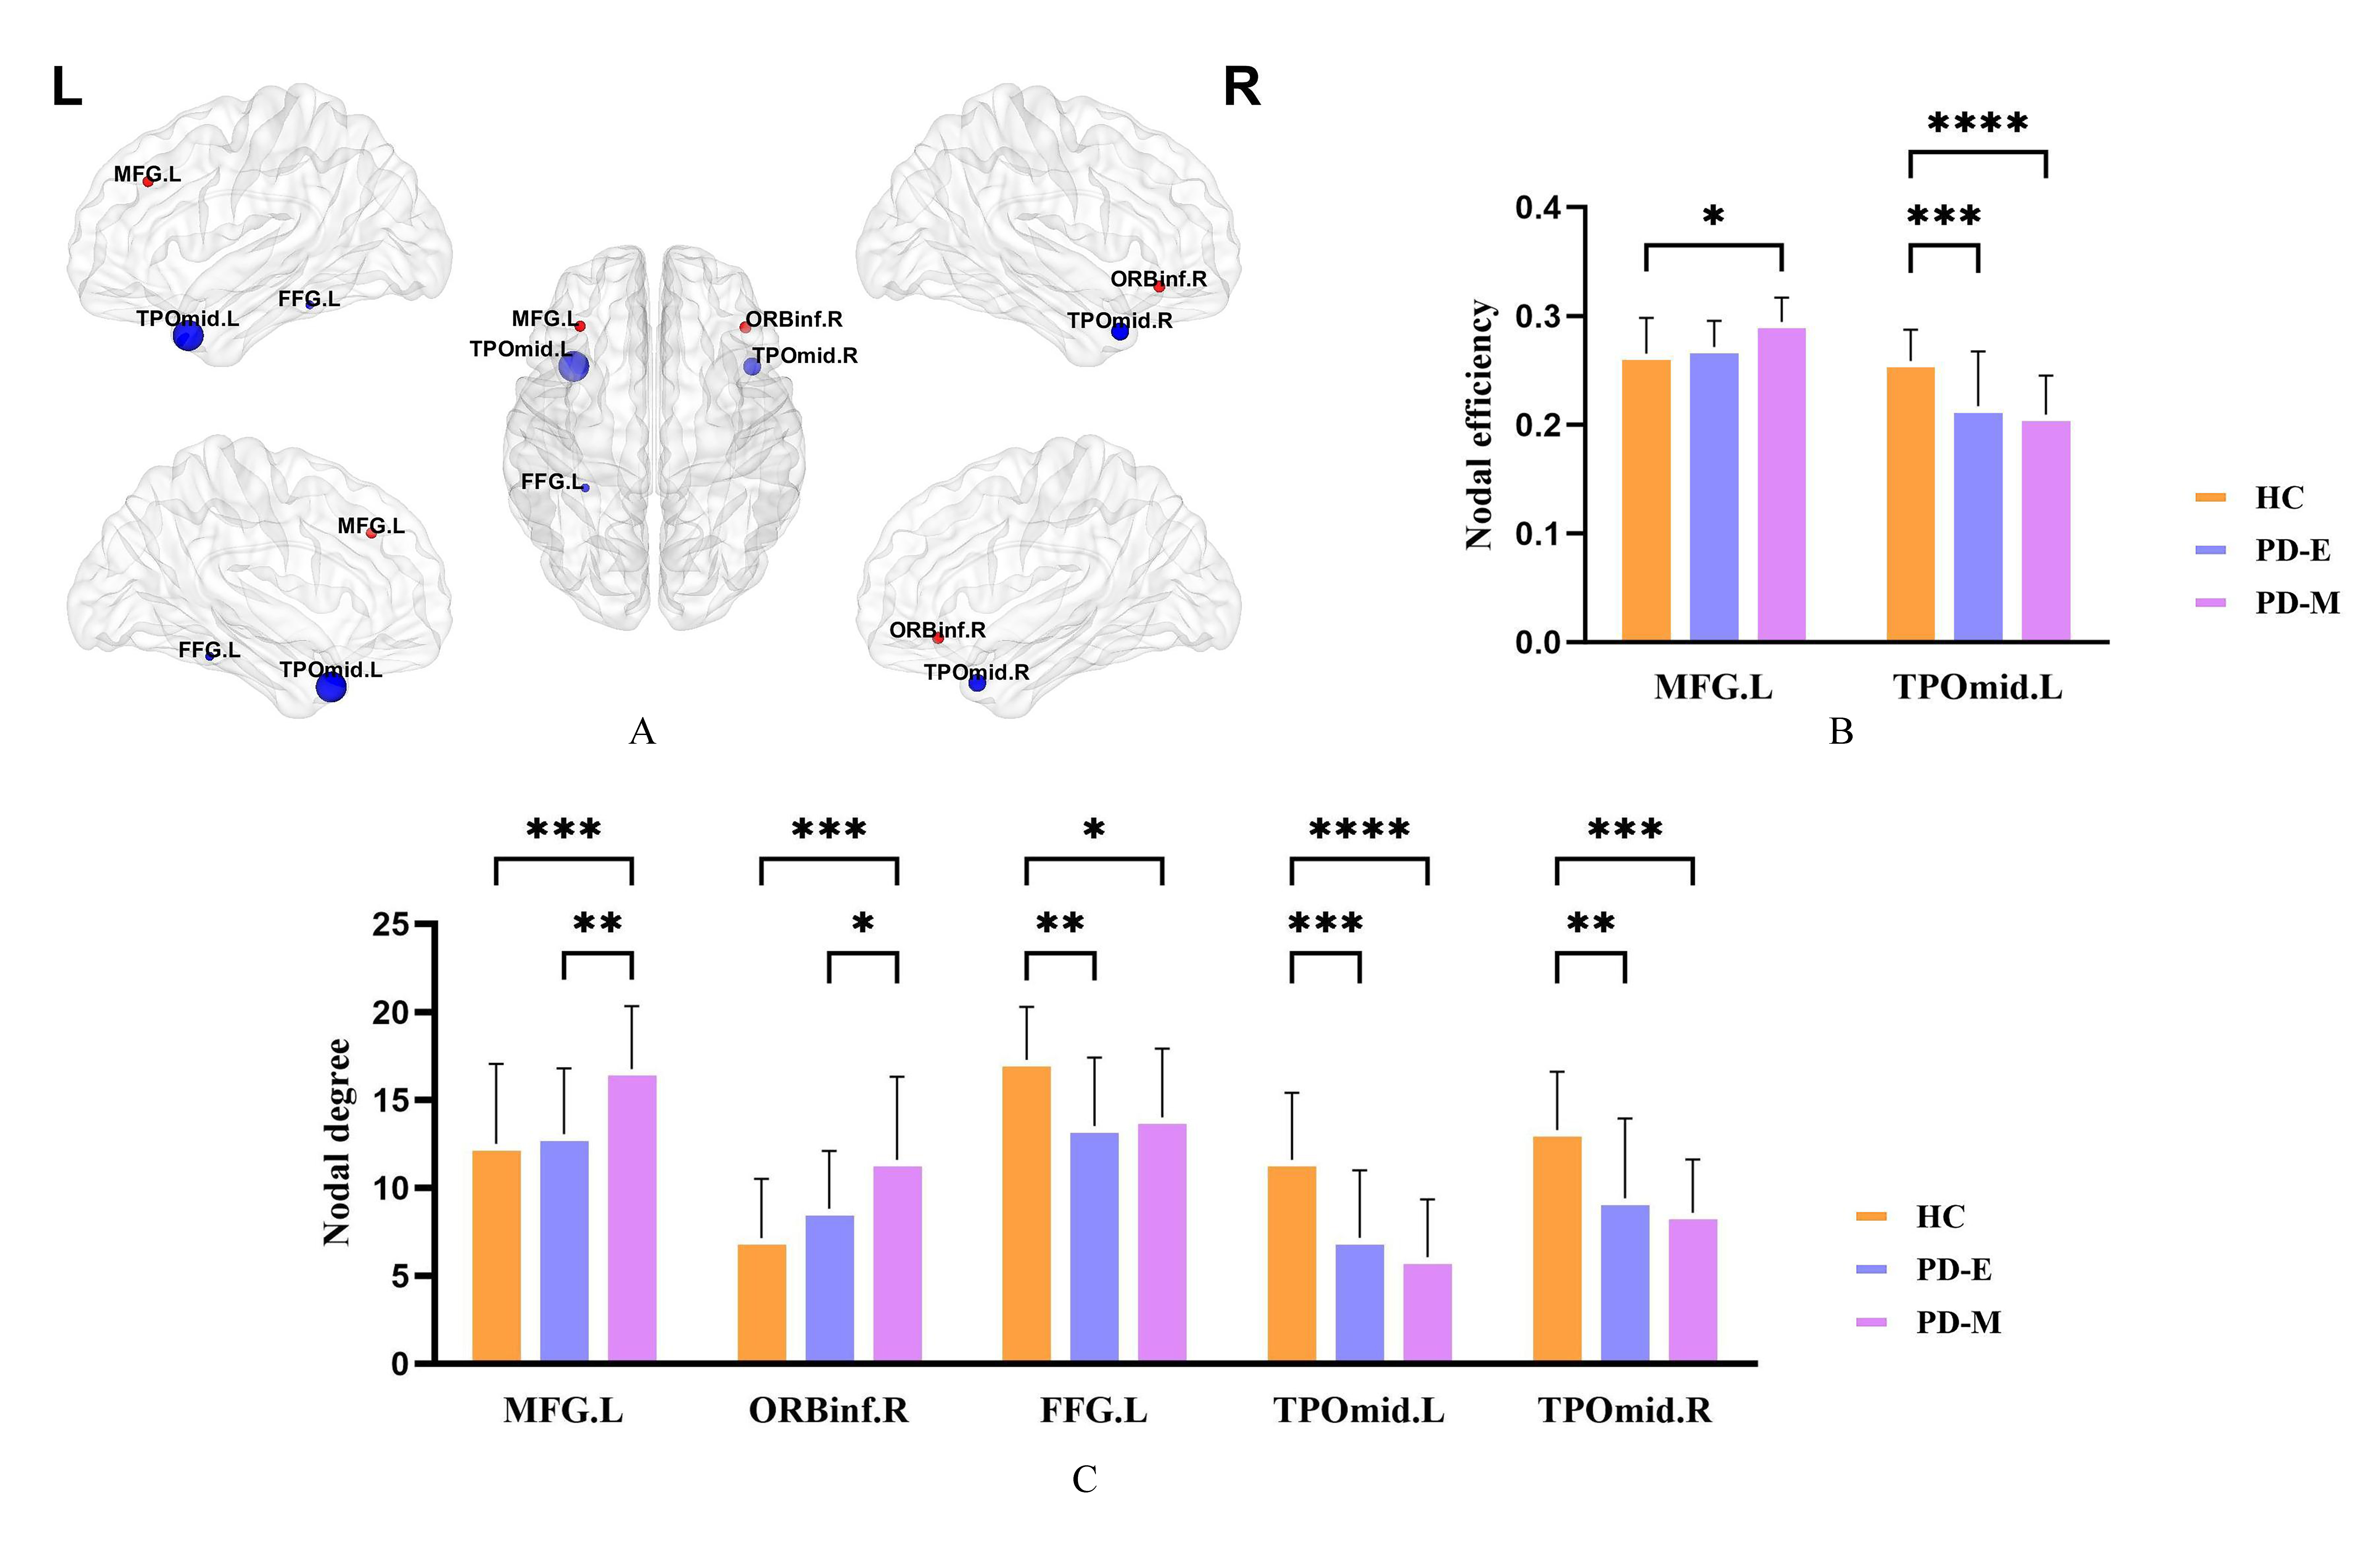
Figure.2. Brain regions showing abnormal nodal centrality in the three groups.
In (A), regions with significant group differences (P < 0.005, FDR corrected) are visualized. In (B and C), asterisks indicate significant differences (*P < 0.05, **P < 0.01, ***P < 0.001, and ****P < 0.0001) in post hoc testing.. Abbreviations: PD-E, PD with early-stage; PD-M, PD with middle-to-late stage; HC, healthy control; MFG, middle frontal gyrus; ORBinf, orbital part of middle frontal gyrus; FFG, fusiform gyrus; TPOmid, temporal pole of middle temporal gyrus; L, left; R, right.