4374
Perfusion dynamics in a mouse line of Parkinson’s Disease1Champalimaud Research, Champalimaud Foundation, Lisbon, Portugal, 2Institute for Systems and Robotics - Lisboa and Department of Bioengineering, Instituto Superior Técnico, Universidade de Lisboa, Lisbon, Portugal, 3C.J. Gorter Center for High Field MRI, Department of Radiology, Leiden University Medical Center, Leiden, Netherlands, 4Université Grenoble Alpes, Inserm, Grenoble Institut des Neurosciences, Grenoble, France
Synopsis
Keywords: Parkinson's Disease, Parkinson's Disease
Motivation: Parkinson disease patients show alterations in their vascular system, exhibiting lower perfusion than healthy subjects.
Goal(s): Here, we harness a mouse model exhibiting extensive human α-syn deposition to investigate cerebral blood flow properties in PD.
Approach: We use a novel setup enabling high resolution Pseudo-Continuous Arterial Spin Labelling, a non-invasive technique for perfusion mapping in-vivo without injection of contrast agentes.
Results: We found that not only the PD mouse line but also their WT littermates have altered perfusion properties across the brain compared to control c57bl/6 mice.
Impact: Our findings highlight the importance of accounting for these potential sources of variability in future work with these lines.
Introduction
Parkinson's disease (PD) is a prevalent neurodegenerative disorder typically manifesting α-synuclein (α-syn) deposition, loss of dopaminergic neurons, brain atrophy, severe motor symptoms and cognitive decline1. Interestingly, the vascular system may be also implicated in the disease, with patients also reported to exhibit reduced venous outflow and lower perfusion compared to healthy subjects2. Here, we harness a mouse model of PD3 exhibiting extensive human -syn deposition to investigate cerebral blood flow properties in PD. We use a novel setup enabling high resolution Pseudo-Continuous Arterial Spin Labelling, a non-invasive technique for perfusion mapping in-vivo without injection of contrast agents4.Methods
All animal experiments were conducted according to the European Directive 2010/63 and preapproved by competent national and institutional authorities.Animal Preparation: Adult C57BL/g mice (~20 weeks old, weights 25–30g) (N=3), the transgenic αSYN mouse model (C57BL/6-DBA/2 Thy1-αSYN) (N=3) and their wildtype littermates (healthy controls, N=3) 36-42 weeks of age and weighing 42±15g, were housed in 12h/12h light/dark cycles with ad-libitum access to food and water. Animals were sedated using 1.5-2.5% isoflurane. Respiratory rate was kept at 60-90bpm.
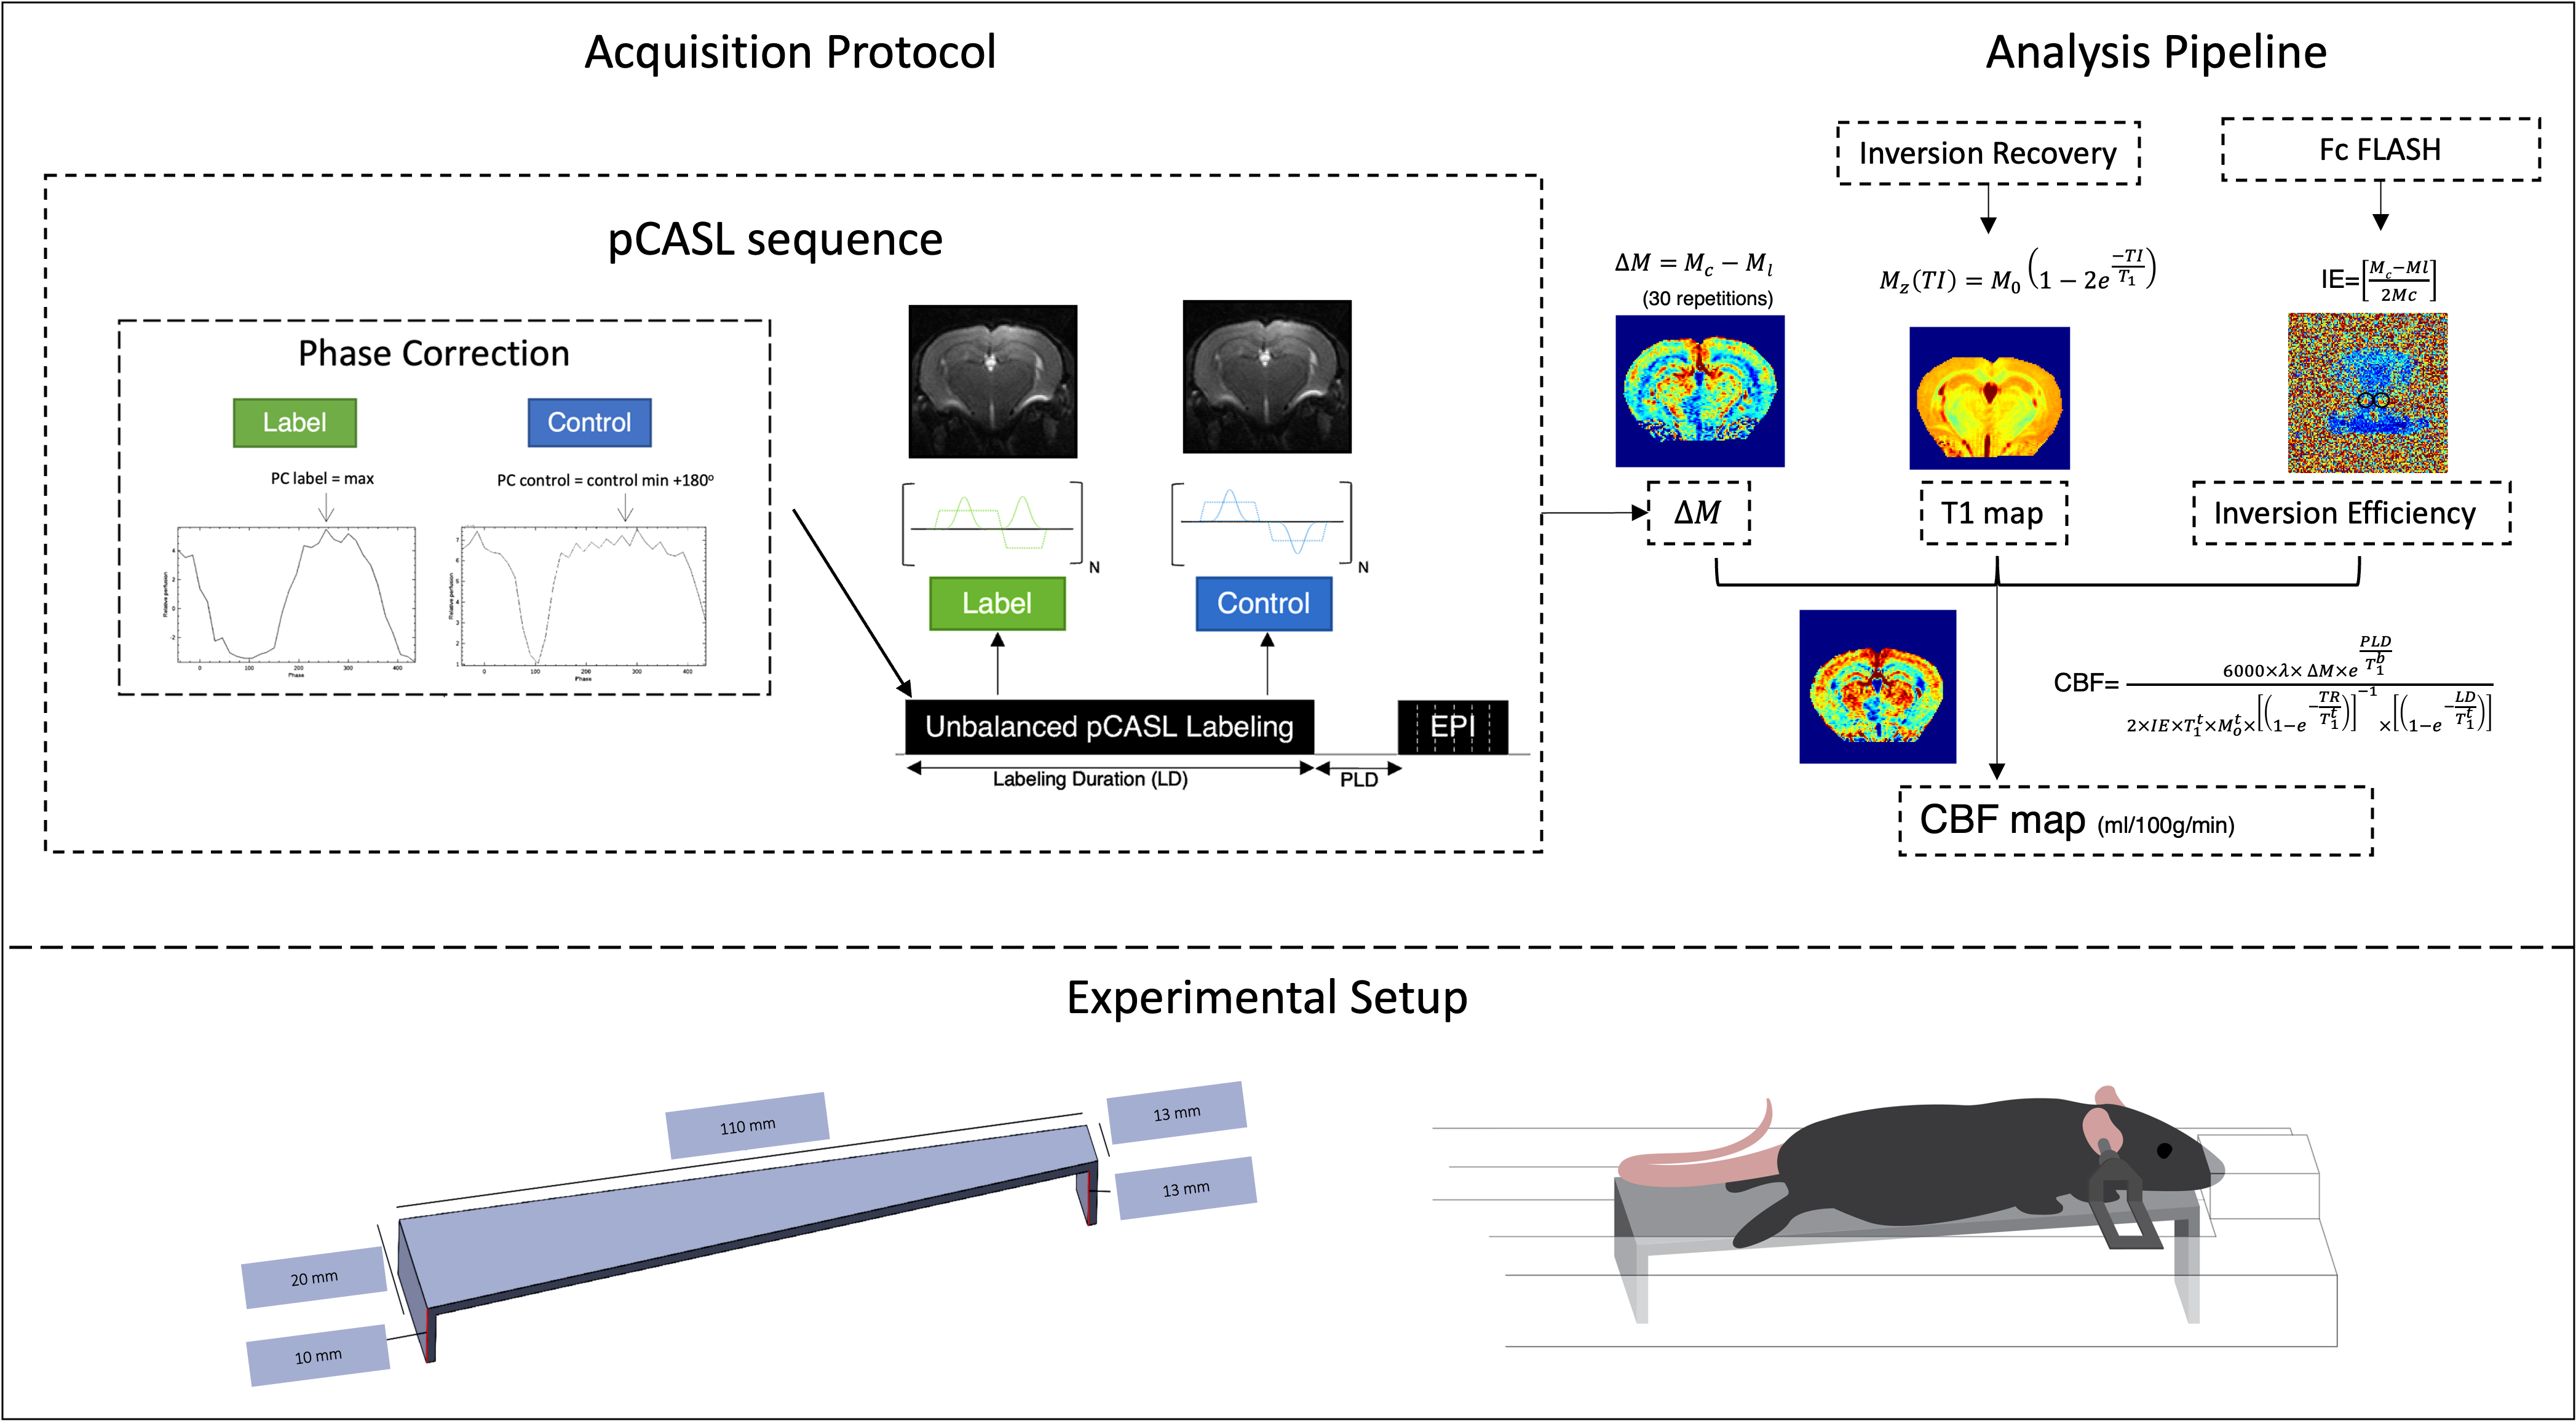
pCASL experiments: An unbalanced pCASL sequence was used as described in Hirschler et al. (2018)5. The mice were positioned on top of a custom-built ramp to control carotid positioning for increased labelling efficiency. The labelling plane was positioned at the mouse neck (~8mm below the isocenter), labelling duration (LD)=3s , post-labelling delay (PLD)=300ms. A single-shot EPI was implemented: FOV=12x12mm2, slice thickness=0.5mm, spatial resolution=100x100m2, TR/TE=4000/25ms, 30 repetitions, Tacq=4min. For cerebral blood flow (CBF) quantification, the T1 map was obtained from an inversion recovery sequence6. A pCASL encoded FLASH was employed to estimate the inversion efficiency (IE) 3mm above the labelling plane (PLD=0ms, LD=200ms)5. The analysis pipeline and the experimental setup are presented in Figure 1.
Data Analysis: CBF maps (ml/100g/min) was calculated pixel-by-pixel6 to obtain high resolution CBF maps. T-tests were used to compare the average whole-brain CBF values across 3 different groups.
Results
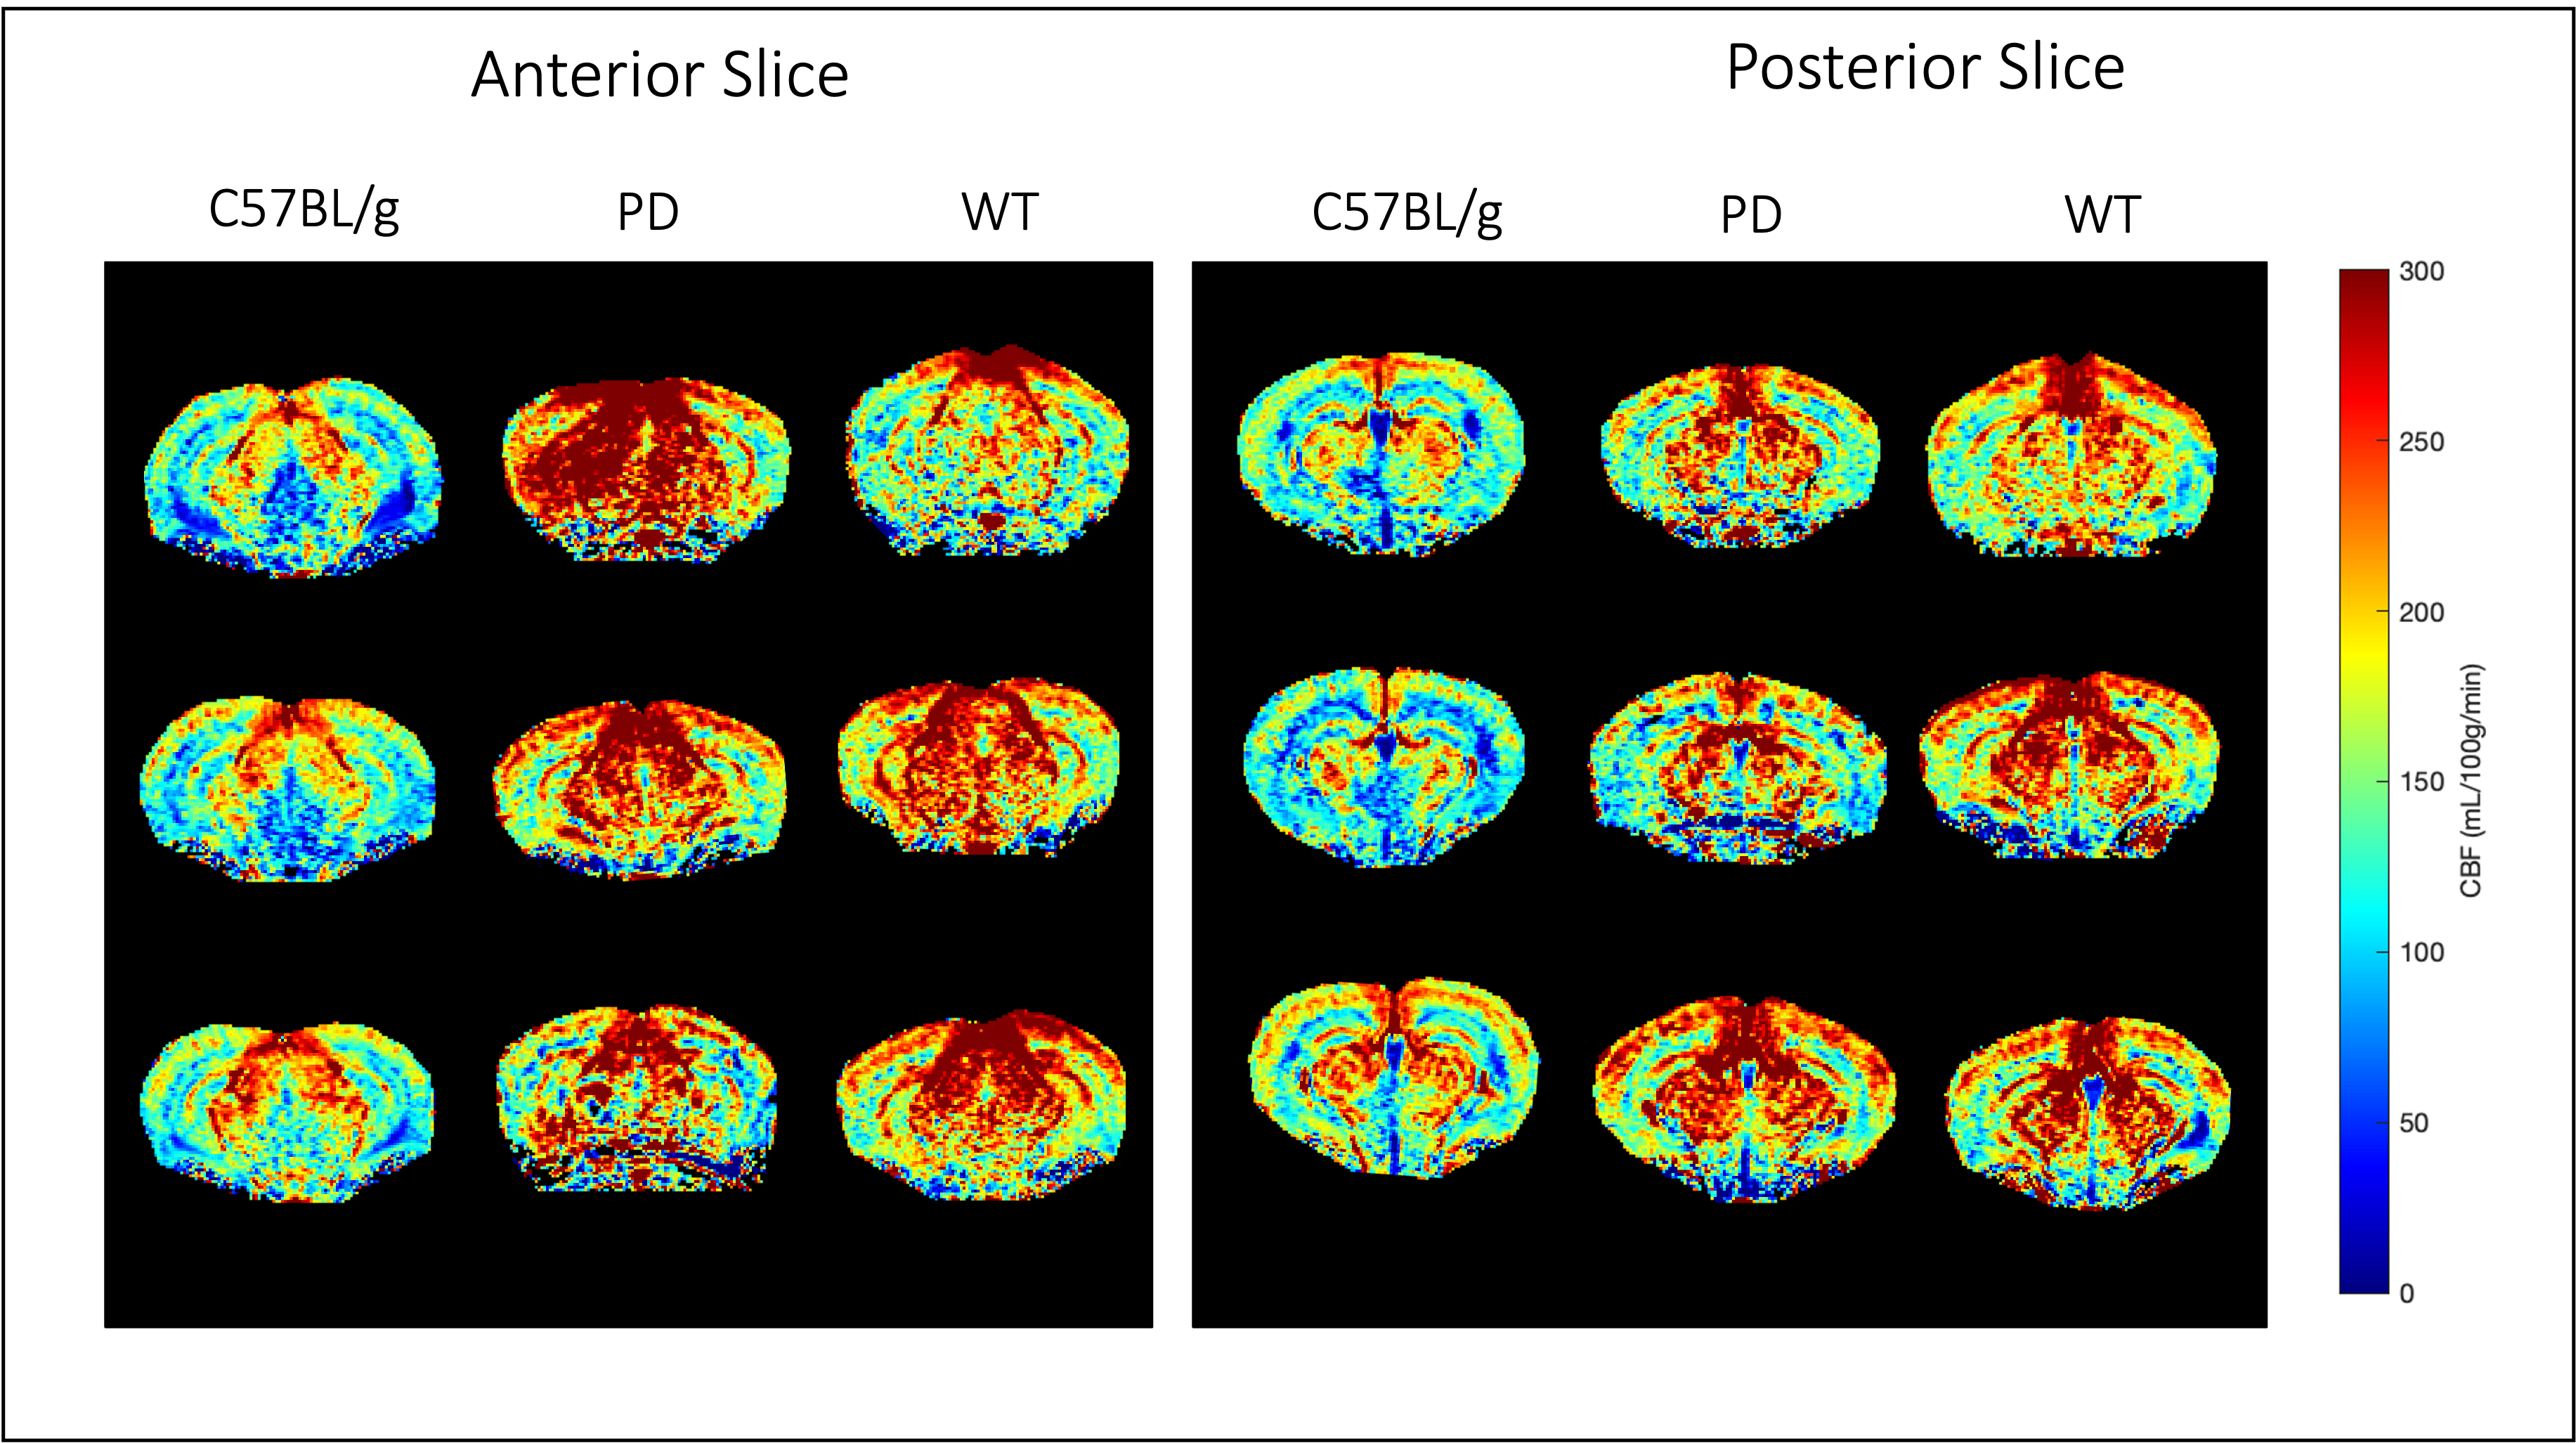
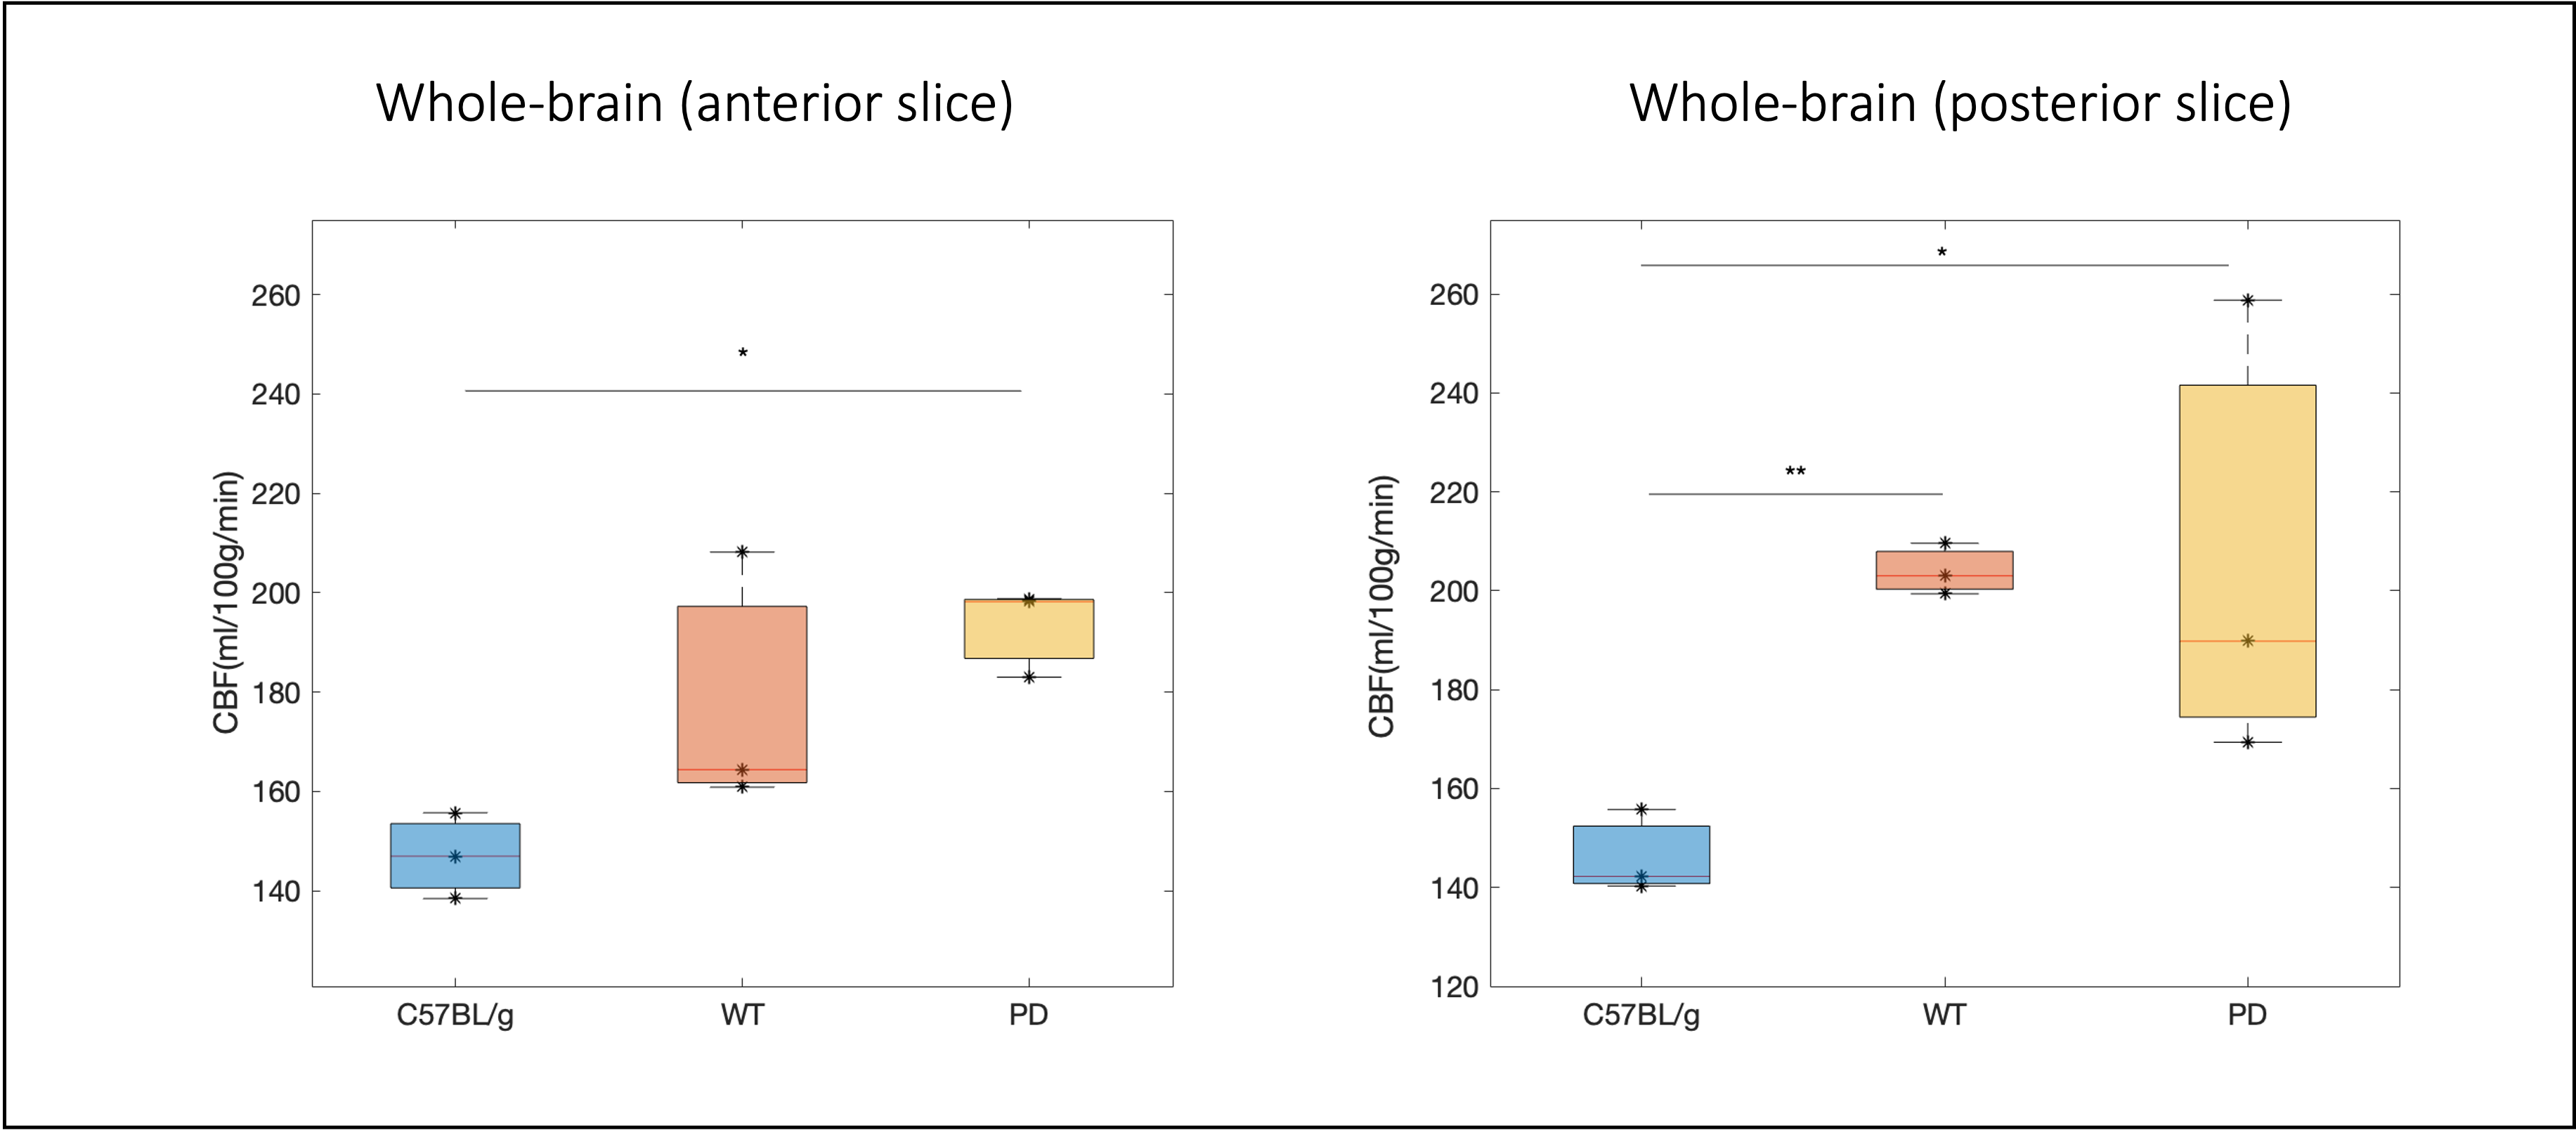
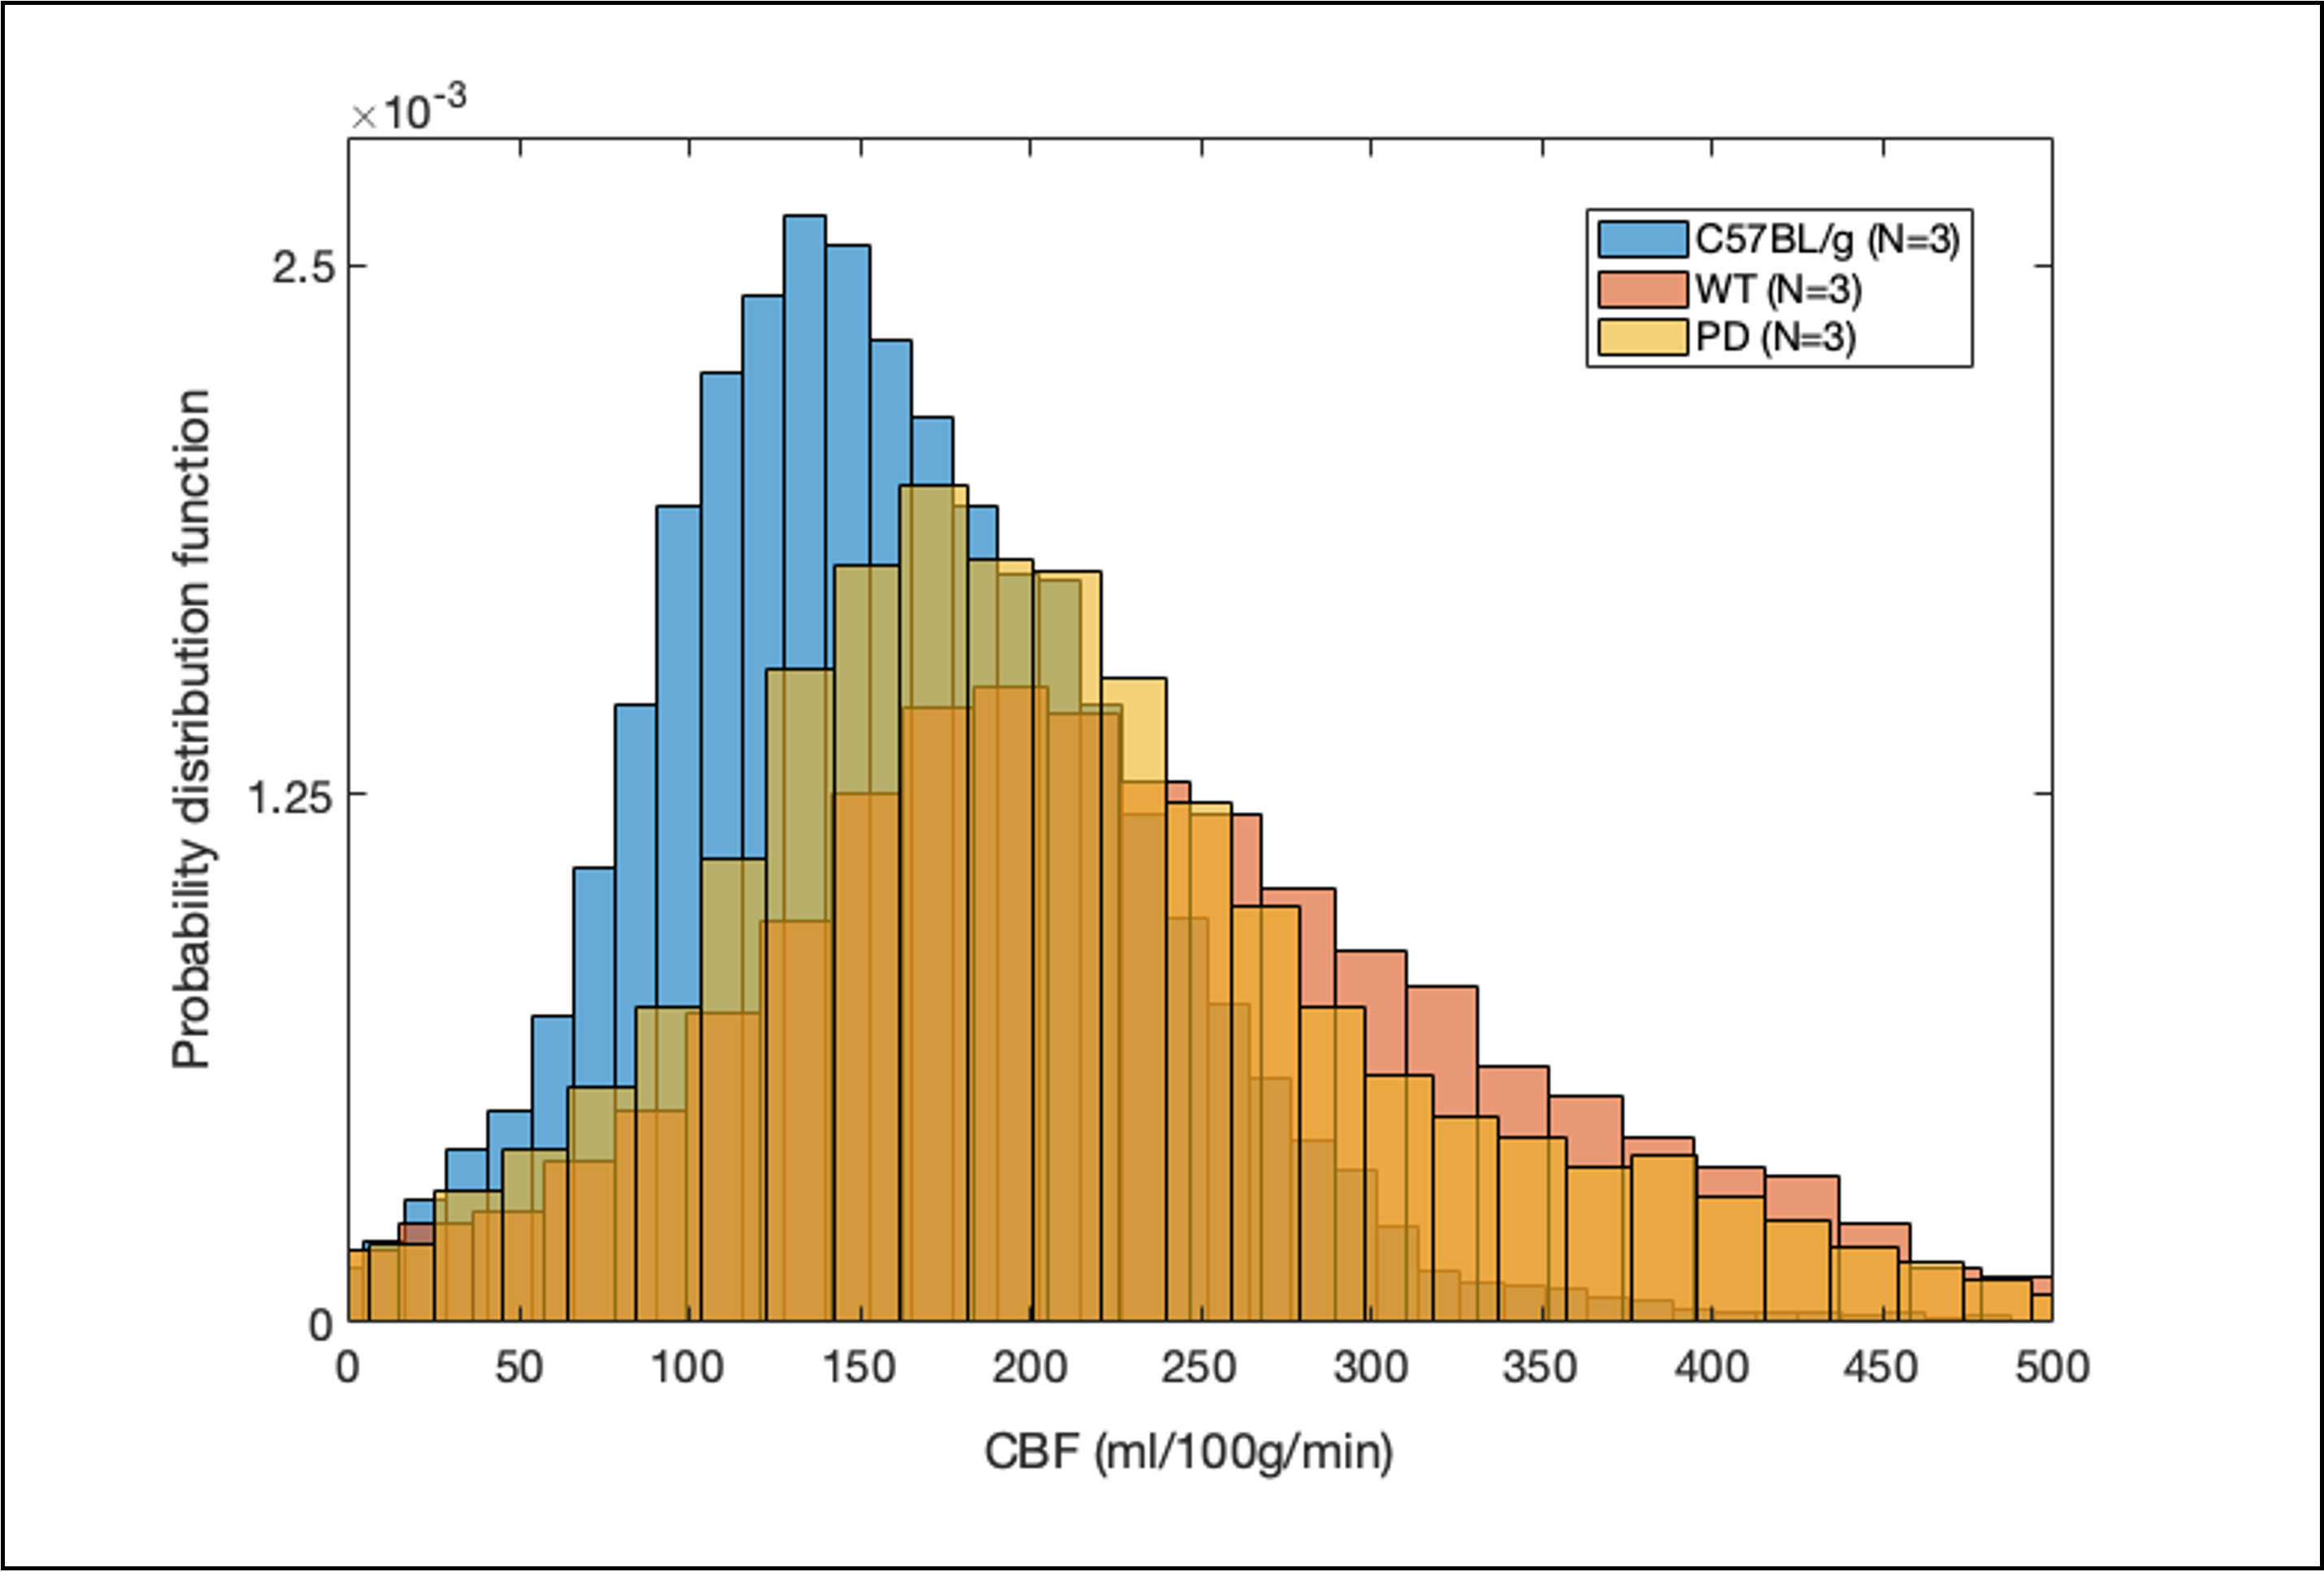
CBF maps for two different slices (one more posterior and one more anterior) for the 3 animals in the 3 groups is displayed in Figure 2. Clear differences in perfusion brain-wide can be observed with pronounced increased perfusion in the PD and their WT littermates when compared to the C57BL/g are obvious, mostly in cortical and thalamic regions. Distributions across animals of the whole-brain average CBF (Figure 3) further show that the PD model shows significantly increased perfusion compared to the C57BL/g mouse line, but not compared to its wildtype littermates, which also exhibit higher CBF than the C57BL/g (paired t tests, p<0.05). The probability distribution function of CBF values (Figure 4) reveals the skewed distribution across the brain between the 3 groups, with WT peaking at the highest CBF values, followed by the PD, both having broad CBF distributions across the brain when compared to the C57BL/g.Discussion
Our findings suggest that the PD mouse line and their WT littermates have altered perfusion properties across their entire brains compared to control C57bl/6 mice. Thus, local effects of α-syn deposition may not fully explain the altered vascular properties. The much higher values compared with the standard C57BL/g mouse line likely reflect either an underlying genetic difference between the strains causing higher perfusion in the PD line, or otherwise reflect other auxiliary factors (e.g. how isoflurane affects perfusion between the lines). Future experiments in awake animals and physiological measurements of e.g. heart-rate, blood pressure, and vascular density could further narrow down the sources of these differences. Nevertheless, our findings highlight the importance of accounting for these potential sources of variability in future work with these lines. Furthermore, a previous study7 on a similar α-syn line found decreased perfusion between PD and WT, likely somewhat consistent with the general trends observed here, although they scanned the animals at a later stage. However, they do not compare with the C57BL/g mouse line. Finally, these results go against the decrease in perfusion in PD patients previously reported in literature, perhaps due to the late stage in which the animals were imaged. Future research will increase the size of the cohort and should further map CBF along the entire time course of the disease to understand the longitudinal properties of the vascular system in this mouse model.Acknowledgements
The authors acknowledge the vivarium of the Champalimaud Centre for the Unknown, a facility of CONGENTO which is a researchinfrastructure co-financed by Lisboa Regional Operational Programme (Lisboa 2020), under the PORTUGAL 2020 Partnership Agreement through the European Regional Development Fund (ERDF) and the Champalimaud Communication, Events and Outreach team. We would also like to acknowledge Fundação para a Ciência e Tecnologia (Portugal), under project LISBOA-01-0145-FEDER-022170 and grant 2021.08457.BD.References
1.Calabresi P, Di Filippo M. The changing tree in Parkinson’s disease. Nat Neurosci. Published online 2015. doi:10.1038/nn.4092
2. Zhang C,Wu B, Wang X et al. Vascular, flow and perfusion abnormalities in Parkinson's disease Parkinsonism Relat Disord. 2020 Apr;73:8-13.
3. Elabi O, Gaceb A, Carlsson R, et al. Human α-synuclein overexpression in a mouse model of Parkinson's disease leads to vascular pathology, blood brain barrier leakage and pericyte activation. Sci Rep. 2021 Jan 13;11(1):1120
4. Buck J, Larkin JR, Simard MA, et al. Sensitivity of multiphase pseudocontinuous arterial spin labelling (MP pCASL) magnetic resonance imaging for measuring brain and tumour blood flow in mice. Contrast Media Mol Imaging. 2018;2018
5. Hirschler L, Debacker CS, Voiron J, et al. Interpulse phase corrections for unbalanced pseudo-continuous arterial spin labeling at high magnetic field. Magn Reson Med. 2018;79(3):1314-1324.
6. Alsop DC, Detre JA, Golay X, et al. Recommended Implementation of ASL Perfusion MRI for Clinical Applications. Magn Reson Med. 2015;73(1):102-116.7. Biju K, Shen Q, Hernandez ET, Mader MJ, Clark RA. Reduced cerebral blood flow in an α -synuclein transgenic mouse model of Parkinson’s disease. J Cereb Blood Flow Metab. 2020;40(12).
Figures