4372
Hemoglobin A and S affects blood R1 differently: a comparative study in healthy controls and sickle cell disease patients1Mallinckrodt Institute of Radiology, Washington University School of Medicine, St. Louis, MO, United States, 2Department of Biology, Washington University in St. Louis, St. Louis, MO, United States, 3Department of Biomedical Engineering, Washington University in St. Louis, St. Louis, MO, United States, 4Department of Neurology, Washington University School of Medicine, St. Louis, MO, United States, 5Department of Pediatrics, Washington University School of Medicine, St. Louis, MO, United States, 6Department of Surgery, Washington University School of Medicine, St. Louis, MO, United States
Synopsis
Keywords: Other Neurodegeneration, Relaxometry, sickle cell disease, blood longitudinal relaxation rate, hematocrit, hemoglobin
Motivation: Blood R1 (R1Blood) is associated with hematocrit level (Hct). However, it is unclear whether Hct of normal hemoglobin (HctA) and sickle hemoglobin (HctS) have a similar impact on R1Blood.
Goal(s): Evaluate the impact of HctA and HctS on R1Blood in healthy controls and SCD patients.
Approach: Multiple linear regression with R1Blood as the dependent variable and Hct of combined hemoglobin A and F (HctAF), HctS, age, and sex as independent variables was performed.
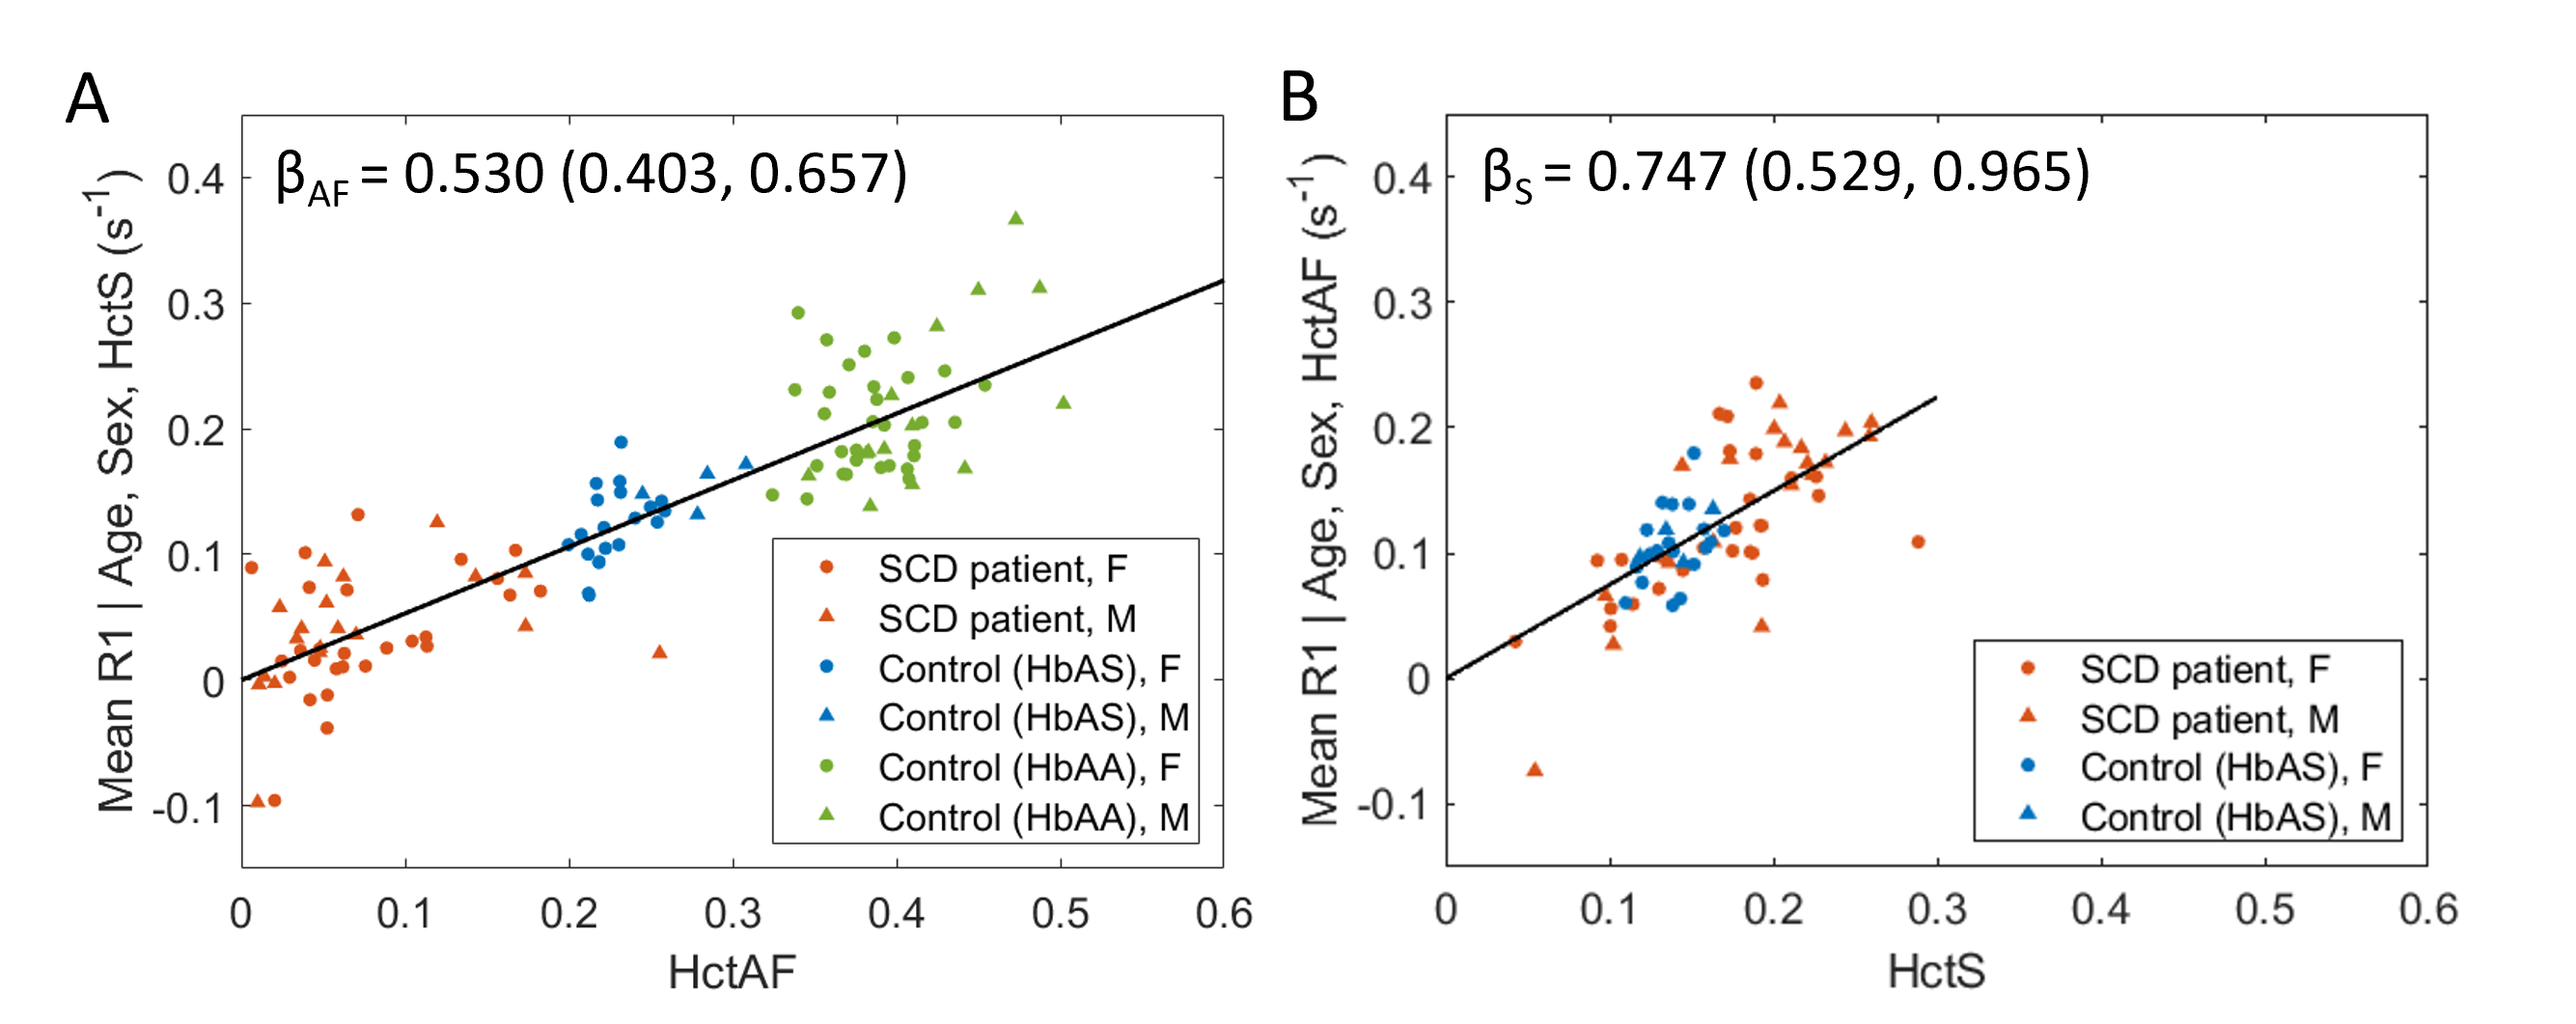
Results: R1Blood was associated with HctAF, HctS, age, and sex. Moreover, the association between R1Blood and HctS was significantly different from that between R1Blood and HctAF.
Impact: Blood R1 is essential in various MRI applications. Our findings are crucial for developing an accurate blood R1 estimation model in sickle cell disease patients.
Introduction
The longitudinal relaxation rate of blood (R1blood) is essential in various MRI applications(1,2). R1blood can be measured using inversion recovery MRI(3,4). Using bovine blood, Lu et al. demonstrated a linear relationship between R1blood and hematocrit (Hct) level(3). Wu et al. observed a linear relationship between R1blood and Hct using literature-reported Hct from several population subgroups based on age and sex in healthy humans(4). Thus far, the association between R1blood and Hct of normal hemoglobin (HctA) has not been measured based on individual participant’s data. Sickle cell disease (SCD) is a rare genetic disorder caused by an autosomal recessive mutation in the β-globin gene that results in the production of abnormal sickle hemoglobin (HbS). The association between R1blood and Hct level of sickle hemoglobin (HctS) remains unknown. Moreover, it is unclear whether HctA and HctS have a similar impact on R1Blood. This study aims to evaluate the impact of HctA and HctS on R1blood in healthy controls and SCD patients.Methods
Sixty-nine healthy controls (45 HbAA and 24 HbAS traits) and 46 SCD patients (HbSS or HbSβthal0) were included. MR images were acquired on Siemens Prisma 3T scanners (Siemens Healthineers, Erlangen, Germany). R1blood in the superior sagittal sinus was measured using a fast inversion recovery sequence (TE/TR=24/5000ms, voxel size=1.6x1.6x2.0mm, single sagittal slice, acquisition time=90sec). Total Hct and percentage of Hb isoforms (A (including A2), F, and S) were obtained within 30 days of the MRI scan for healthy controls and within 10 days for SCD patients. HctA, HctF, and HctS were calculated as total Hct times respective Hb isoform percentages.Previous studies demonstrated that Hct, age, and sex might affect R1blood in healthy blood. Therefore, we model R1blood as R1blood= β0 + βA*HctA + βF*HctF + βS*HctS + βAge*Age + βSex*Sex. As the percentage of HbF was much smaller than that of HbA and HbS, we combined HctA and HctF as HctAF=HctA+HctF in further analysis, assuming HctA and HctF have a similar impact on R1blood,. Model 1 was then formulated as Model 1: R1blood= β0 + βAF*HctAF + βS*HctS + βAge*Age + βSex*Sex. A multiple linear regression was used to fit the model parameters using all participants (N=115). The difference between βAF and βS was tested using the regression coefficients from the multiple linear regression, parameter variance, and covariance. To evaluate the robustness of βAF estimation, a separate multiple linear model Model 2: R1blood= β0 + βAF*HctAF + βAge*Age + βSex*Sex was fitted using HbAA healthy controls only (N=45).
Finally, to directly compare the βAF measured in this study with a previous study(3), which does not include age and sex in the model, Model 3: R1blood = β0 + βAF*HctAF was fitted with univariate linear regression using HbAA healthy controls only (N=45).
Results
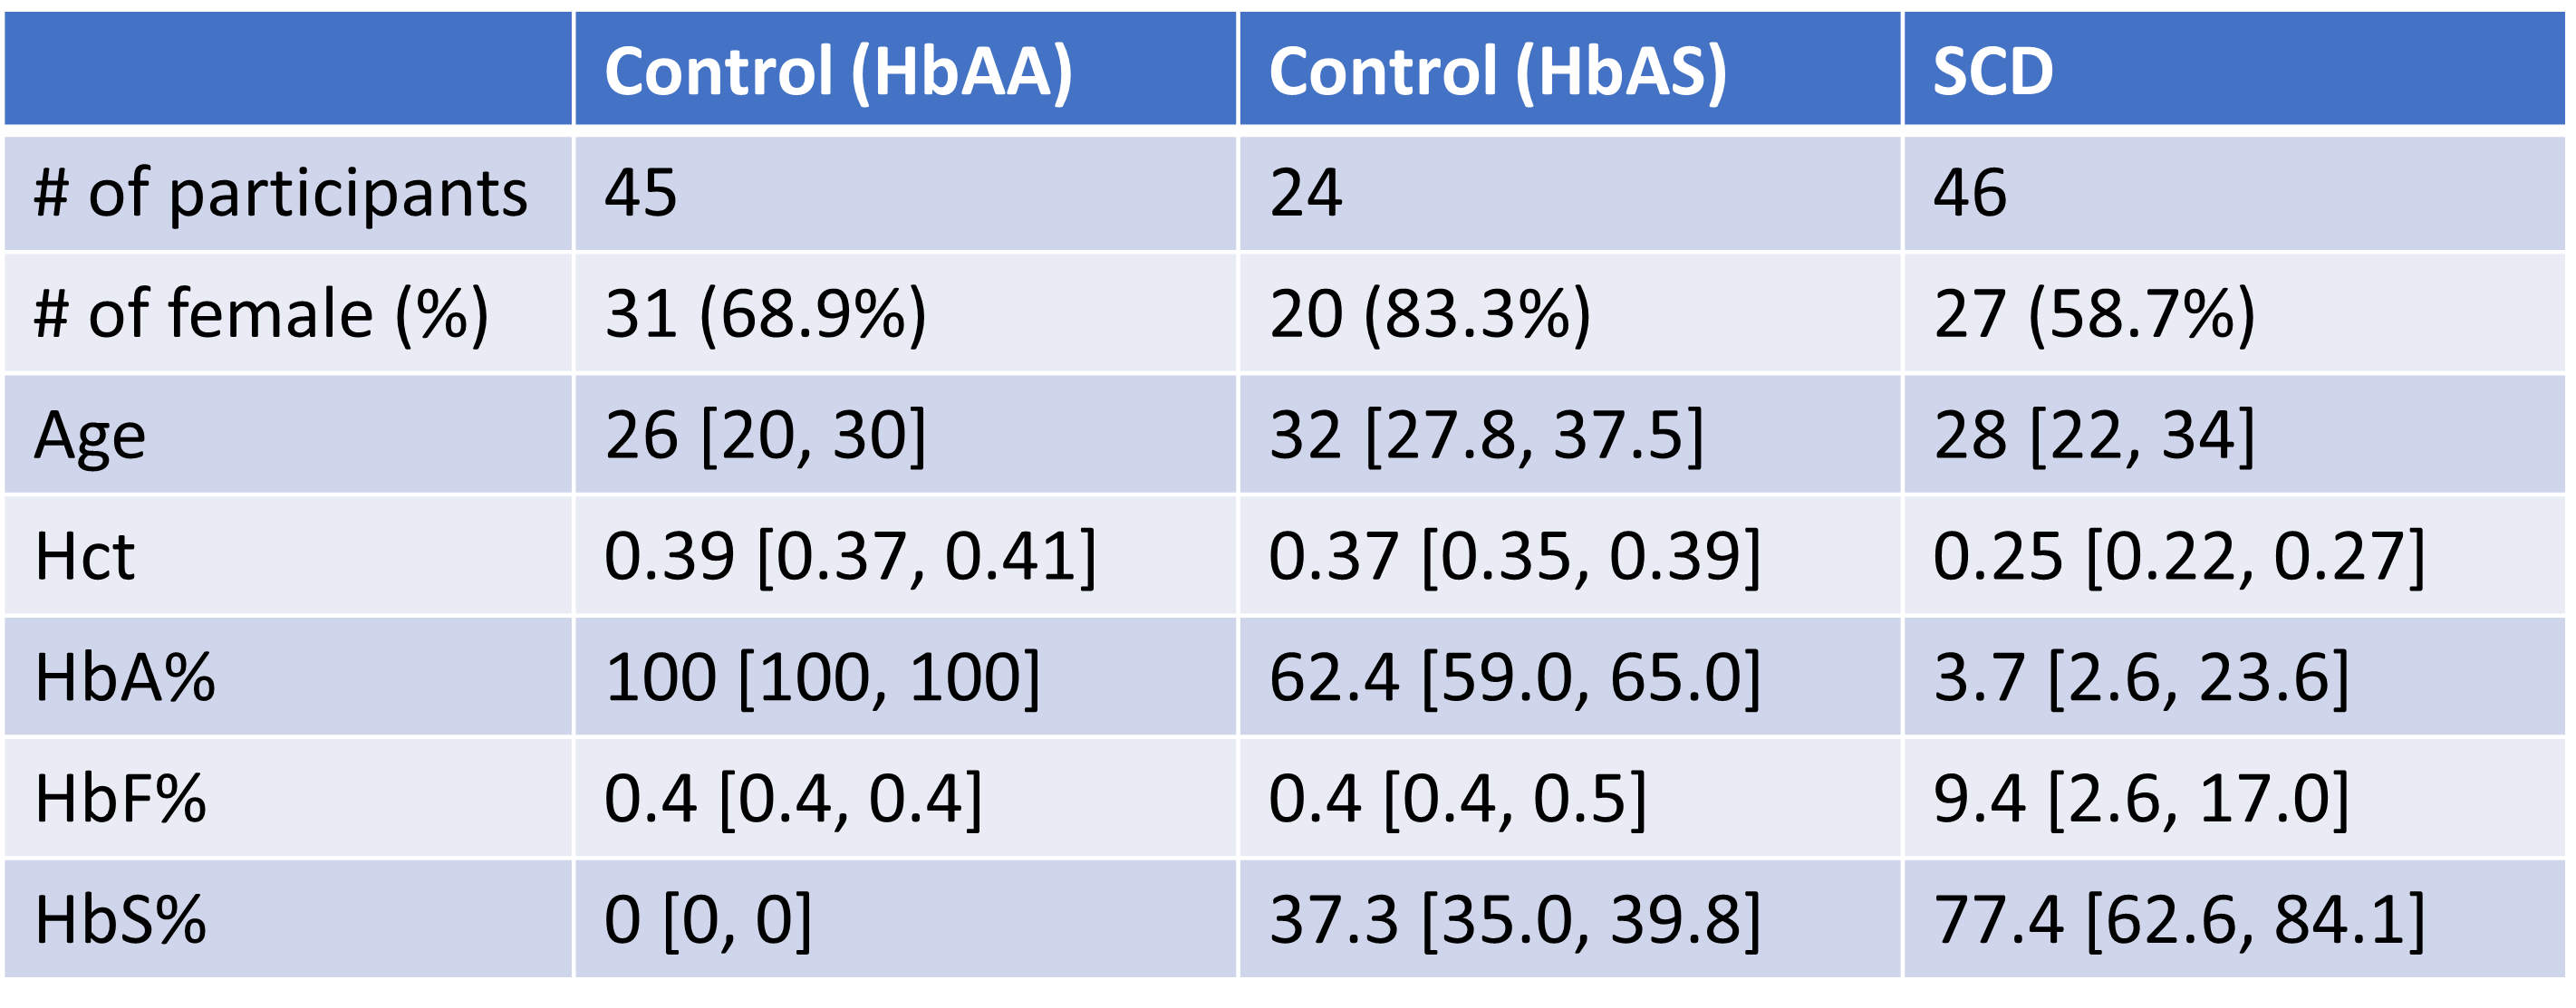
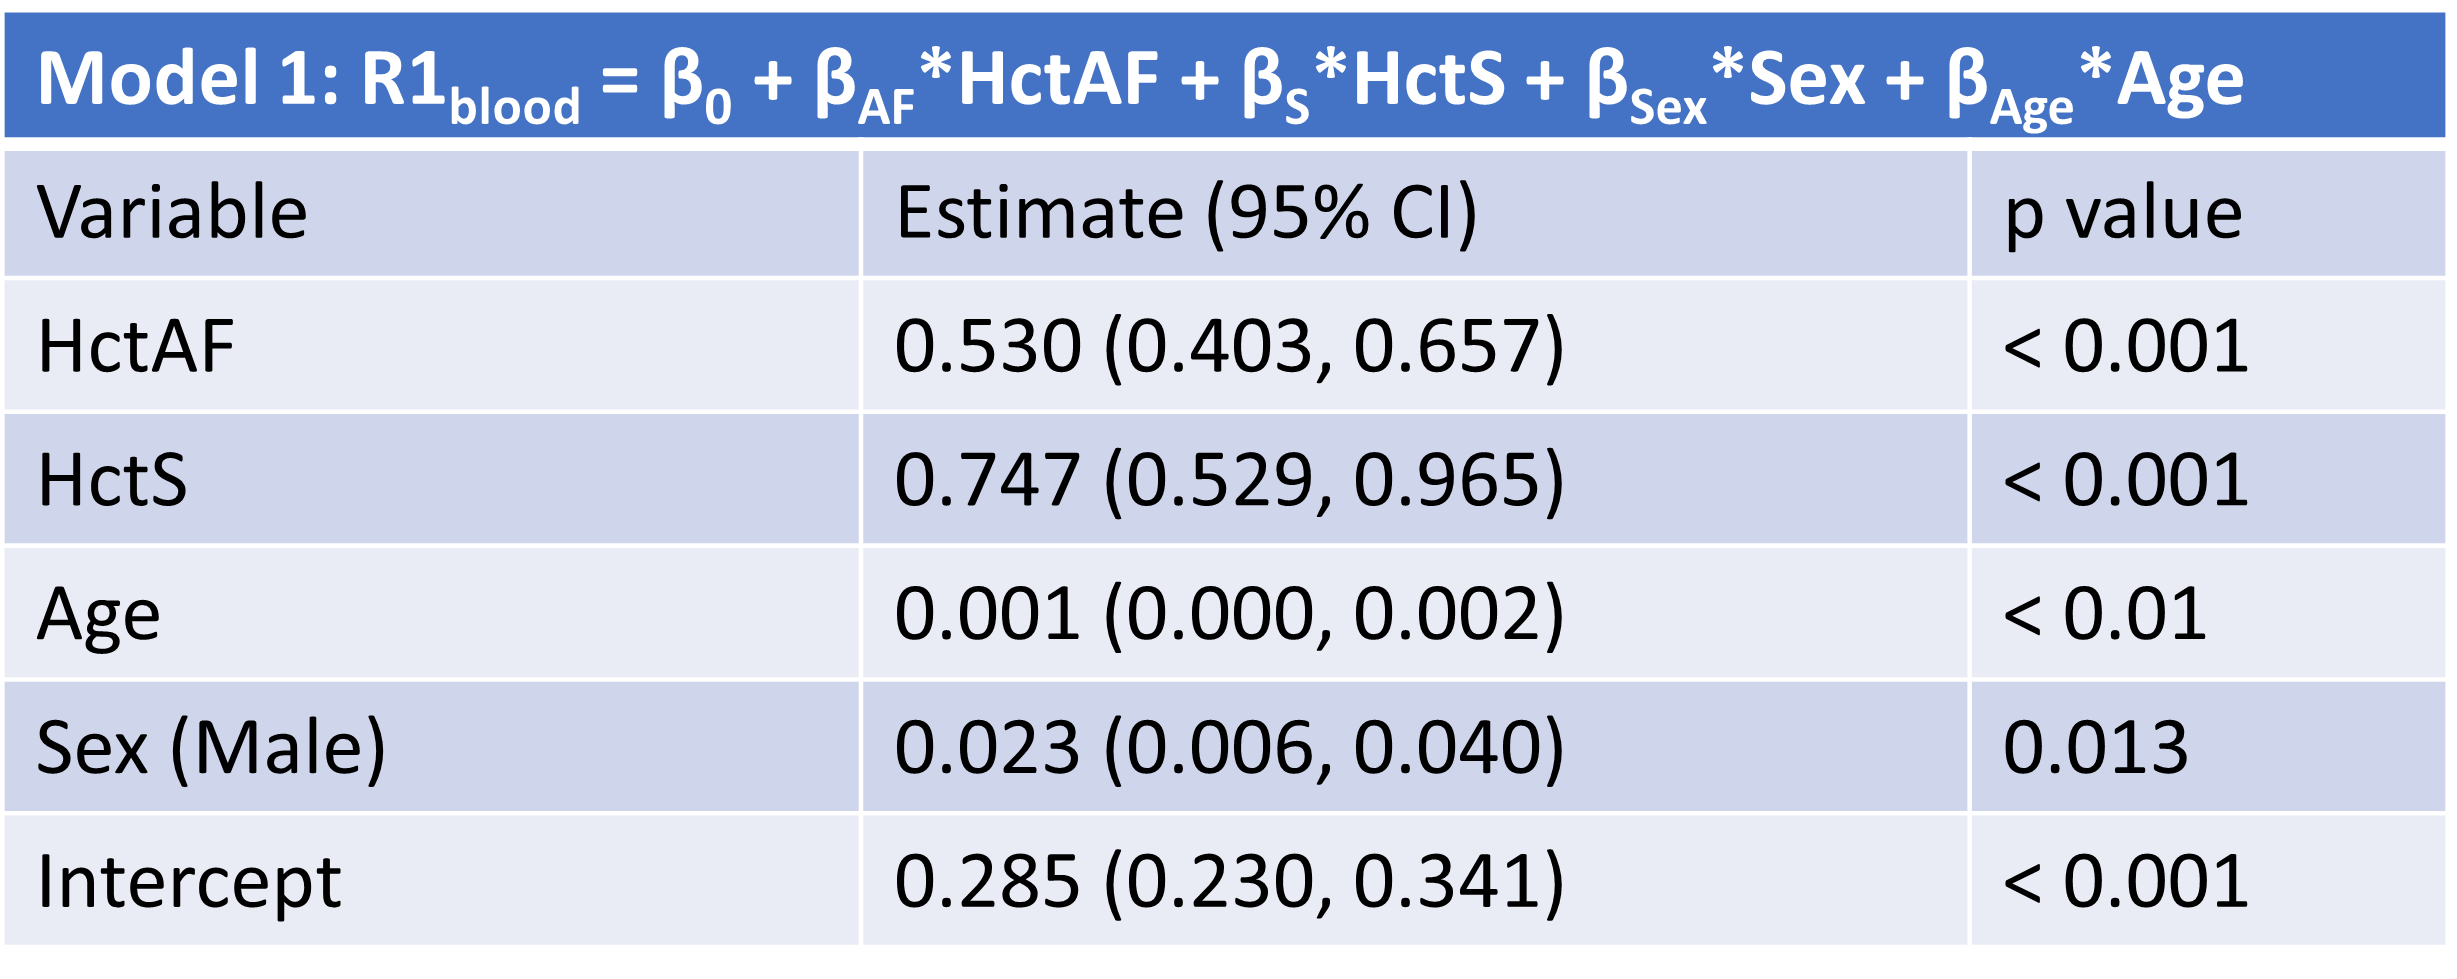
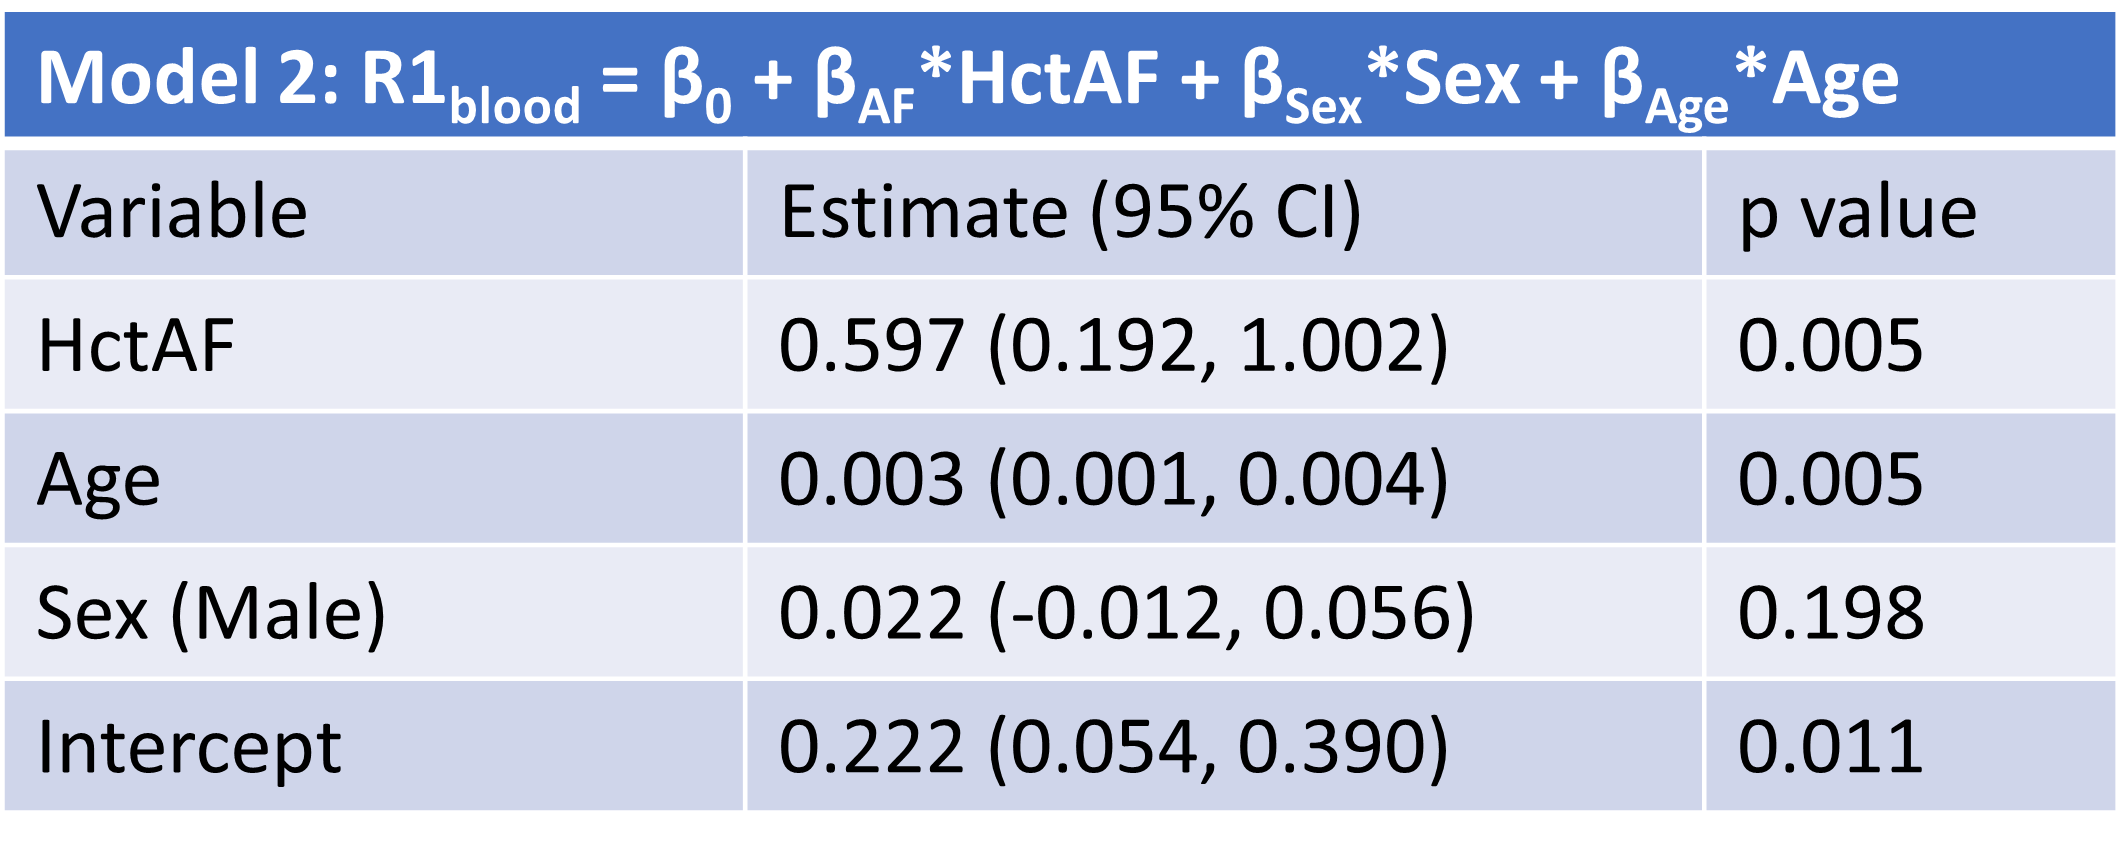
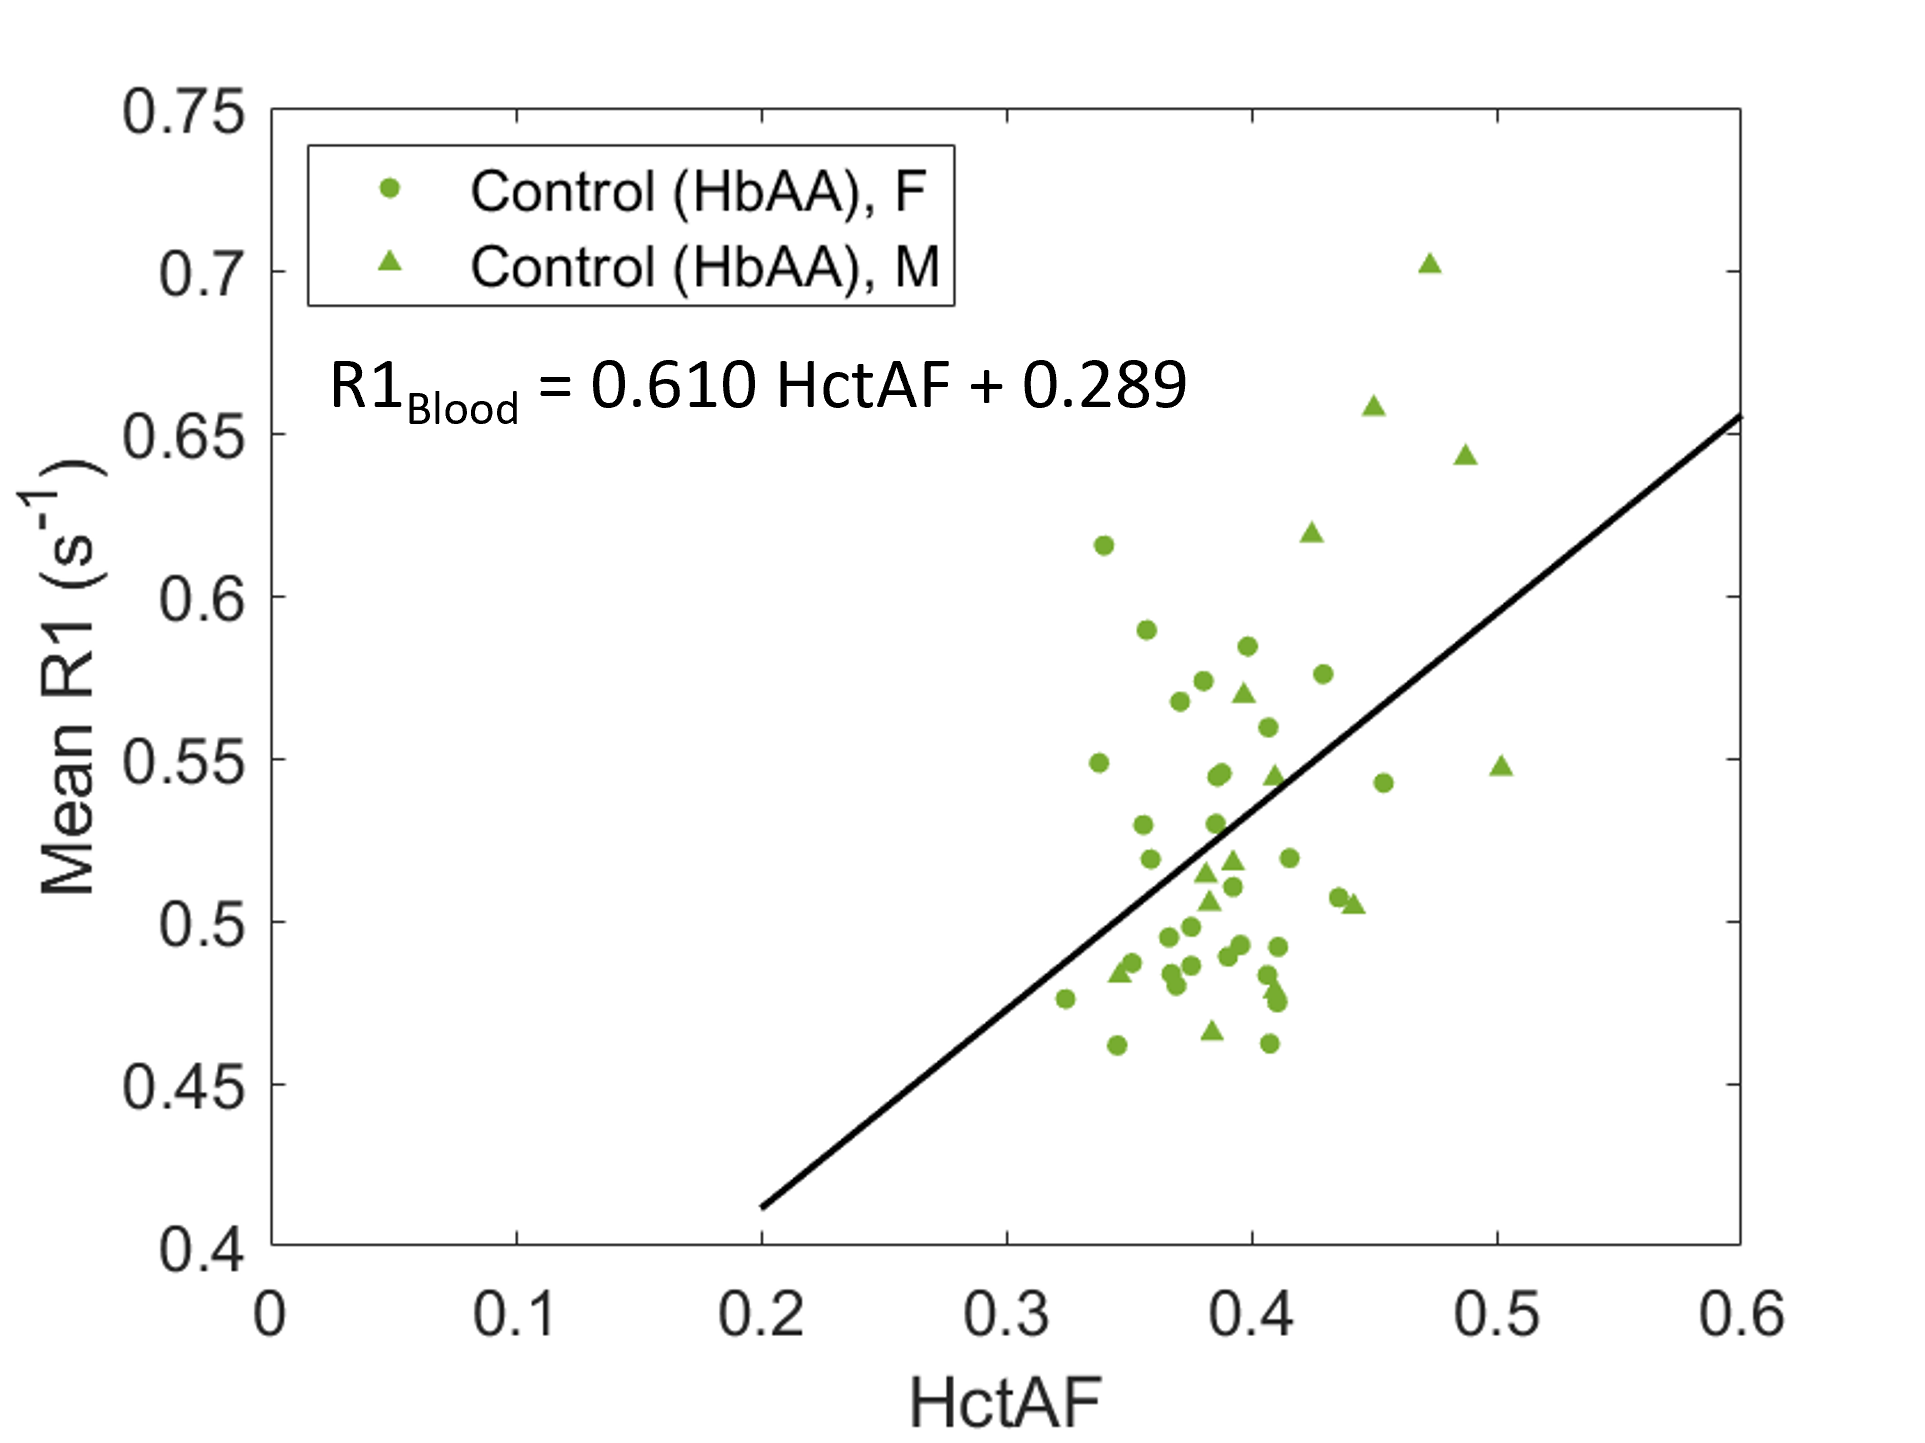
The demographic information and hematological characteristics of all participants are summarized in Table 1. The model coefficients of Model 1 using all participants are summarized in Table 2, with model R2=0.425. Figure 1 shows the association between HctAF (A) and HctS (B), and R1blood after controlling for other independent variables. The estimate for βS is significantly greater than that for βAF (estimate (95% CI): 0.747 (0.529, 0.965) vs 0.530 (0.403, 0.657), Z=3.695, p<0.001). The model coefficients of Model 2 using the HbAA controls are summarized in Table 3, with model R2=0.289 and estimated βAF (95% CI) 0.597 (0.192, 1.002)(p=0.005).Using Model 3, R1blood was significantly associated with HctAF in HbAA controls (Figure 2; R2=0.168, p=0.003). The estimate for βAF is 0.610 (0.219, 1.007)(p=0.003).
Discussion
We found that HctAF, HctS, age, and sex significantly affect R1blood (Table 1). βS is significantly greater than βAF, suggesting that HctAF and HctS have different impacts on R1blood. Notably, the estimate for βAF from Model 1 using all participants (0.530 (0.403, 0.657)) is similar to that from Model 2 using HbAA controls only (0.597 (0.192, 1.002)), demonstrating the robustness of βAF estimation.Lu et al. reported R1blood = 0.83*Hct + 0.28 using bovine venous blood(3). The Lu model coefficient fall within the 95% confidence interval of the estimate for βAF in our study using Model 3 (Figure 2), suggesting the association between Hct and R1blood is similar in healthy human and bovine blood.
Conclusion
We evaluated the impact of Hct of different Hb isoforms (HctAF=HctA+HctF and HctS) on R1blood in healthy controls and SCD patients. Both HctAF and HctS, along with age and sex, affect blood R1 significantly. Most importantly, HctAF and HctS have different impacts on blood R1. Our findings are crucial for developing an accurate R1 estimation model for various MRI applications in SCD patients.Acknowledgements
This study was supported by grants from the National Institues of Health (NIH): 2R01HL129241, R01NS121065, R01HL157188, and RF1 NS116565.
References
1. Wang DJ, Alger JR, Qiao JX, Hao Q, Hou S, Fiaz R, Gunther M, Pope WB, Saver JL, Salamon N, Liebeskind DS, Investigators US. The value of arterial spin-labeled perfusion imaging in acute ischemic stroke: comparison with dynamic susceptibility contrast-enhanced MRI. Stroke 2012;43(4):1018-1024.
2. Fayad ZA, Fuster V, Fallon JT, Jayasundera T, Worthley SG, Helft G, Aguinaldo JG, Badimon JJ, Sharma SK. Noninvasive in vivo human coronary artery lumen and wall imaging using black-blood magnetic resonance imaging. Circulation 2000;102(5):506-510.
3. Lu H, Clingman C, Golay X, van Zijl PC. Determining the longitudinal relaxation time (T1) of blood at 3.0 Tesla. Magn Reson Med 2004;52(3):679-682.
4. Wu WC, Jain V, Li C, Giannetta M, Hurt H, Wehrli FW, Wang DJ. In vivo venous blood T1 measurement using inversion recovery true-FISP in children and adults. Magn Reson Med 2010;64(4):1140-1147.
Figures