4370
Whole Brain Source Separation for Neurodegeneration1Electrical and Computer Engineering, Cornell University, New York, NY, United States, 2Radiology, Weill Cornell Medicine, New York, NY, United States, 3Neurology, Weill Cornell Medicine, New York, NY, United States, 4Biomedical Engineering, Cornell University, New York, NY, United States
Synopsis
Keywords: Other Neurodegeneration, Artifacts
Motivation: Cortex and spinal cord tissue are of interest in a variety of neurodegenerative diseases including Multiple Sclerosis (MS), Alzheimer’s Disease (AD), and Amyotrophic Lateral Sclerosis (ALS). These regions are low in signal to noise ratio (SNR) and generate artifacts on quantitative susceptibility maps (QSMs).
Goal(s): To demonstrate the maximum Spherical Mean Value (mSMV) algorithm as a tissue preserving initialization for susceptibility source separation.
Approach: Whole brain source separation enabled by mSMV is applied to patients with MS, AD, and ALS.
Results: The mSMV algorithm reconstructs the whole brain volume in source separations and generates susceptibility maps in agreement with existing methods.
Impact: Whole brain source separation using the maximum Spherical Mean Value (mSMV) algorithm successfully preserves full tissue volume and produces susceptibility map in strong agreement with existing methods.
Introduction
Neurodegenerative disorders such as Multiple sclerosis (MS), Alzheimer’s Disease (AD), and Amyotrophic Lateral Sclerosis (ALS) progressively degrade central and peripheral nervous system functions.1 In MS, the development of demyelinated lesions2 is observed in the brain and spine. For AD, increased susceptibility is witnessed in the frontal cortex.3 For ALS, the motor cortex demonstrates elevated susceptibility.4 Increased magnetic susceptibility on quantitative susceptibility maps (QSM) is caused by iron increase or myelin decrease that are most evident on separated paramagnetic and diamagnetic sources. Quantification of iron and myelin sources from complex multi-echo gradient echo (mGRE) data was demonstrated5-7 by combining magnitude decay modeling and phase to monitor MS disease progression.8,9 Many QSM reconstruction techniques introduce erosion of the brain mask to reduce shadow and streaking artifacts at voxels with low signal-to-noise ratio (SNR). Here, it is demonstrated that retaining the whole brain volume is particularly relevant for source separation in MS as well as other neurodegenerative pathologies like AD and ALS.Theory
The bulk susceptibility is decomposed into positive and negative sources by minimizing the cost function6 initialized with $$$\chi_0^+$$$ and $$$\chi_0^-$$$ by solving $$\chi_0^{+*},\chi_0^{-*} = \mathrm{argmin}_{\chi_0^+,\chi_0^-} ||A\mathbf{\chi_0}-b||_2^2 \ \ \mathrm{s.t.} \ \ \chi^l_0 \leq \chi_0 \leq \chi_0^u$$Initial susceptibilities and are obtained from a linear least squares solver minimizing the difference between bulk susceptibility and the dephasing effect of susceptibility. Then, the cost function is solved iteratively using conjugate gradient descent with Gauss-Newton iteratione. Popular reconstruction pipelines10-13 introduce erosion14,15 to that removes portions of the occipital lobe, spinal cord, and pathology. Improvement in visualization of the cortex, lobes and pathology with whole brain source separation is demonstrated. Here, the source separation is initialized by $$\chi_{mSMV}(r)=d(r) * b_{mSMV}(r)$$ Where $$$d(r)$$$ is the filtered dipole kernel and $$$b_{mSMV}(r)$$$ is the tissue field estimated from the mSMV algorithm.
Methods
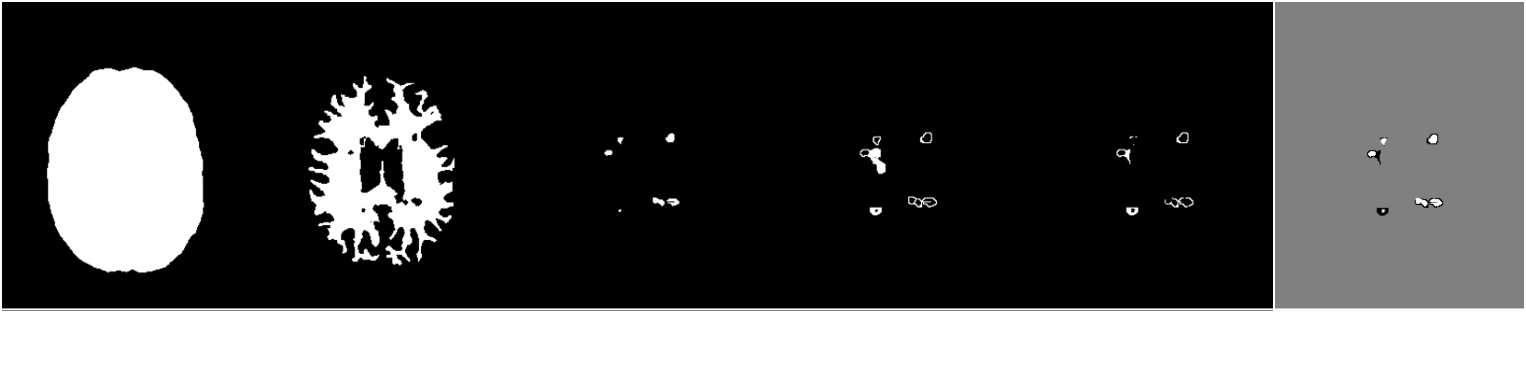
Multi-echo gradient echo (mGRE) and $$$$T_1$$$-weighted ($$$T_1w$$$) acquisitions were collected for thirty-nine MS patients. The mGRE sequence had echo spacing $$$\Delta TE=4.1ms$$$ with initial echo time $$$TE_1=6.3ms$$$, acquisition matrix $$$260\times320\times56$$$, in-plane resolution of $$$0.75mm^3$$$ and slice thickness $$$3mm$$$. Complex mGRE data was fit16 and unwrapped using ROMEO.17 Bulk susceptibility was reconstructed using MEDI-L118-20 (regularization parameters $$$\lambda_1=1000, \lambda_2=100$$$ with mSMV21 and SMV ($$$5mm$$$ kernel) tissue field filtering. Positive and negative sources were reconstructed and the contrast-to-noise ratio (CNR) was calculated at each lesion with the intersection between a dilated (using a cubic structuring element of the maximum voxel size) lesion label and normal-appearing white matter masks, $$$M_{CNR}$$$(Figure 1). An mGRE sequence for 5 patients with Alzheimer’s Disease (AD) on a $$$3T$$$ MRI scanner with voxel size $$$0.75\times0.75\times3mm^3$$$ and first echo time, $$$TE_1=6.3ms$$$, a repetition time $$$TR=48ms$$$, flip angle of 15°, and a readout bandwidth of $$$260Hz/pixel$$$. Susceptibility sources were reconstructed with the same parameters as the MS patients. The difference between positive and negative sources was calculated for each method. An mGRE sequence4 with $$$TE=\Delta TE=TE_1=5ms$$$, 11 echoes, $$$TR=59ms$$$, flip angle 20°, and voxel size of $$$0.75\times0.75\times2mm^3$$$ was acquired for 35 ALS patients and susceptibility sources were reconstructed with the aforementioned parameters.Results
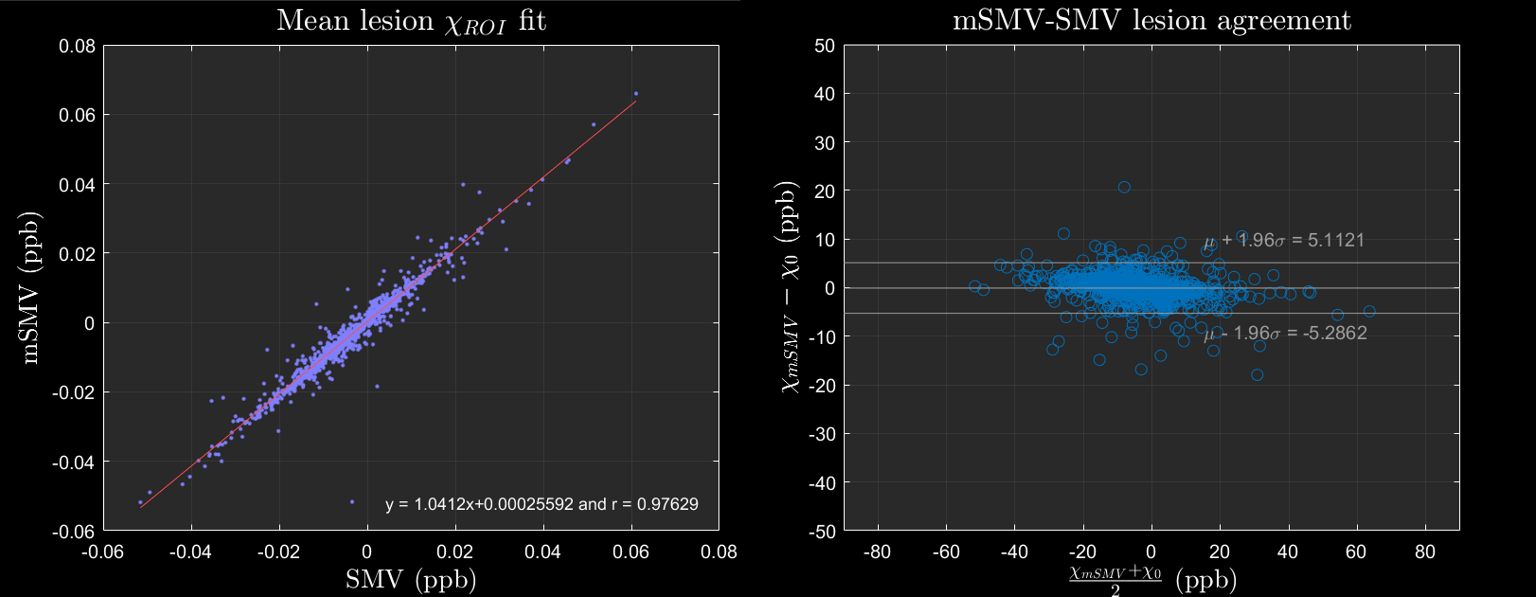
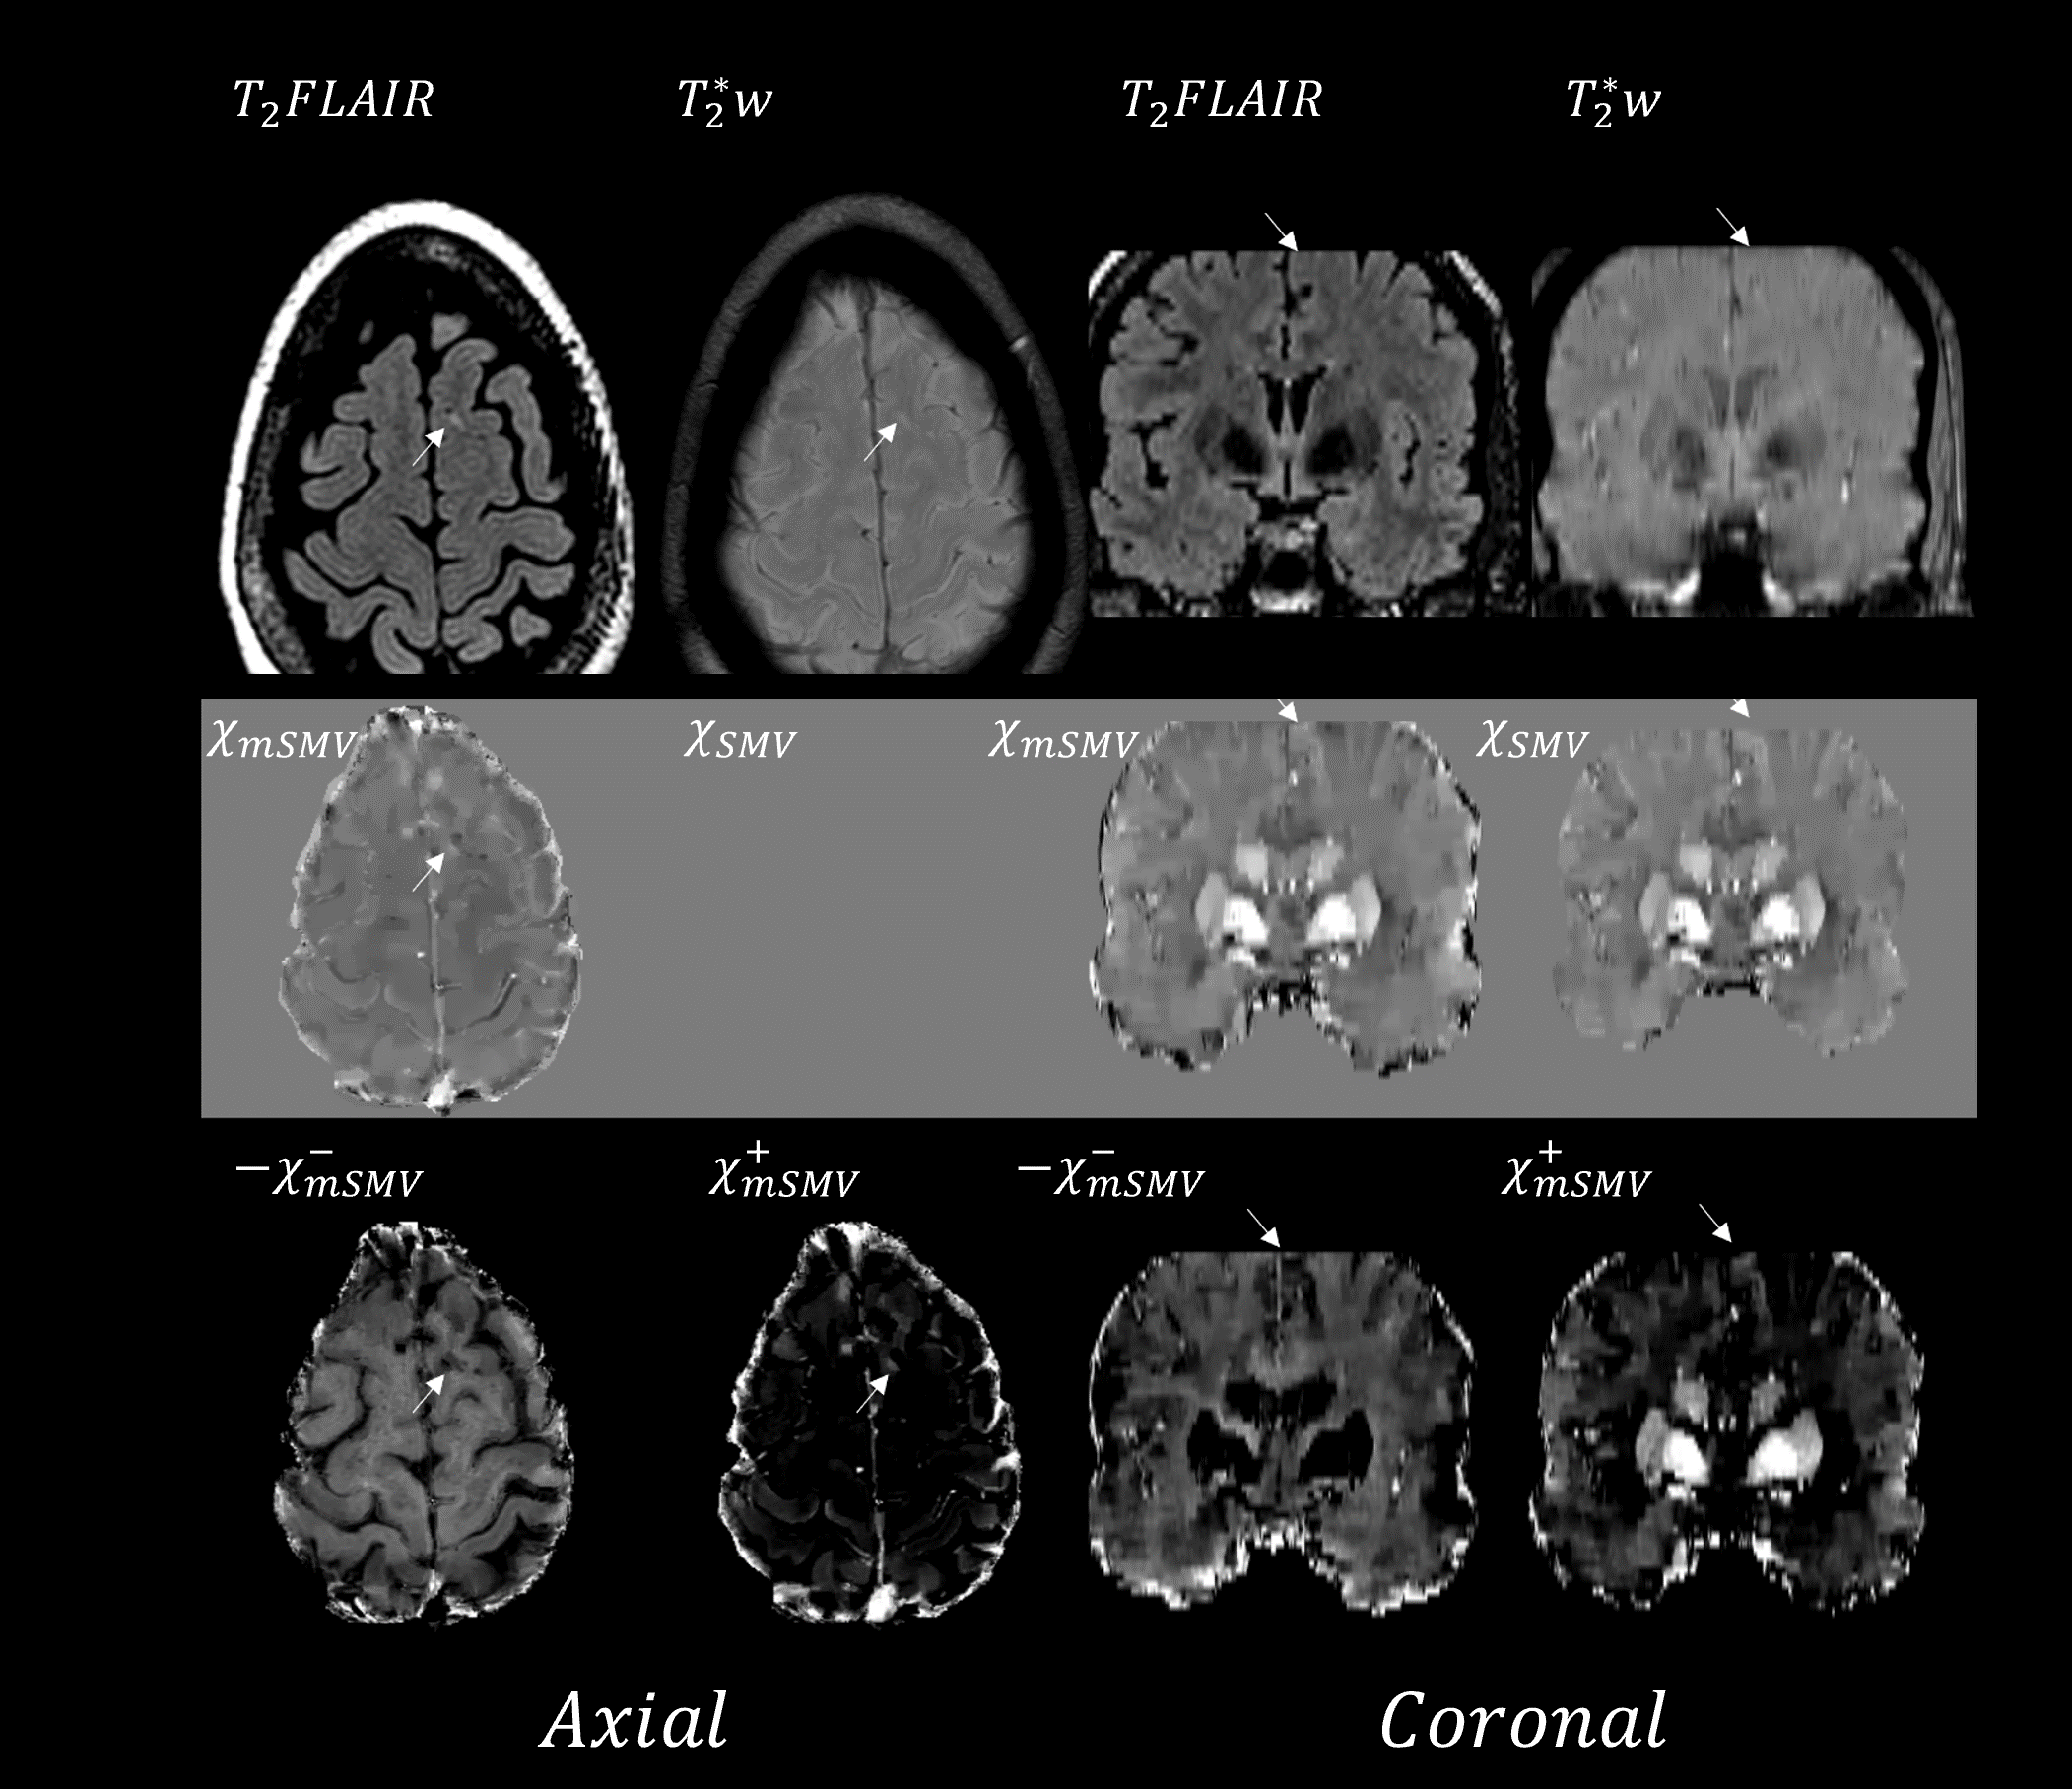
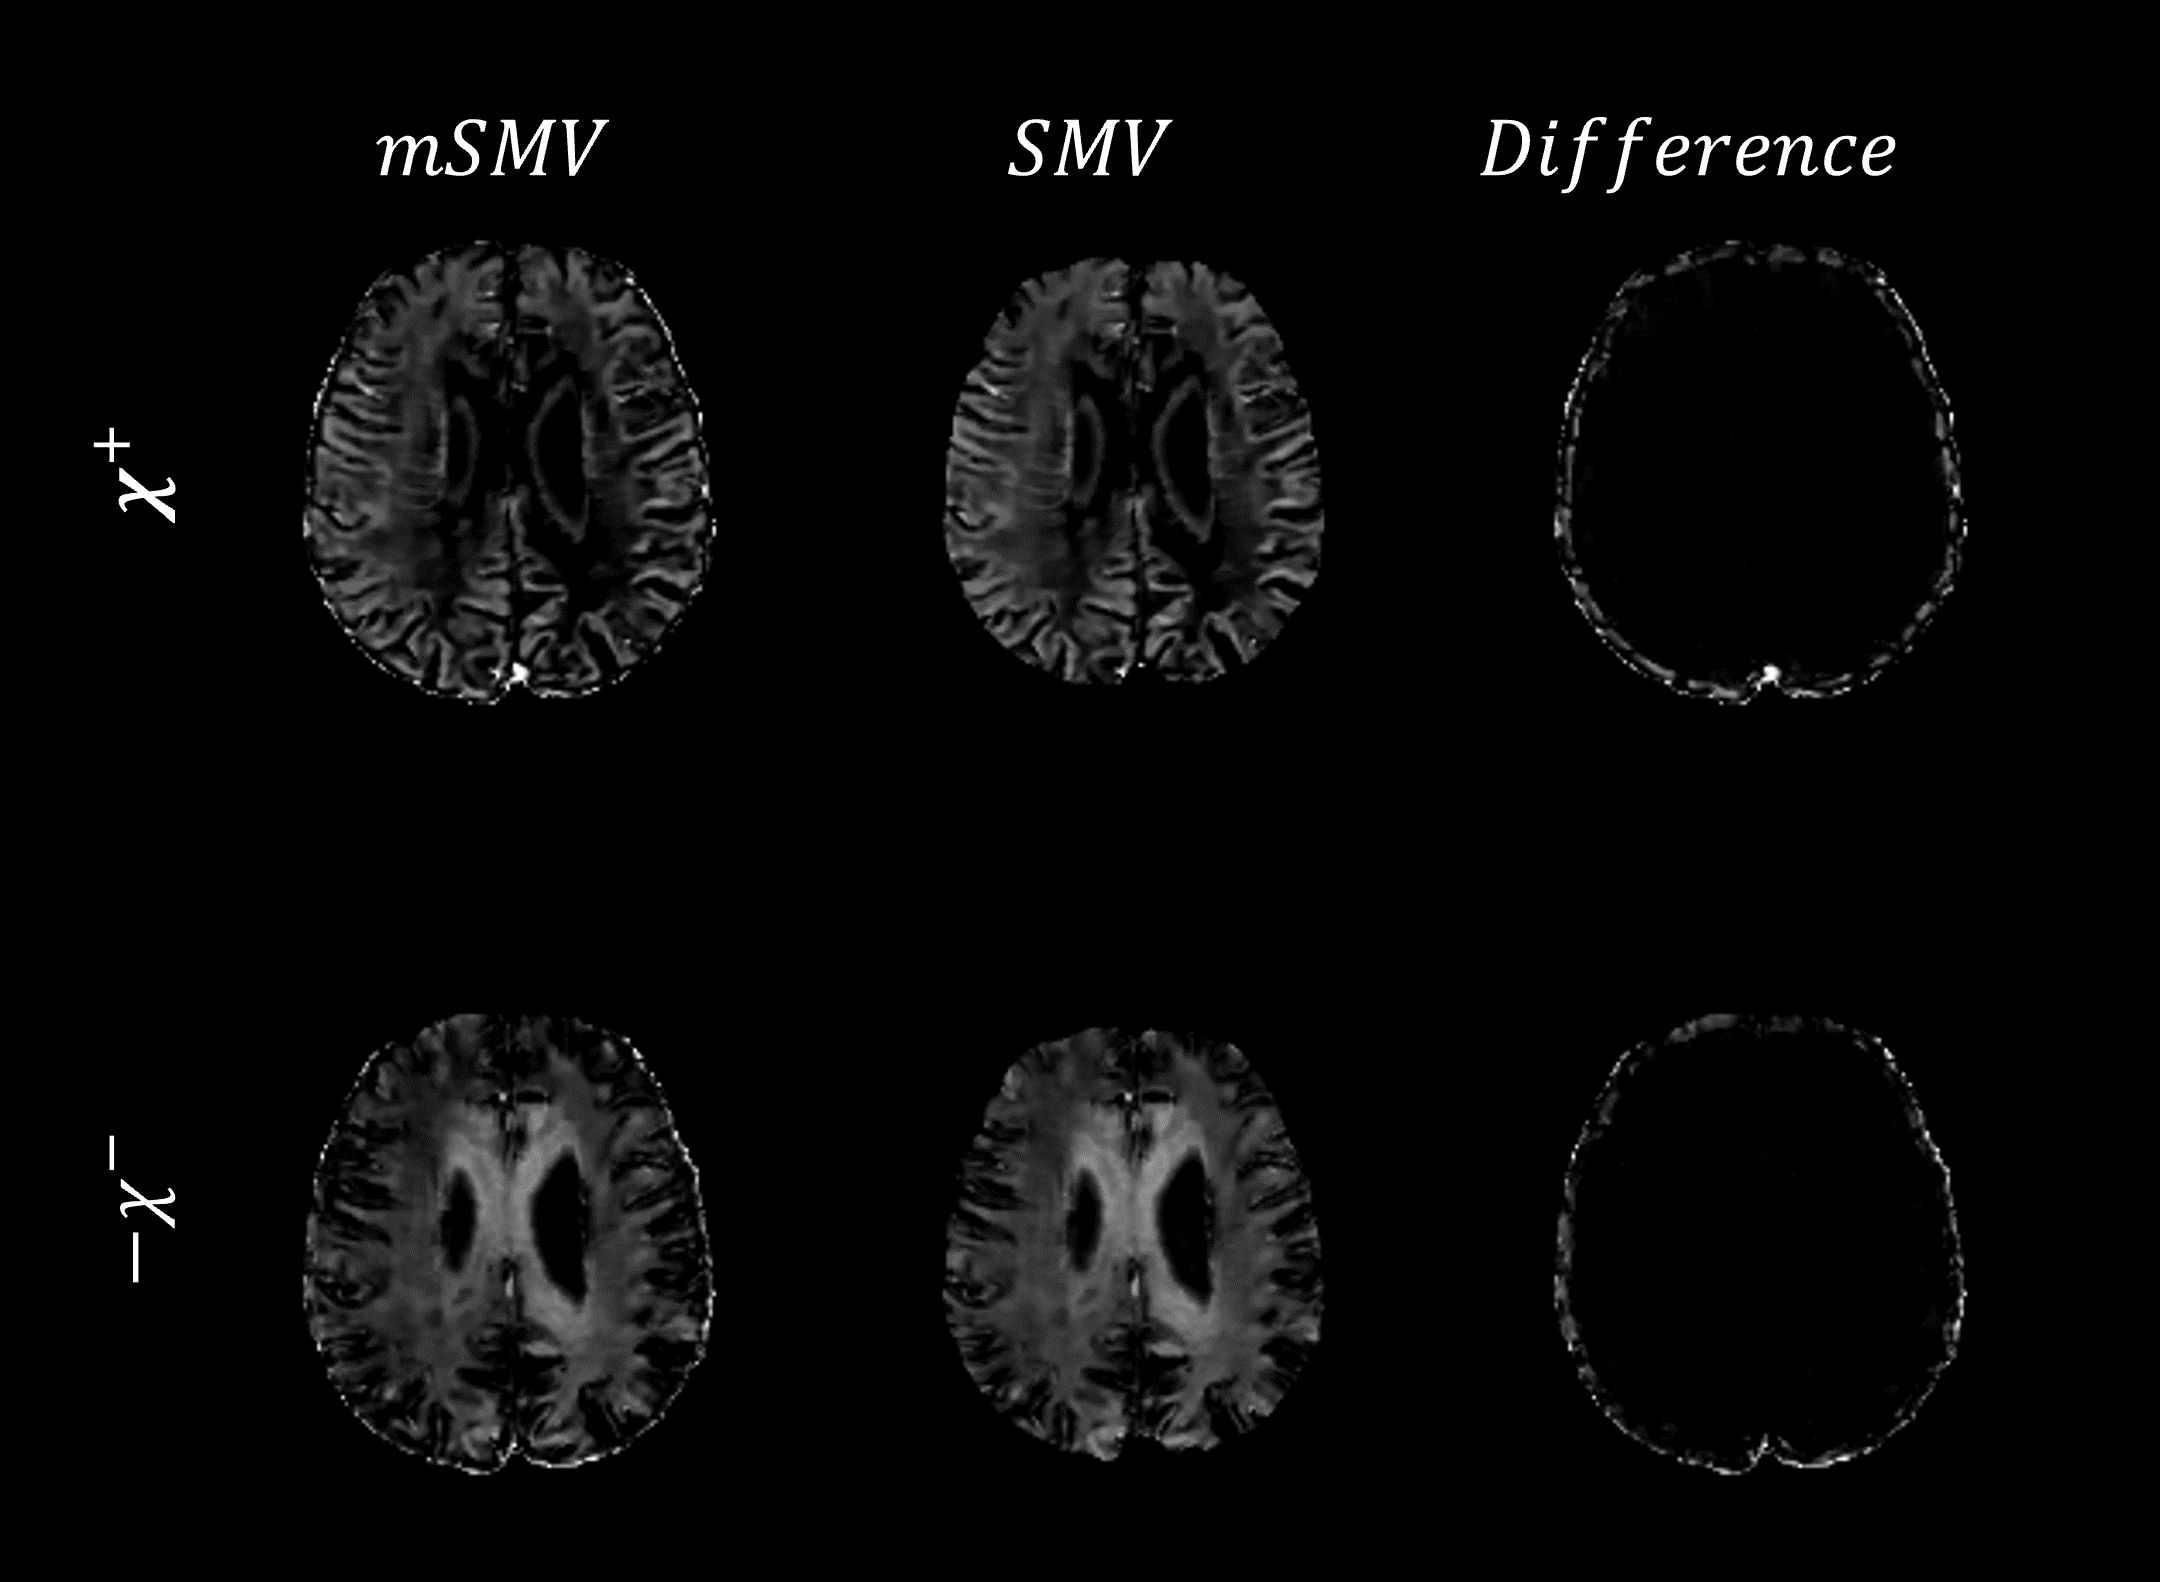
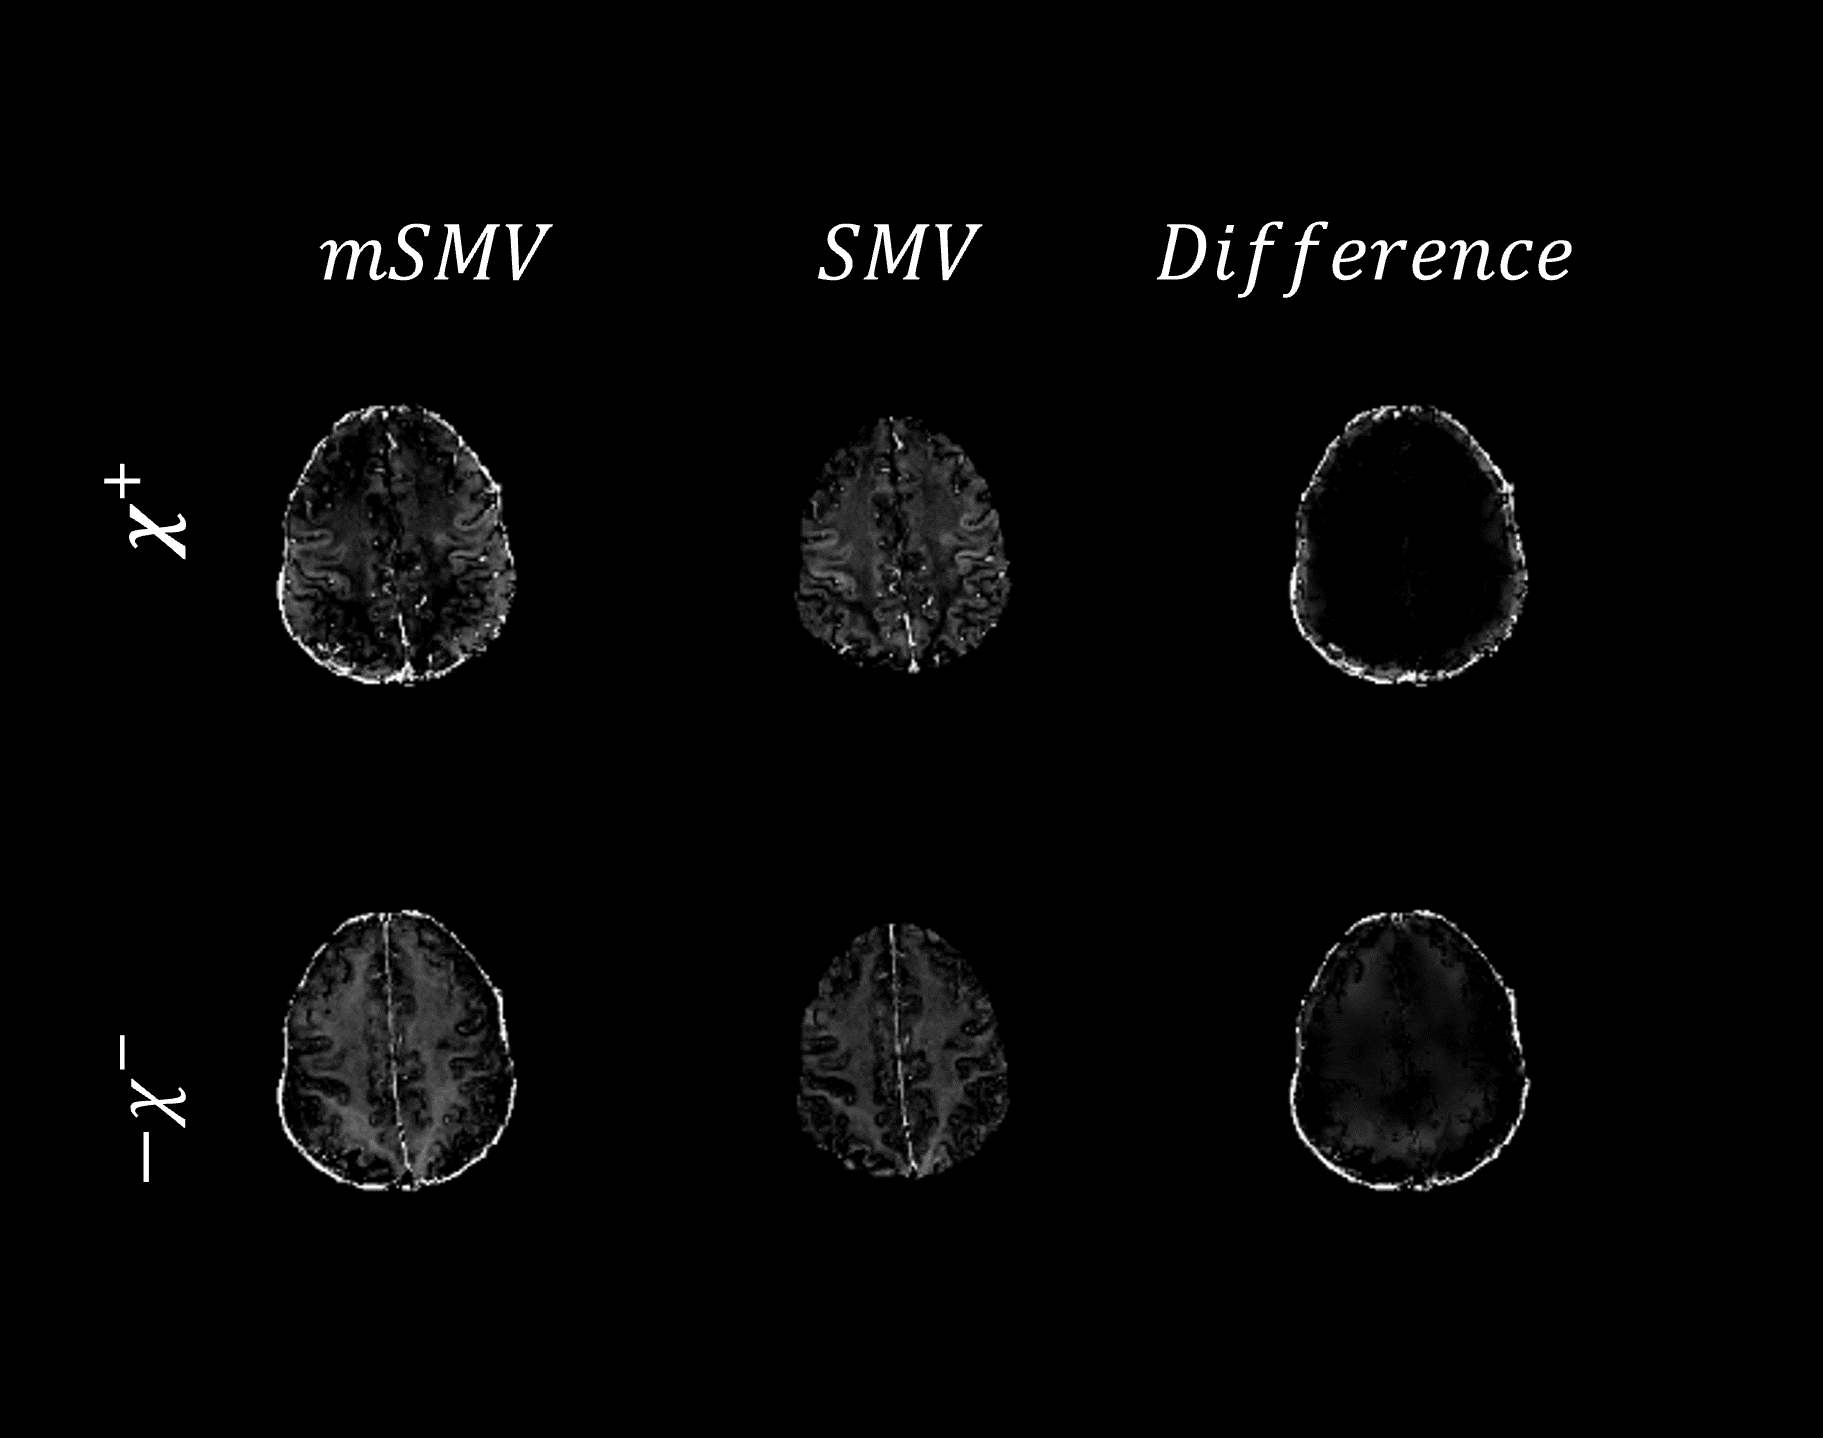
Strong correlation $$$R=0.98, m=1.04, b\approx0$$$ and agreement $$$[-5.2ppb,5.11ppb]$$$ was found between the mean lesion bulk susceptibilities (Figure 2). Lesions on MS patients eroded on SMV initialized source separations were visible on mSMV initialized source separations (Figure 3). The median CNR for mSMV initialized source separations was significantly higher $$$(p<0.01)$$$than for SMV initialized source separations for both negative ($$$1.34$$$ and $$$1.28$$$, respectively) and positive ($$$0.59$$$ and $$$0.58$$$, respectively) sources. The median gradient at each lesion for whole brain was significantly ($$$p<0.01$$$) higher than for negative ($$$0.0043$$$ and $$$0.0041$$$, respectively) and positive ($$$0.0036$$$ and $$$0.0035$$$, respectively) sources. In AD patients, the mean susceptibility difference between positive and negative sources for both reconstructions was higher for mSMV reconstructions ($$$0.07$$$) than for eroded reconstructions ($$$0.04$$$), $$$p<0.01$$$ with a representative case shown in Figure 4 and a representative ALS case is show in Figure 5.Conclusion
Whole brain source separation captures previously eroded pathology and improves lesion CNR. Lesion gradients show larger magnitude in whole brain bulk susceptibility, contributing to increased denoising at these voxels from regularization. This results in full brain volume reconstruction and improved lesion visualization. Increased susceptibility source differences were observed in whole brain reconstruction of AD patients, suggesting improved contrast from retaining the full cortex, also relevant for ALS patients.Acknowledgements
No acknowledgement found.References
1. Garofalo M, Pandini C, Bordoni M, et al. Alzheimer’s, Parkinson’s Disease and Amyotrophic Lateral Sclerosis Gene Expression Patterns Divergence Reveals Different Grade of RNA Metabolism Involvement. International Journal of Molecular Sciences. 2020;21(24):9500. doi:10.3390/ijms21249500 2. Neuromuscular disorders. Cedars Sinai. Accessed June 19 2023, https://www.cedars-sinai.org/health-library/diseases-and-conditions/n/neuromuscular-disorders.html
3. Uchida Y, Kan H, Sakurai K, Oishi K, Matsukawa N. Quantitative susceptibility mapping as an imaging biomarker for Alzheimer's disease: The expectations and limitations. Front Neurosci. 2022;16:938092. doi:10.3389/fnins.2022.938092
4. Schweitzer AD, Liu T, Gupta A, et al. Quantitative Susceptibility Mapping of the Motor Cortex in Amyotrophic Lateral Sclerosis and Primary Lateral Sclerosis. American Journal of Roentgenology. 2015;204(5):1086-1092. doi:10.2214/ajr.14.13459
5. Chen J, Gong N-J, Chaim KT, Otaduy MCG, Liu C. Decompose quantitative susceptibility mapping (QSM) to sub-voxel diamagnetic and paramagnetic components based on gradient-echo MRI data. NeuroImage. 2021;242:118477. doi:10.1016/j.neuroimage.2021.118477
6. Dimov AV, Nguyen TD, Gillen KM, et al. Susceptibility source separation from gradient echo data using magnitude decay modeling. Journal of Neuroimaging. 2022;32(5):852-859. doi:10.1111/jon.13014 7. Shin HG, Lee J, Yun YH, et al. χ-separation: Magnetic susceptibility source separation toward iron and myelin mapping in the brain. Neuroimage. Oct 15 2021;240:118371. doi:10.1016/j.neuroimage.2021.118371
8. Wang Y, Spincemaille P, Liu Z, et al. Clinical quantitative susceptibility mapping (QSM): Biometal imaging and its emerging roles in patient care. Journal of Magnetic Resonance Imaging. 2017;46(4):951-971. doi:10.1002/jmri.25693
9. Wisnieff C, Ramanan S, Olesik J, Gauthier S, Wang Y, Pitt D. Quantitative susceptibility mapping (QSM) of white matter multiple sclerosis lesions: Interpreting positive susceptibility and the presence of iron. Magnetic Resonance in Medicine. 2015;74(2):564-570. doi:10.1002/mrm.25420
10. Acosta-Cabronero J, Milovic C, Mattern H, Tejos C, Speck O, Callaghan MF. A robust multi-scale approach to quantitative susceptibility mapping. Neuroimage. Dec 2018;183:7-24. doi:10.1016/j.neuroimage.2018.07.065
11. Chan K-S, Marques JP. SEPIA—Susceptibility mapping pipeline tool for phase images. NeuroImage. 2021;227:117611. doi:10.1016/j.neuroimage.2020.117611
12. Milovic C, Bilgic B, Zhao B, Acosta-Cabronero J, Tejos C. Fast nonlinear susceptibility inversion with variational regularization. Magnetic Resonance in Medicine. 2018;80(2):814-821. doi:10.1002/mrm.27073
13. Wei H, Dibb R, Zhou Y, et al. Streaking artifact reduction for quantitative susceptibility mapping of sources with large dynamic range. NMR in Biomedicine. 2015;28(10):1294-1303. doi:10.1002/nbm.3383 14. Roberts A, Spincemaille P, Nguyen T, Wang Y. MEDI-d: Downsampled Morphological Priors for Shadow Reduction in Quantitative Susceptibility Mapping. presented at: International Society for Magnetic Resonance in Medicine; 2021; Vancouver, Canada. https://cds.ismrm.org/protected/21MPresentations/abstracts/2599.html
15. Roberts A, Spincemaille P, Nguyen T, Wang Y. MEDI-FM: Field Map Error Guided Regularization for Shadow Reduction in Quantitative Susceptibility Mapping. presented at: International Society for Magnetic Resonance in Medicine; 2022; London, England. https://archive.ismrm.org/2022/2359.html 16. Liu T, Wisnieff C, Lou M, Chen W, Spincemaille P, Wang Y. Nonlinear formulation of the magnetic field to source relationship for robust quantitative susceptibility mapping. Magnetic Resonance in Medicine. 2013;69(2):467-476. doi:10.1002/mrm.24272
17. Dymerska B, Eckstein K, Bachrata B, et al. Phase unwrapping with a rapid opensource minimum spanning tree algorithm (ROMEO). Magnetic Resonance in Medicine. 2021;85(4):2294-2308. doi:10.1002/mrm.28563
18. De Rochefort L, Liu T, Kressler B, et al. Quantitative susceptibility map reconstruction from MR phase data using bayesian regularization: Validation and application to brain imaging. Magnetic Resonance in Medicine. 2010;63(1):194-206. doi:10.1002/mrm.22187
19. Dimov AV, Nguyen TD, Spincemaille P, et al. Global cerebrospinal fluid as a zero‐reference regularization for brain quantitative susceptibility mapping. Journal of Neuroimaging. 2022;32(1):141-147. doi:10.1111/jon.12923
20. Liu Z, Spincemaille P, Yao Y, Zhang Y, Wang Y. MEDI+0: Morphology enabled dipole inversion with automatic uniform cerebrospinal fluid zero reference for quantitative susceptibility mapping. Magnetic Resonance in Medicine. 2018;79(5):2795-2803. doi:10.1002/mrm.26946
21. Roberts AG, Romano DJ, Sisman M, et al. Maximum Spherical Mean Value (mSMV) Filtering for Whole Brain Quantitative Susceptibility Mapping. arXiv pre-print server. 2023-04-22 2023;doi:None arxiv:2304.11476
Figures