4367
Subcortical Shape Abnormalities in Maintenance Hemodialysis Patients with Sleep Disorder1Radiology, Affiliated Zhongshan Hospital of Dalian University, Dalian, China, 2Radiology, the First Affiliated Hospital of Dalian Medical University, Dalian, China
Synopsis
Keywords: Other Neurodegeneration, Neurodegeneration
Motivation: Hemodialysis (HD) patients can cause alterations in brain structure, and often experience cognitive and sleep disorders (SD). However, the mechanism of SD in HD patients is not fully understood.
Goal(s): We aimed to assess the changes in subcortical structures of HD patients with SD and to explore the associations with cognitive.
Approach: Volumetric and vertex-wise shape analysis approaches were used to investigate the 14 subcortical structural abnormalities.
Results: Hemodialysis patients with sleep disorder exhibited significant surface reduction on the right hippocampus.
Impact: Atrophy of subcortical structures was observed in the hemodialysis patients. Right hippocampus atrophy is closely associated with sleep disorder, emphasizing the role of hippocampus as viable predictor.
Introduction
End-stage renal disease (ESRD) is the end stage of chronic kidney disease, characterized by multi-organ failure and typically defined by a glomerular filtration rate of less than 15 mL/min/1.73m2 or requiring permanent renal replacement therapy[1]. Maintenance hemodialysis (HD) is one of the main and most common treatments for ESRD patients. Although hemodialysis prolongs overall survival of patients with ESRD, it fails to address complications such as sleep disorder (SD) experienced by ESRD patients[2]. Studies indicate a significantly elevated incidence of SD in ESRD patients, particularly those on dialysis, reaching up to 80%[3][4][5]. SD has emerged as a critical concern for patients undergoing renal replacement therapy, yet the exact mechanism of SD in HD patients remains unclear. According to the kidney-brain axis and cross-talk theory, abnormalities in subcortical structures may accelerate sleep and cognition impairment in patients with ESRD[6]. While voxel-based morphometry can analyze subcortical volume changes, it may not fully reveal subtle structural alterations and can be affected by multiple comparison corrections. Shape Analysis is an automated segmentation method that provides a precise pattern of shape changes in subcortical structures, enabling the localization of regional atrophy and the detection of subtle structural changes with greater anatomical accuracy and sensitivity[7]. In this study, we explored subcortical brain structures using shape analysis procedure to further elucidate the role of subcortical structures in HD patients with SD.Methods
In this study, 40 HD patients and 22 healthy controls (HCs) who underwent magnetic resonance imaging and comprehensive neuropsychological studies were recruited retrospectively at Affiliated Zhongshan Hospital of Dalian University. We used the pittsburgh sleep quality index (PSQI) to determine the diagnosis of SD in HD patients. All scans were acquired with a Siemens 3.0 T scanner. On whole-brain, T1-weighted MRI data set with a 3-dimensional MPRAGE sequence was acquired. Segmentation of all subcortical structures and volume calculations were performed using FreeSurfer Version 7.2.0. The estimated total intracranial volume (eTIV) volumes were also extracted. FMRIB’s Integrated Registration and Segmentation Tool (FIRST) was applied for the vertex analysis. Group differences in subcortical structural volume were compared using analysis of covariance (ANCOVA) controlling for age, gender, years of education and eTIV. Vertex-wise general linear model was used for shape analysis. Results were corrected for multiple comparisons using threshold-free cluster enhancement to maintain a P < 0.05 family-wise error rate.Results
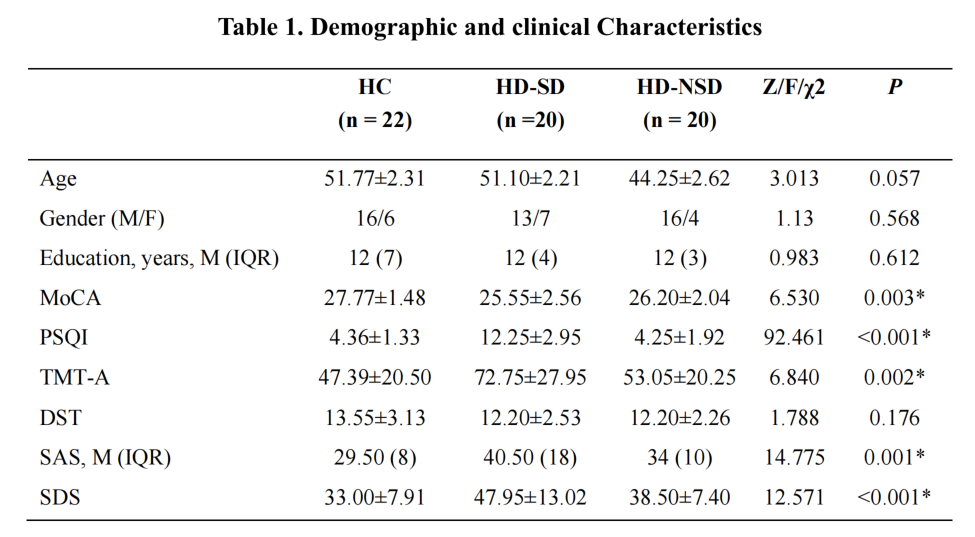
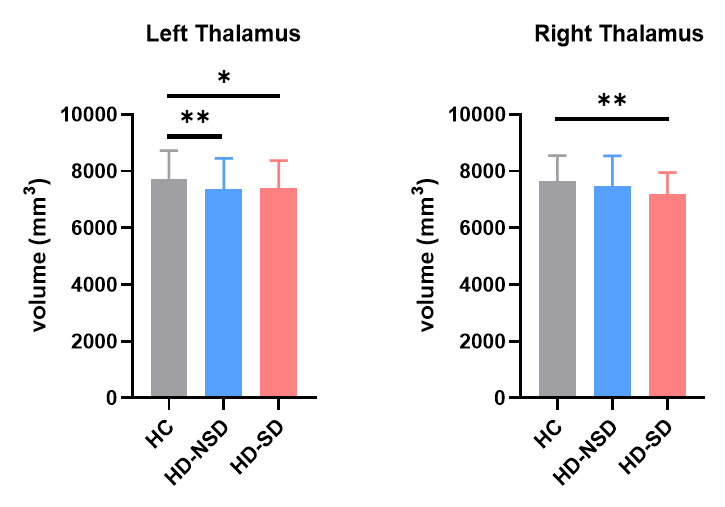
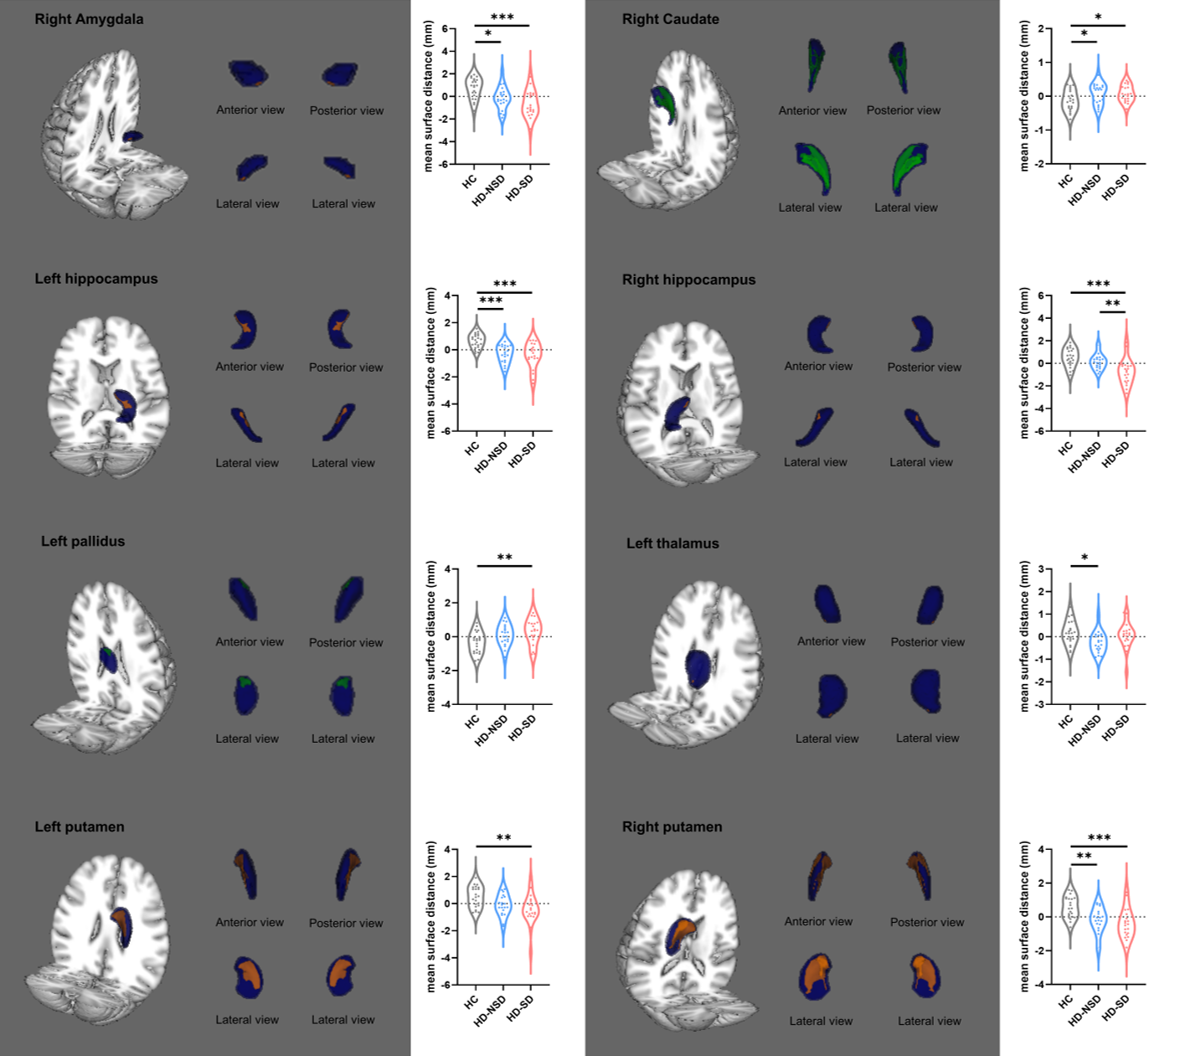
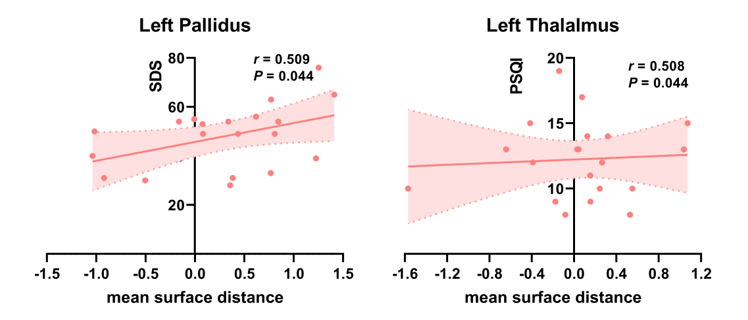
Table 1 showed the demographic information and neuropsychological assessments of the three groups. No significant differences in age, gender, or educational levels were observed (P > 0.05). Patients with HD had significantly lower MoCA scores and higher trail making tests A (TMT-A), Zung’s self-rating anxiety scale (SAS) and Zung’s self-rating depression scale (SDS) scores (P < 0.05). First, we investigated the diagnostic differences in the subcortical volumes and found significant volume differences in bilateral thalamus (Figure 1). Next, we examined the differences in subcortical shape and the results are shown in Figure 2. Subcortical surface alterations were observed in right amygdala, right caudate, bilateral hippocampus, left pallidus, left thalamus and bilateral putamen. Post-hoc analysis showed significant right hippocampus surface reduction in the HD-SD group compared to the HD-NSD group (P < 0.01). In the HD-SD group, a positive correlation was found between left pallidus shape deformation and SDS score (r = 0.509, P = 0.044), and left thalamus shape alteration correlated positively with PSQI score (r = 0.508, P = 0.044). (Figure 3).Discussion
In our subcortical volume analysis, we only observed bilateral thalamus atrophy. However, in the vertex-wise shape analysis, we detected shape deformations in various subcortical structures. Consistent with previous studies[8][9], our results also showed that shape analysis can reveal surface deformations of subcortical structures that cannot be detected by traditional volumetric analysis. subcortical structure changes in HD patients also yielded disparate results between the two methods [10]. While shape and volume analyses slightly differ, they complement each other, providing cross-validation. In other words, combining both methods allows for a comprehensive view of subcortical structure alterations in HD patients. Our results indicated that lower sleep quality was associated with atrophic changes in the right hippocampus in the HD patients. The hippocampus plays a role in the early stage of AD, whereas the thalamus is recognized for its involvement in the later stage of AD. This suggests that HD-SD patients may already exhibit cognitive impairment associated with early-stage AD-related brain changes.Conclusion
In summary, our data confirmed that atrophy of subcortical structures in the HD patients. Furthermore, right hippocampal atrophy is closely associated with sleep disorder, emphasizing the role of hippocampal as viable HD-SD predictor.Acknowledgements
No acknowledgement found.References
[1] Jha V, Garcia-Garcia G, Iseki K, et al. Chronic kidney disease: global dimension and perspectives. Lancet. 2013;382(9888):260-272.
[2] Eloot S, Holvoet E, Dequidt C, Maertens SJ, Vanommeslaeghe F, Van Biesen W. The complexity of sleep disorders in dialysis patients. Clin Kidney J. 2021;14(9):2029-2036.
[3] Parker KP. Sleep disturbances in dialysis patients. Sleep Med Rev. 2003;7(2):131-143.
[4] Stepanski E, Faber M, Zorick F, Basner R, Roth T. Sleep disorders in patients on continuous ambulatory peritoneal dialysis. J Am Soc Nephrol. 1995;6(2):192-197.
[5] Merlino G, Piani A, Dolso P, et al. Sleep disorders in patients with end-stage renal disease undergoing dialysis therapy. Nephrol Dial Transplant. 2006;21(1):184-190.
[6] Miranda AS, Cordeiro TM, Dos Santos Lacerda Soares TM, Ferreira RN, Simões E Silva AC. Kidney-brain axis inflammatory cross-talk: from bench to bedside. Clin Sci (Lond). 2017;131(11):1093-1105.
[7] Patenaude B, Smith SM, Kennedy DN, Jenkinson M. A Bayesian model of shape and appearance for subcortical brain segmentation. Neuroimage. 2011;56(3):907-922.
[8] Wang Z, Fontaine M, Cyr M, et al. Subcortical shape in pediatric and adult obsessive-compulsive disorder. Depress Anxiety. 2022;39(6):504-514.
[9] Tang X, Ross CA, Johnson H, et al. Regional subcortical shape analysis in premanifest Huntington's disease. Hum Brain Mapp. 2019;40(5):1419-1433.
[10] Gu W, He R, Su H, et al. Changes in the Shape and Volume of Subcortical Structures in Patients With End-Stage Renal Disease. Front Hum Neurosci. 2021;15:778807. Published 2021 Dec 16.
Figures