4366
Structural alterations in Spinocerebellar Ataxia Type 3: A 3T baseline and longitudinal MRI study of cerebellar peduncles and cerebral pathways1German Center for Neurodegenerative Diseases (DZNE), Bonn, Germany, 2Department of Neurology, University Hospital Bonn, Bonn, Germany
Synopsis
Keywords: Other Neurodegeneration, Neurodegeneration
Motivation: The first gene-silencing trials for Spinocerebellar Ataxia Type-3 (SCA3) highlights the need for non-invasive biomarkers.
Goal(s): We aim to evaluate white matter (WM) tract integrity, identify early-alterations before clinical onset (preSCA3) and track disease progression over time.
Approach: Analyze fractional anisotropy (FA) and mean diffusivity (MD) in WM tracts of healthy controls, preSCA3, and SCA3 patients at cross-sectional and longitudinal visits by employing a global and along-tract analysis.
Results: While longitudinal analysis did not show relevant changes, alterations in preSCA3 in FA and MD were observed in all cerebellar peduncles and in the dentato-rubro-thalamo-cortical-tract, indicating their potential as promising stratification-biomarkers before clinical onset.
Impact: This study offers a promising approach to differentiate early-stage SCA3 before clinical onset from healthy subjects, addressing clinical scale limitations. It underscores the potential of imaging biomarkers and the necessity for further research on disease progression modeling.
Introduction
As the first clinical gene silencing trials in Spinocerebellar ataxia type 3 (SCA3) have been initiated (https://clinicaltrials.gov, NCT05160558, NCT05822908), the demand for non-invasive quantitative biomarkers has become increasingly urgent, in particular for the pre-ataxic stage of SCA3 (preSCA3), as clinical assessment scales lack sensitivity before manifestation of symptoms. SCA3 characterizing neuropathological patterns include brainstem and cerebellar atrophy in particular involving the related white matter (WM) tracts1. Therefore, understanding how changes in WM microstructure relate to ataxia severity and its progression is of interest. We investigate 14 cerebral and cerebellar WM tracts, but for the sake of simplicity in this abstract, we specifically focus on the Dentato-Rubro-Thalamo-Cortical Tract (DRTCT) as well as the superior, middle, and inferior cerebellar peduncles (SCP, MCP, ICP). We aim to 1) evaluate the integrity of the WM tracts; 2) identify the tracts and corresponding locations that already show alterations in the preSCA3; and 3) track disease progression over time.Methods
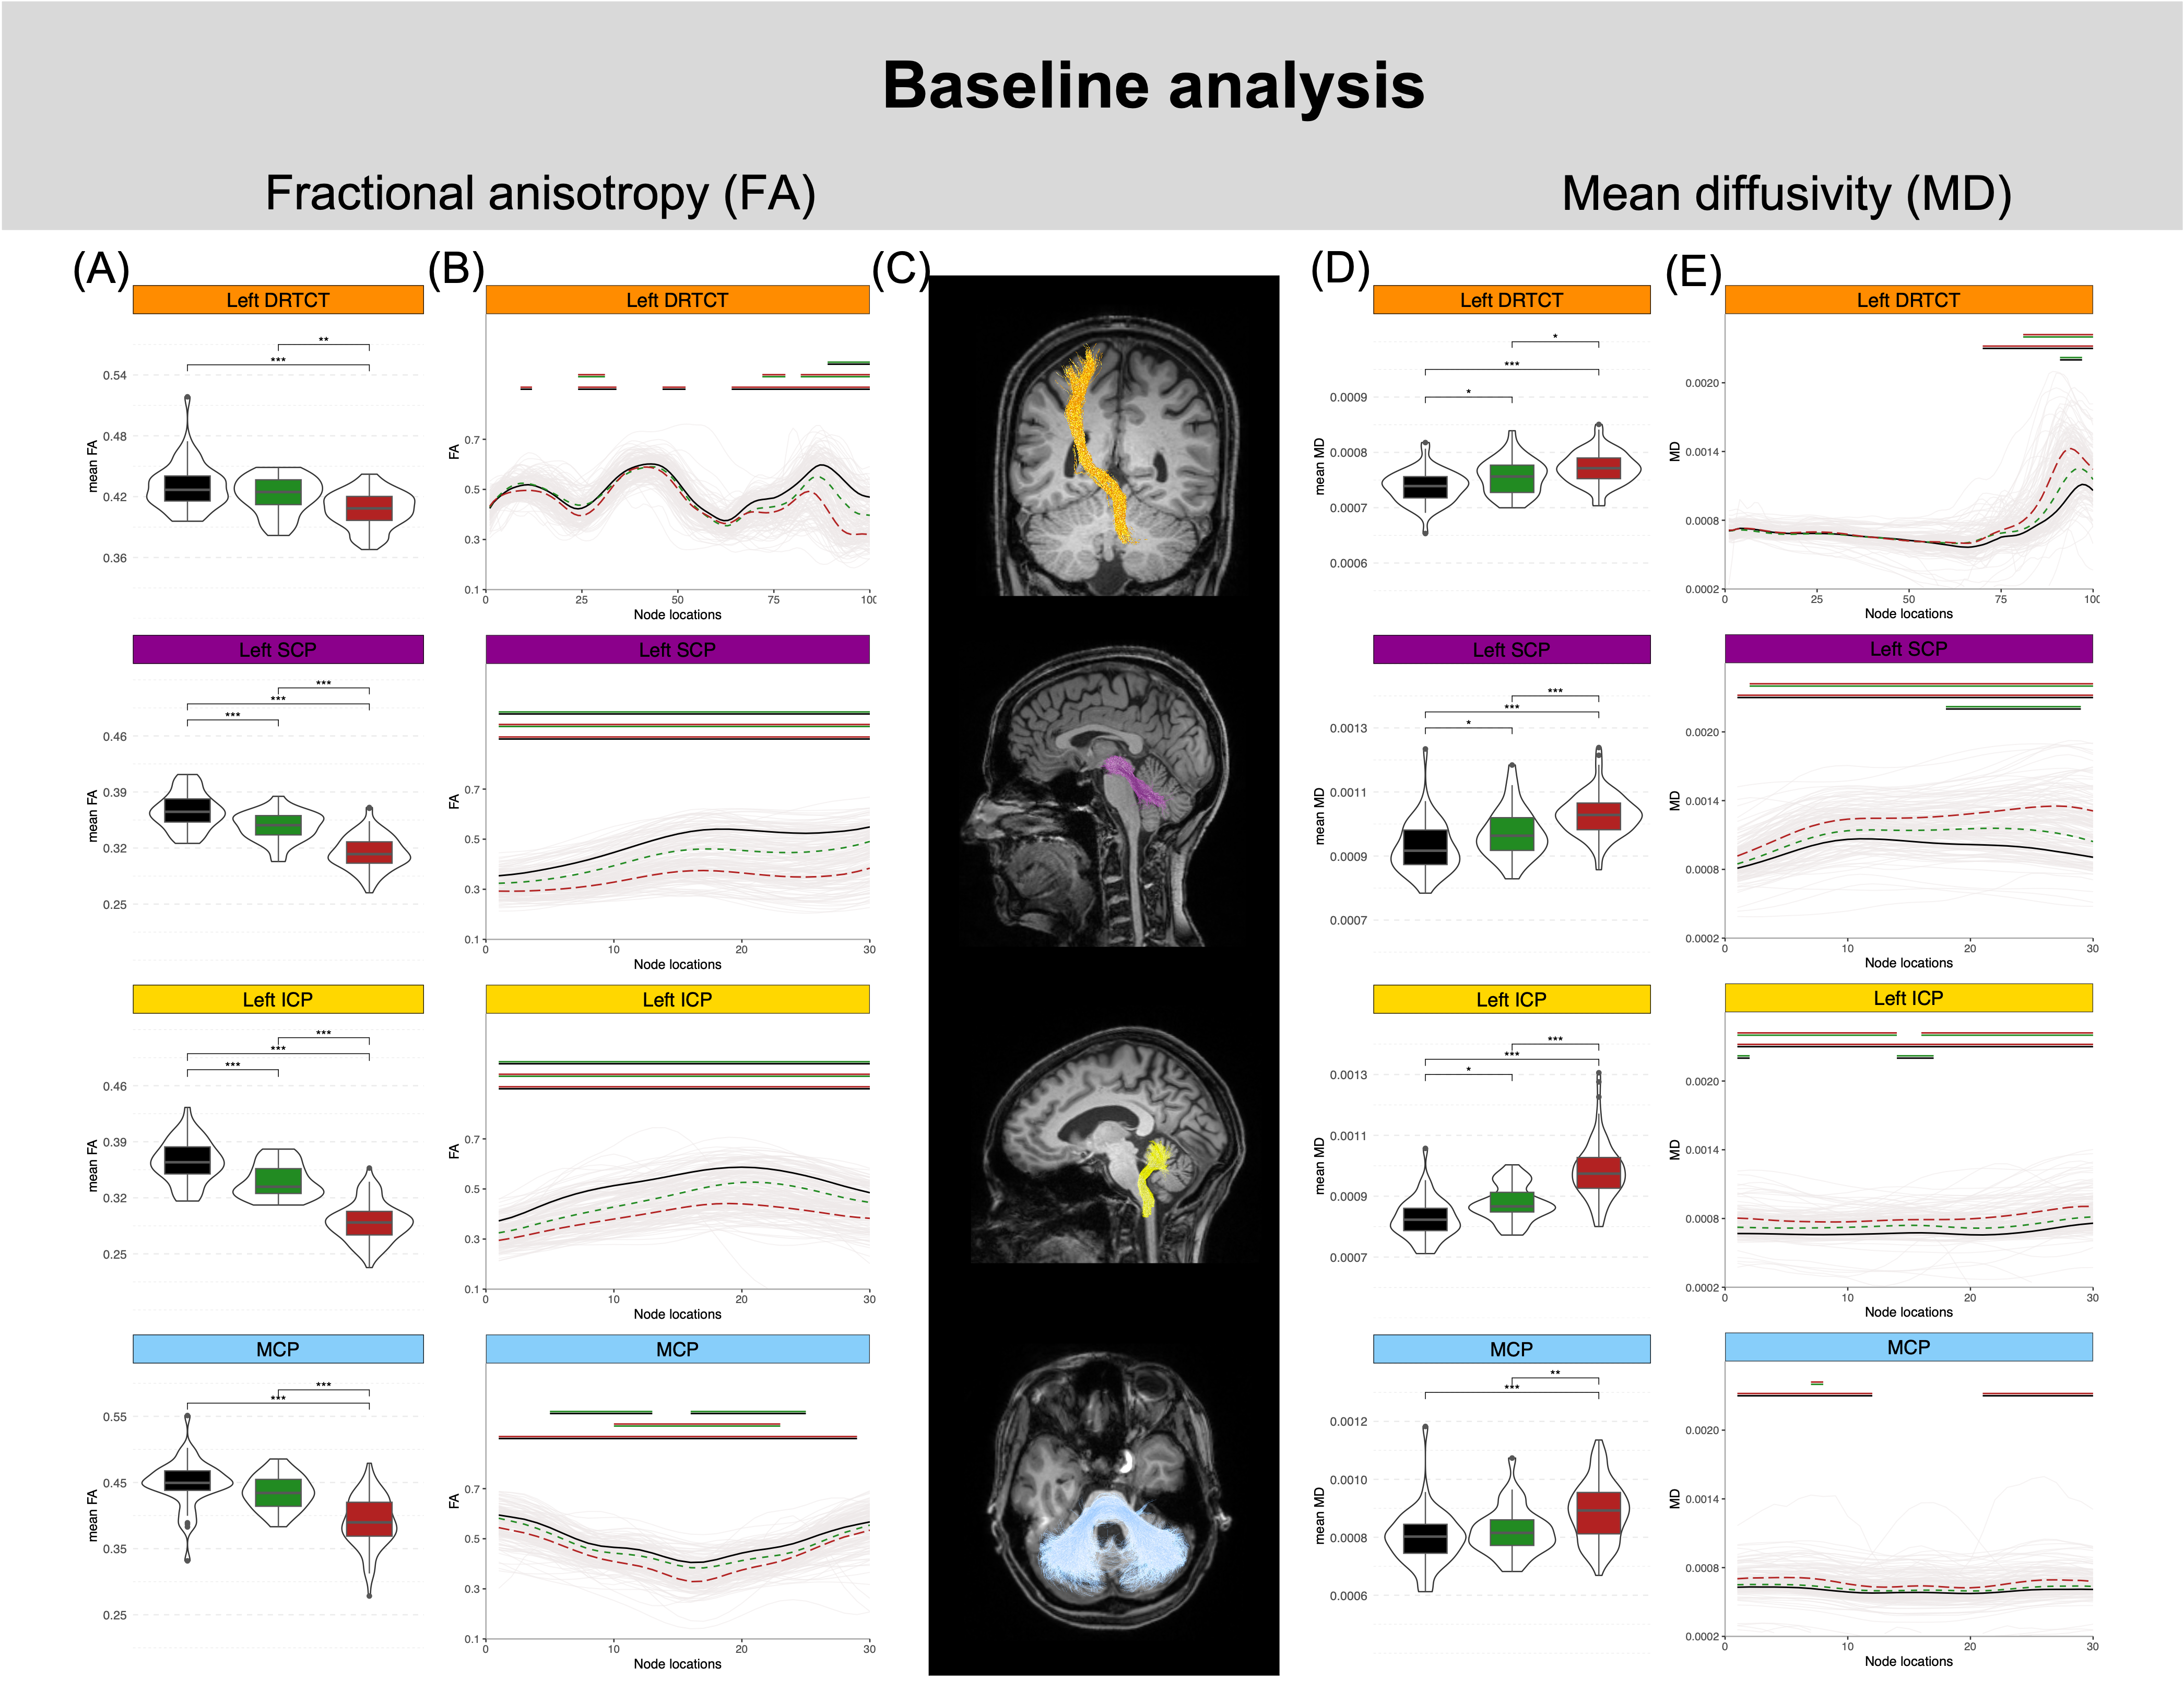
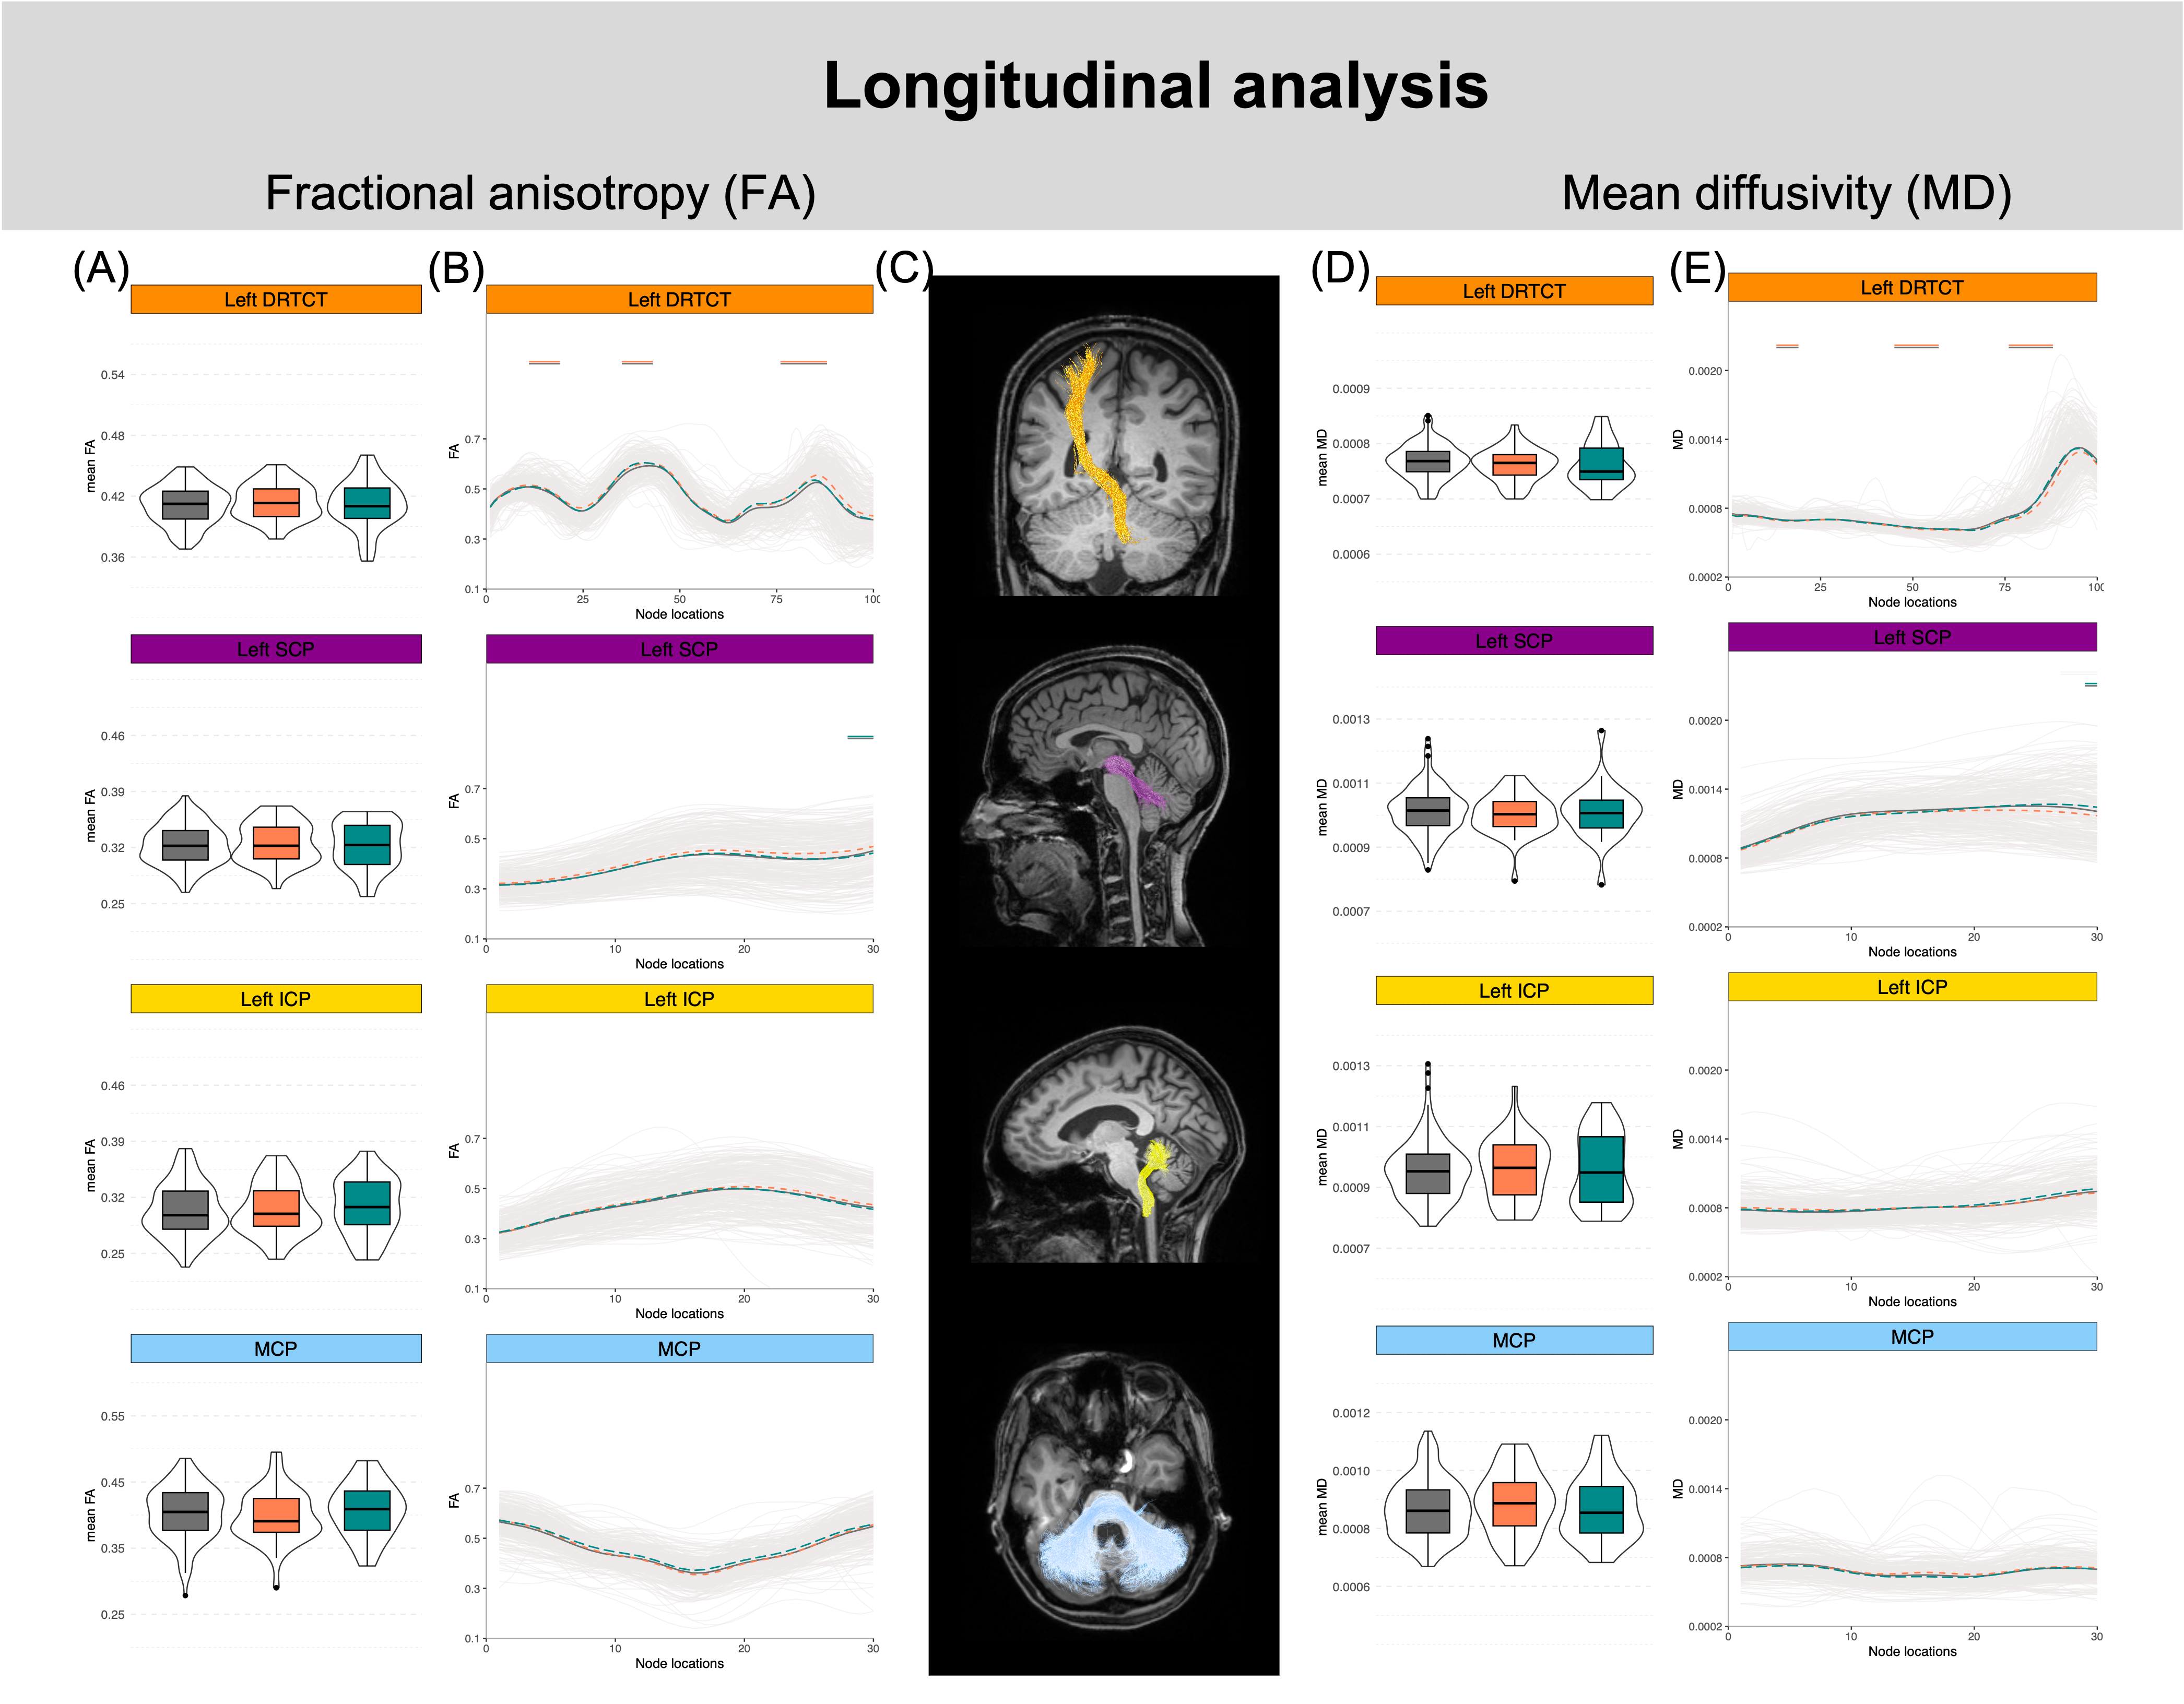
In a multicenter, longitudinal study we acquired diffusion data from 294 subjects (181 at baseline: 49 HCs, 34 preSCA3, 98 SCA3; 72 at 1-year follow-up (FU): 19 HCs, 17 preSCA3, 36 SCA3; 41 at 2-year FU: 10 HCs, 8 preSCA3, 23 SCA3). Data was acquired on 3T Siemens scanners using an EPI sequence with sequence parameters described in Figure 1. Data was pre-processed with FSL2,3. Tracking was performed with MRtrix using multi-shell multi-tissue constrained spherical deconvolution4. Streamlines were generated by entering pre-defined regions of interest5,6, cleaned, and clipped6. Fractional anisotropy (FA) and mean diffusivity (MD) maps were generated with FSL and harmonized with COMBAT7. Mean FA and mean MD were calculated for each tract (Figures 2-3: (A) and (D)). The delineation of FA and MD was given for 100 equidistant locations along the DRTCT, and 30 locations for the cerebellar peduncles (Figures 2-3: (B) and (E)). In both approaches, statistical analysis was performed using linear regression and linear mixed models for baseline (Figure 2) and longitudinal analysis (Figure 3), respectively. To visualize significant differences following Tukey post hoc analysis, we added the significance level to the boxplots (Figures. 2-3: (A) and (D)) and colored horizontal lines where the respective group comparison differed significantly (Figures 2-3: (B) and (E)).Results and discussion
Figure 2 shows that at baseline, there is a stepwise pattern with HCs having higher FA values compared to those of preSCA3, which, in turn, are higher than those in SCA3. Regarding MD, HCs showed lower MD values compared to those of preSCA3, which, in turn, are lower than those in SCA3. While mean FA and mean MD can provide an overview of the entire region, capturing general group differences, along-tract analysis, on the other hand, allows to localize changes that might not be evident in the global analysis. This is particularly evident in the DRTCT and in the MCP, where no significant changes between the HCs and preSCA3 are shown with the global approach even though differences exist in specific locations. A significant decrease in FA values and a significant increase in MD values is indicative of the progressive deterioration of WM microstructures compromising the integrity of the WM tracts. These results confirm that structural changes occur even before the full clinical manifestation of SCA3. Figure 3 shows the results of the longitudinal analysis. We studied data from 1-year and 2-year follow-ups (FUs) including both preSCA3 and SCA3 mutation carriers. Global analysis revealed no significant differences in mean FA nor mean MD metrics over time indicating that FA and MD are relatively constant. Additionally, the along-tract analysis showed minimal to no significant changes, except for parts of the DRTCT and SCP, which cannot be interpreted as a reliable and strong effect.Conclusion
These findings underline the significance of the brain-cerebellum connections and the potential of FA and MD as promising imaging biomarkers, particularly for the pre-ataxic stage of SCA3 and thus, their potential as stratification markers. Our number of available longitudinal preSCA3 and SCA3 was limited and studies including larger numbers of preSCA3 are needed to evaluate the potential as progression markers.Acknowledgements
No acknowledgement found.References
1 - Klockgether T, Mariotti C, Paulson HL. Spinocerebellar ataxia. Nat Rev Dis Primers. 2019 Apr 11;5(1):24. doi: 10.1038/s41572-019-0074-3. PMID: 30975995.
2 - Andersson JLR, Sotiropoulos SN. An integrated approach to correction for off-resonance effects and subject movement in diffusion MR imaging. Neuroimage. 2016 Jan 15;125:1063-1078. doi: 10.1016/j.neuroimage.2015.10.019. Epub 2015 Oct 20. PMID: 26481672; PMCID: PMC4692656.
3 - Andersson JL, Skare S, Ashburner J. How to correct susceptibility distortions in spin-echo echo-planar images: application to diffusion tensor imaging. Neuroimage. 2003 Oct;20(2):870-88. doi: 10.1016/S1053-8119(03)00336-7. PMID: 14568458.
4 - Tournier JD, Smith R, Raffelt D, Tabbara R, Dhollander T, Pietsch M, Christiaens D, Jeurissen B, Yeh CH, Connelly A. MRtrix3: A fast, flexible and open software framework for medical image processing and visualisation. Neuroimage. 2019 Nov 15;202:116137. doi: 10.1016/j.neuroimage.2019.116137. Epub 2019 Aug 29. PMID: 31473352.
5 - Wakana S, Caprihan A, Panzenboeck MM, Fallon JH, Perry M, Gollub RL, Hua K, Zhang J, Jiang H, Dubey P, Blitz A, van Zijl P, Mori S. Reproducibility of quantitative tractography methods applied to cerebral white matter. Neuroimage. 2007 Jul 1;36(3):630-44. doi: 10.1016/j.neuroimage.2007.02.049. Epub 2007 Mar 20. PMID: 17481925; PMCID: PMC2350213.
6 - Yeatman JD, Dougherty RF, Myall NJ, Wandell BA, Feldman HM. Tract profiles of white matter properties: automating fiber-tract quantification. PLoS One. 2012;7(11):e49790. doi: 10.1371/journal.pone.0049790. Epub 2012 Nov 14. PMID: 23166771; PMCID: PMC3498174.
7 - Fortin JP, Parker D, Tunç B, Watanabe T, Elliott MA, Ruparel K, Roalf DR, Satterthwaite TD, Gur RC, Gur RE, Schultz RT, Verma R, Shinohara RT. Harmonization of multi-site diffusion tensor imaging data. Neuroimage. 2017 Nov 1;161:149-170. doi: 10.1016/j.neuroimage.2017.08.047. Epub 2017 Aug 18. PMID: 28826946; PMCID: PMC5736019.
Figures