4363
Altered cerebellar functional network topology in spinocerebellar ataxia type 31Department of radiology, Shandong Provincial Hospital Affiliated to Shandong First Medical University, Jinan, China, 2Department of radiology, China Japan Friendship Hospital, Beijing, China, 3Department of neurology, China Japan Friendship Hospital, Beijing, China
Synopsis
Keywords: Other Neurodegeneration, Brain Connectivity, cerebellum; fMRI (resting state); cerebellar network
Motivation: Functional network changes of the cerebellum in patients with spinocerebellar ataxia type 3 (SCA3) have been scarcely assessed.
Goal(s): To investigate the functional topological characteristics of cerebellar network connectivity and modular changes in SCA3.
Approach: Graph theoretical method were used in this study to provide quantified topological organization and modular analyses of functional cerebellar networks.
Results: The small-world organization of the cerebellum was spared in patients with SCA3. Compared with healthy controls, increased inter-modular connectivity between frontoparietal network and dorsal somatomotor network and decreased intra-modular connectivity in cerebellar default mode network were shown in SCA3 patients.
Impact: This study displays the functional cerebellar topological network in SCA3. The abnormalities of cerebellar modular connectivity support SCA3 as a network disorder, which further enhance the interpretation of SCA3 from the perspective of neuroimaging.
Introduction
The cerebellum was considered as the major brain structure involved in the neuropathology of spinocerebellar ataxia type 3 (SCA3).Previous neuroimaging studies reported disrupted structural networks as key contributors in SCA3[1-3], whereas functional network changes, especially in the cerebellum, have been scarcely assessed. This study aimed to investigate the functional topological characteristics of cerebellar network connectivity and explore possible correlations between neuroimaging findings and clinical parameters in patients with SCA3.Methods
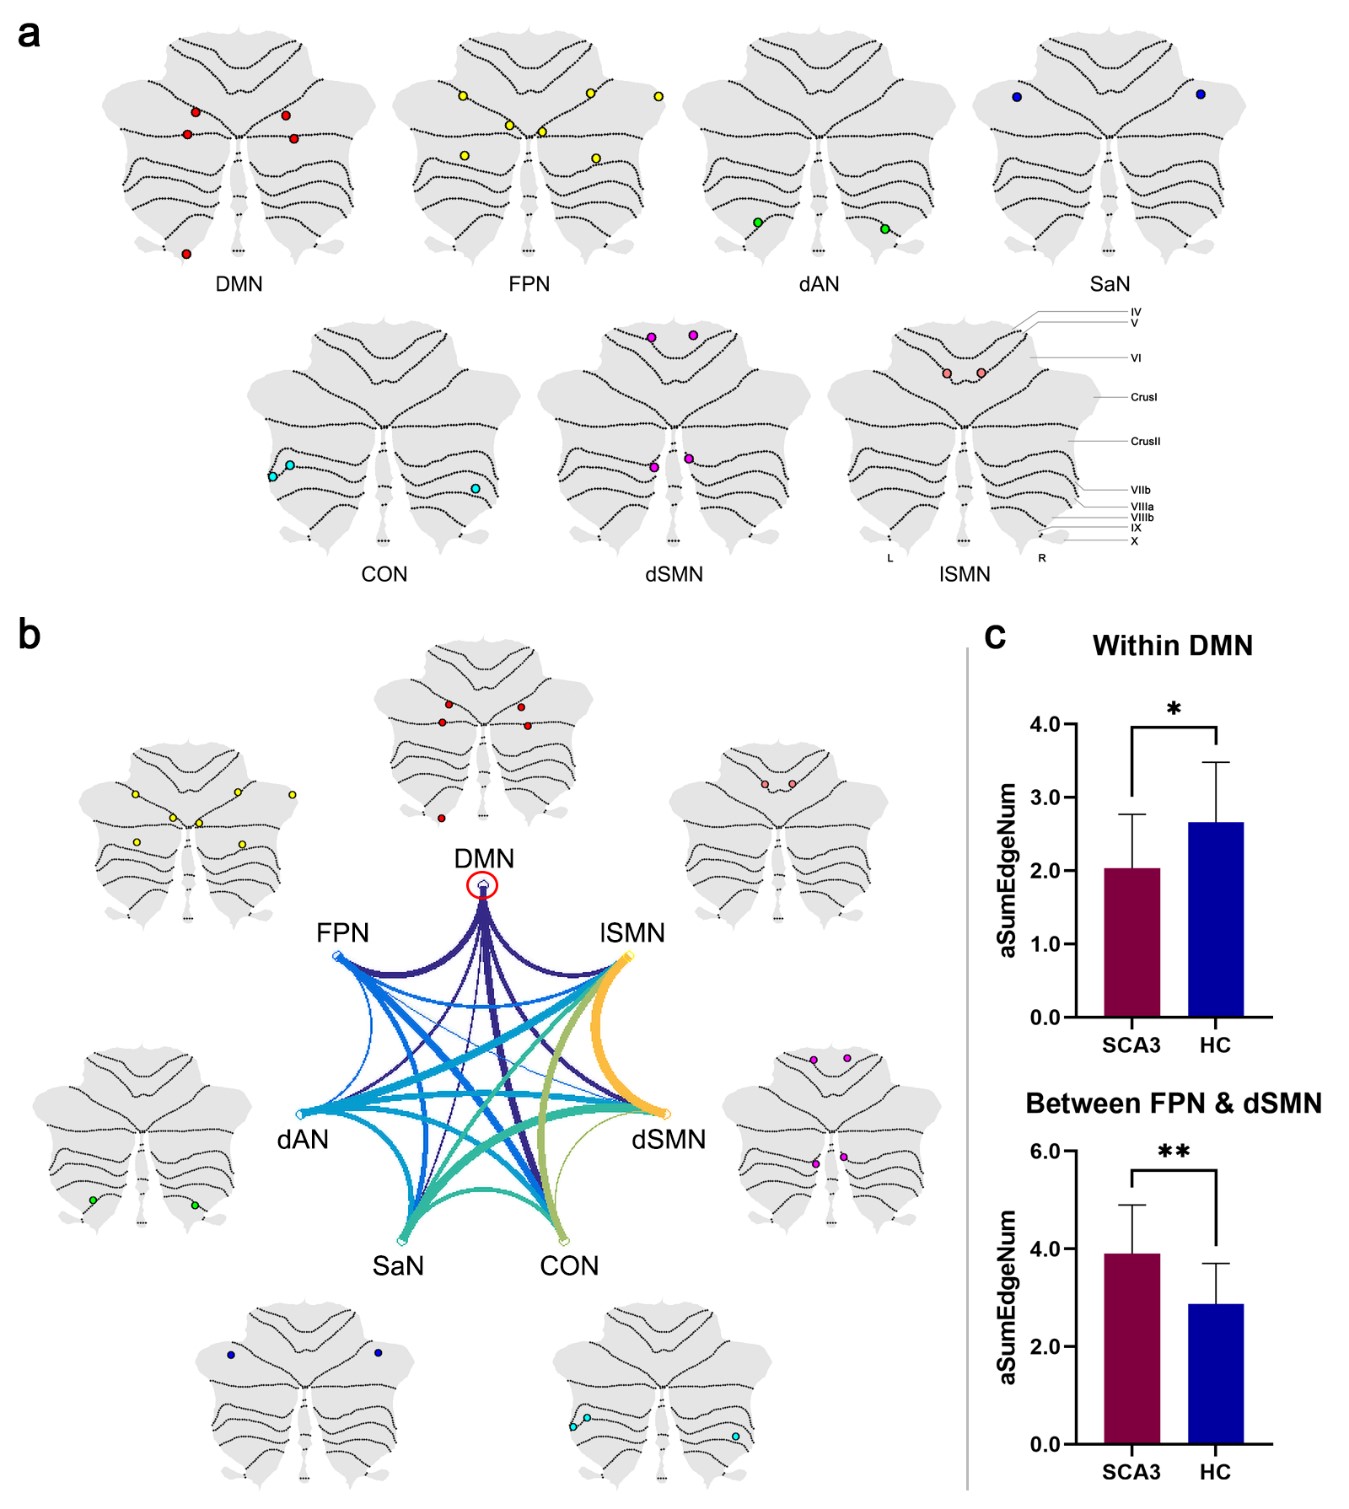
Resting-state functional magnetic resonance imaging (rs-fMRI) and structural T1 weighted volumes from 17 SCA3 patients and 17 healthy controls (HCs), acquired from a 3.0 Tesla MR scanner (GE, Discovery MR750), were analyzed for cerebellar functional network topology. The rs-fMRI data was preprocessed in GRETNA. Averaged time series of voxels within each of the cerebellar nodes derived from the Seitzman-27 atlas[4] were extracted. Pearson correlation coefficients (r) calculated between each pair of nodes were defined as the edges, therefore a 27 × 27 correlation matrix with corresponding 351 edges was generated for each subject. All the correlation r matrices were absolutely transformed to binary matrices by using sparsity thresholds (0.05-0.5) with an interval of 0.05[5]. Ten topological parameters and their area under the curve (AUC) were derived from these binary matrices. Those 27 cerebellar nodes were divided into 7 modules and their label number were directly used as the predefined community index in GRETNA. The predefined community index was used for all subjects on their absolutely transformed binary matrices at the same sparsity threshold range. The within-modular functional connectivity was measured as the total number of edges (SumEdgeNum) among all the nodes within the specific module, whereas the between-modular connectivity was that between any pair of predefined modules. Subsequently, the AUC value for each within- and between-modular parameters (aSumEdgeNum) was calculated under sparsity 0.05-0.5 and evaluated by the independent sample t-test (p<0.05, age- and sex-controlled) between SCA3 patients and HCs. The data-driven modularity analysis was performed on the group level generated by averaging functional cerebellar connectivity across all HCs[6, 7]. The modularity value (Q) was estimated via Newman's spectral optimization algorithm at every sparsity threshold from 0.05 to 0.50, respectively. The community index and the sparsity that corresponding to the maximum Q value (Q = 0.29) among 10 sparsity thresholds was then applied to all subjects on their absolutely transformed binary matrices. The SumEdgeNum was used for group comparisons under two-sample sample t-test with age- and sex-controlled at the significant level of p<0.05. Pearson correlation analyses of those significant functional modifications against the clinical characteristics (disease duration, CAG repeats, SARA and ICARS scores) were also performed in SCA3 group. Significant threshold was set at p<0.05 (two-tailed).Results
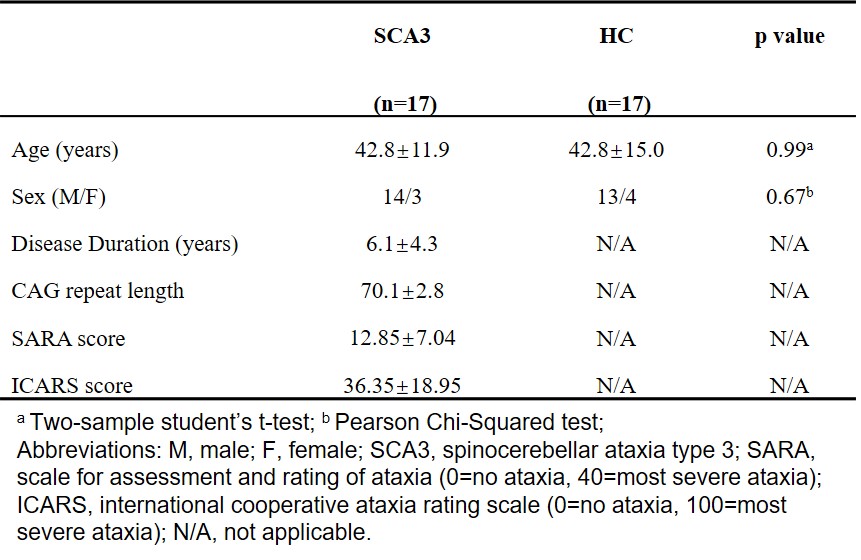
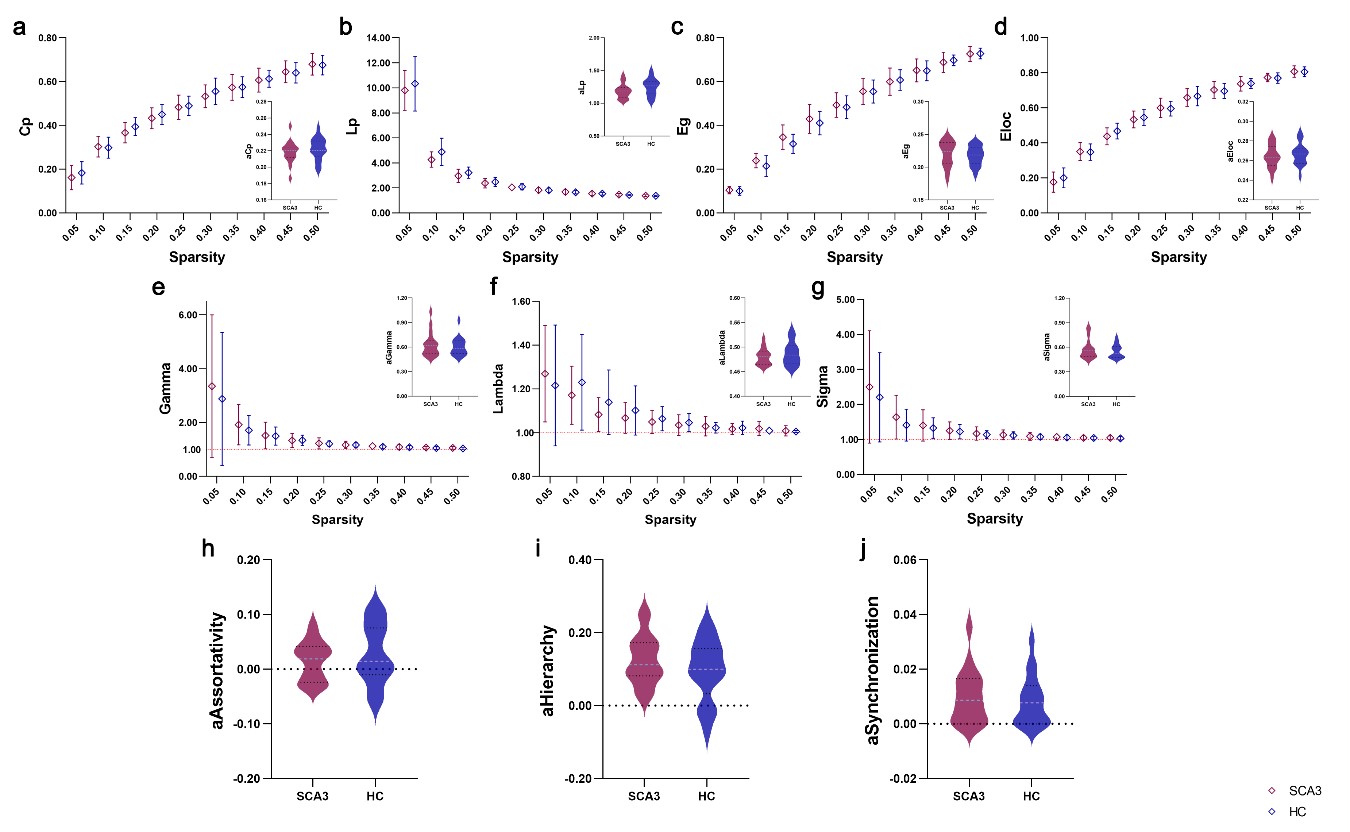
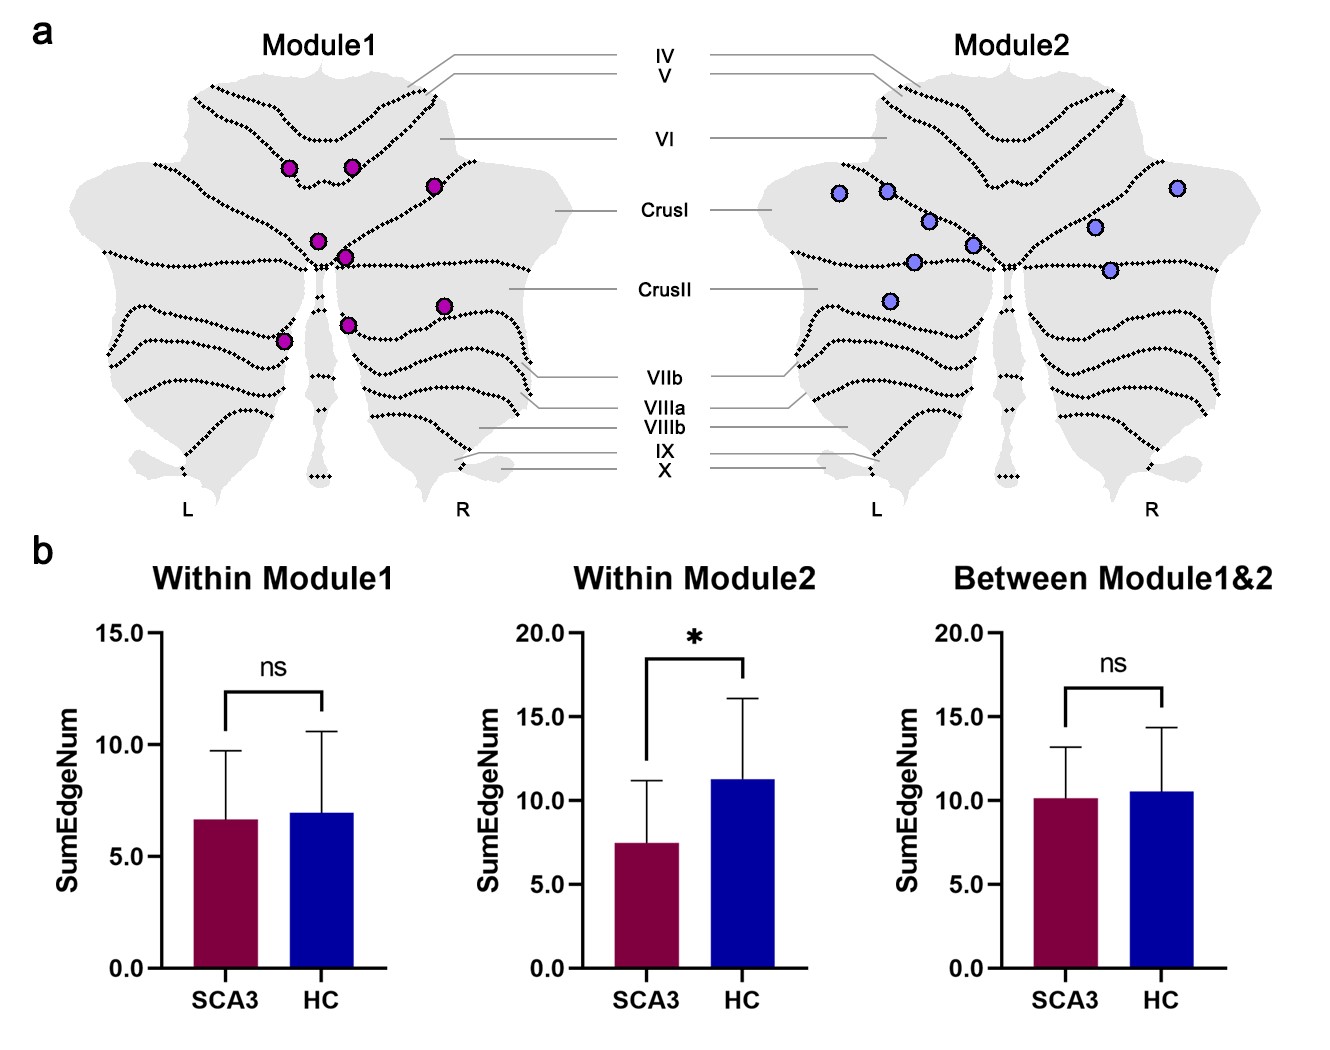
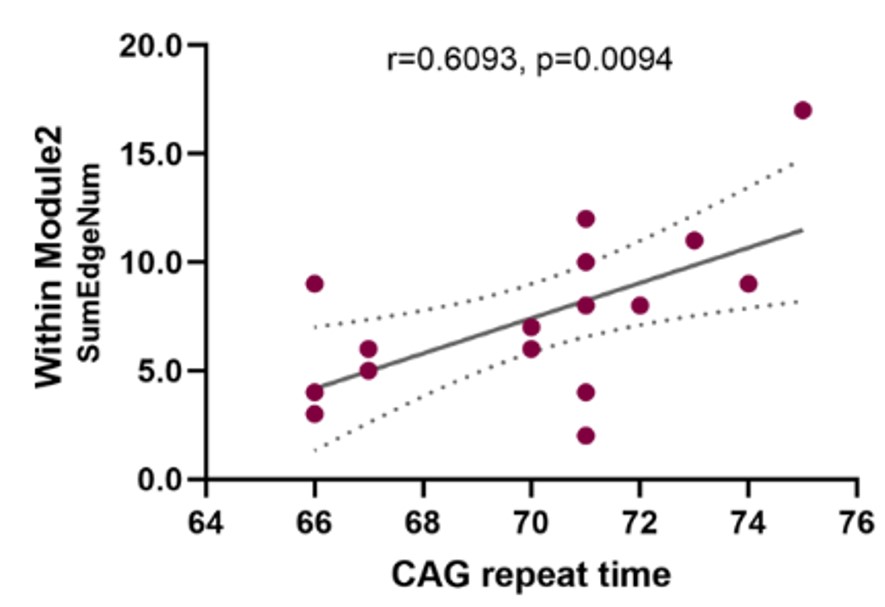
There was no significant group difference in age and sex between SCA3 patients and HCs (Table 1). Small-world organization for functional connectivity of cerebellum was shown in both groups, with Gamma>1, Lambda≈1 and the Sigma>1 (Figure 1). For SCA3 patients, aGamma and aSigma were higher while aLambda was slightly lower; aAssortativity was lower whereas aHierarchy and aSynchronization were higher than those for HCs. However, there was no statistically significant differences in any AUC of those 10 topological parameters between two groups after controlling age and sex as covariates. In predefined modular analysis (Figure 2), the aSumEdgeNum between frontoparietal network (FPN) and dorsal somatomotor network (dSMN) modules was significantly increased in SCA3 than that in HCs. The aSumEdgeNum within DMN was significantly decreased in patients with SCA3. Two modules were identified in data-driven modular analysis (Figure 3). The within-modular FC number (SumEdgeNum) of Module2 was significantly decreased in SCA3. In correlation analyses, the total number of edges within Module2 was positively correlated with the CAG repeat length (Figure 4).Discussion & Conclusion
The functional cerebellar network of both groups were organized in efficient small-world manners while SCA3 patients had a tendency of disturbed cerebellar global integration and local specialization, which implied the cerebellar functional network was in transition to relatively less efficient information flow. Modular analyses suggested that the cerebellar DMN and SMN were important functional modules which might be responsible for cerebellar dysregulation. As Module2 was consisted of nodes in bilateral crus I and crus II, namely the key hubs of cerebellar functional connectome, longer CAG repeats might contribute to more abnormal hub-hub connections within DMN subnetwork, resulting in its vulnerability as well as the reduction of wiring efficiency. Therefore, Our findings indicate a relatively preserved cerebellar functional topological architectures in SCA3, with specific modular alterations of cerebellar network, deepening the understanding of the cerebellar role in SCA3.Acknowledgements
The authors gratefully thank for the support and assistance from Lizhi Xie Ph.D. of GE Healthcare China Research Team and all participants who were involved in this study as well as everyone who offered help.References
1. Wu YT, Huang SR, Jao CW, Soong BW, Lirng JF, Wu HM, et al. Impaired Efficiency and Resilience of Structural Network in Spinocerebellar Ataxia Type 3. Front Neurosci. 2018;12:935.
2. Chen XY, Huang ZQ, Lin W, Li MC, Ye ZX, Qiu YS, et al. Altered brain white matter structural motor network in spinocerebellar ataxia type 3. Ann Clin Transl Neurol. 2023;10(2):225-36.
3. Jao CW, Soong BW, Wang TY, Wu HM, Lu CF, Wang PS, et al. Intra- and Inter-Modular Connectivity Alterations in the Brain Structural Network of Spinocerebellar Ataxia Type 3. Entropy (Basel). 2019;21(3).
4. Seitzman BA, Gratton C, Marek S, Raut RV, Dosenbach NUF, Schlaggar BL, et al. A set of functionally-defined brain regions with improved representation of the subcortex and cerebellum. Neuroimage. 2020;206:116290.
5. Chen Z, Zhang R, Huo H, Liu P, Zhang C, Feng T. Functional connectome of human cerebellum. Neuroimage. 2022;251:119015.
6. Guo X, Yang F, Fan L, Gu Y, Ma J, Zhang J, et al. Disruption of functional and structural networks in first-episode, drug-naïve adolescents with generalized anxiety disorder. J Affect Disord. 2021;284:229-37.
7. Dai Z, Lin Q, Li T, Wang X, Yuan H, Yu X, et al. Disrupted structural and functional brain networks in Alzheimer's disease. Neurobiol Aging. 2019;75:71-82.
Figures