4362
Brain connectome-based prediction of cognitive performance in patients with type 2 diabetes1The Affiliated Drum Tower Hospital of Nanjing University Medical School, Nanjing, China, 2Philips Healthcare, Shanghai, China
Synopsis
Keywords: Dementia, Brain Connectivity, Dementia, Diabetes
Motivation: Address the common issue of cognitive decline in type 2 diabetes (T2D) patients, lacking a simple cognitive assessment method.
Goal(s): Use a connectome-based prediction model (CPM) to identify neurobiological patterns linked to cognitive performance in T2D patients.
Approach: CPM was used with leave-one-out cross-validation on a training cohort of 592 T2D patients and validated the model on two independent sets.
Results: CPM successfully predicted cognitive performance, showing replicability. We found differences in network strengths between T2D with and without MCI, indicated high diagnostic potential for MCI. In a treatment sample, the model indicated changes in network strength linked to cognitive improvement.
Impact: The whole-brain functional network strengths could serve as a potential neural biomarker of global cognitive performance in T2D.
Introduction
Cognitive decline is common in patients with type 2 diabetes (T2D), but to date there is no simple and rapid way to measure cognitive ability. This study employs a connectome-based prediction model (CPM) to discern the neurobiological patterns associated with global cognitive performance in T2D patients.Methods
We employed CPM with leave-one-out cross-validation to examine the significant functional networks capable of forecasting cognitive performance in a training cohort comprising 592 T2D patients. Subsequently, the model was assessed on two independent validation sets (set 1, n=198; set 2, n=105). Furthermore, we utilized the identified networks on a subset of 58 subjects who underwent a 3-month follow-up involving various antidiabetic drug interventions. To assess the model's diagnostic potential for mild cognitive impairment (MCI), we conducted a comparison of network strengths in individuals with T2D both with and without MCI. Age, sex, years of education, and body mass index were controlled as covariates.Results
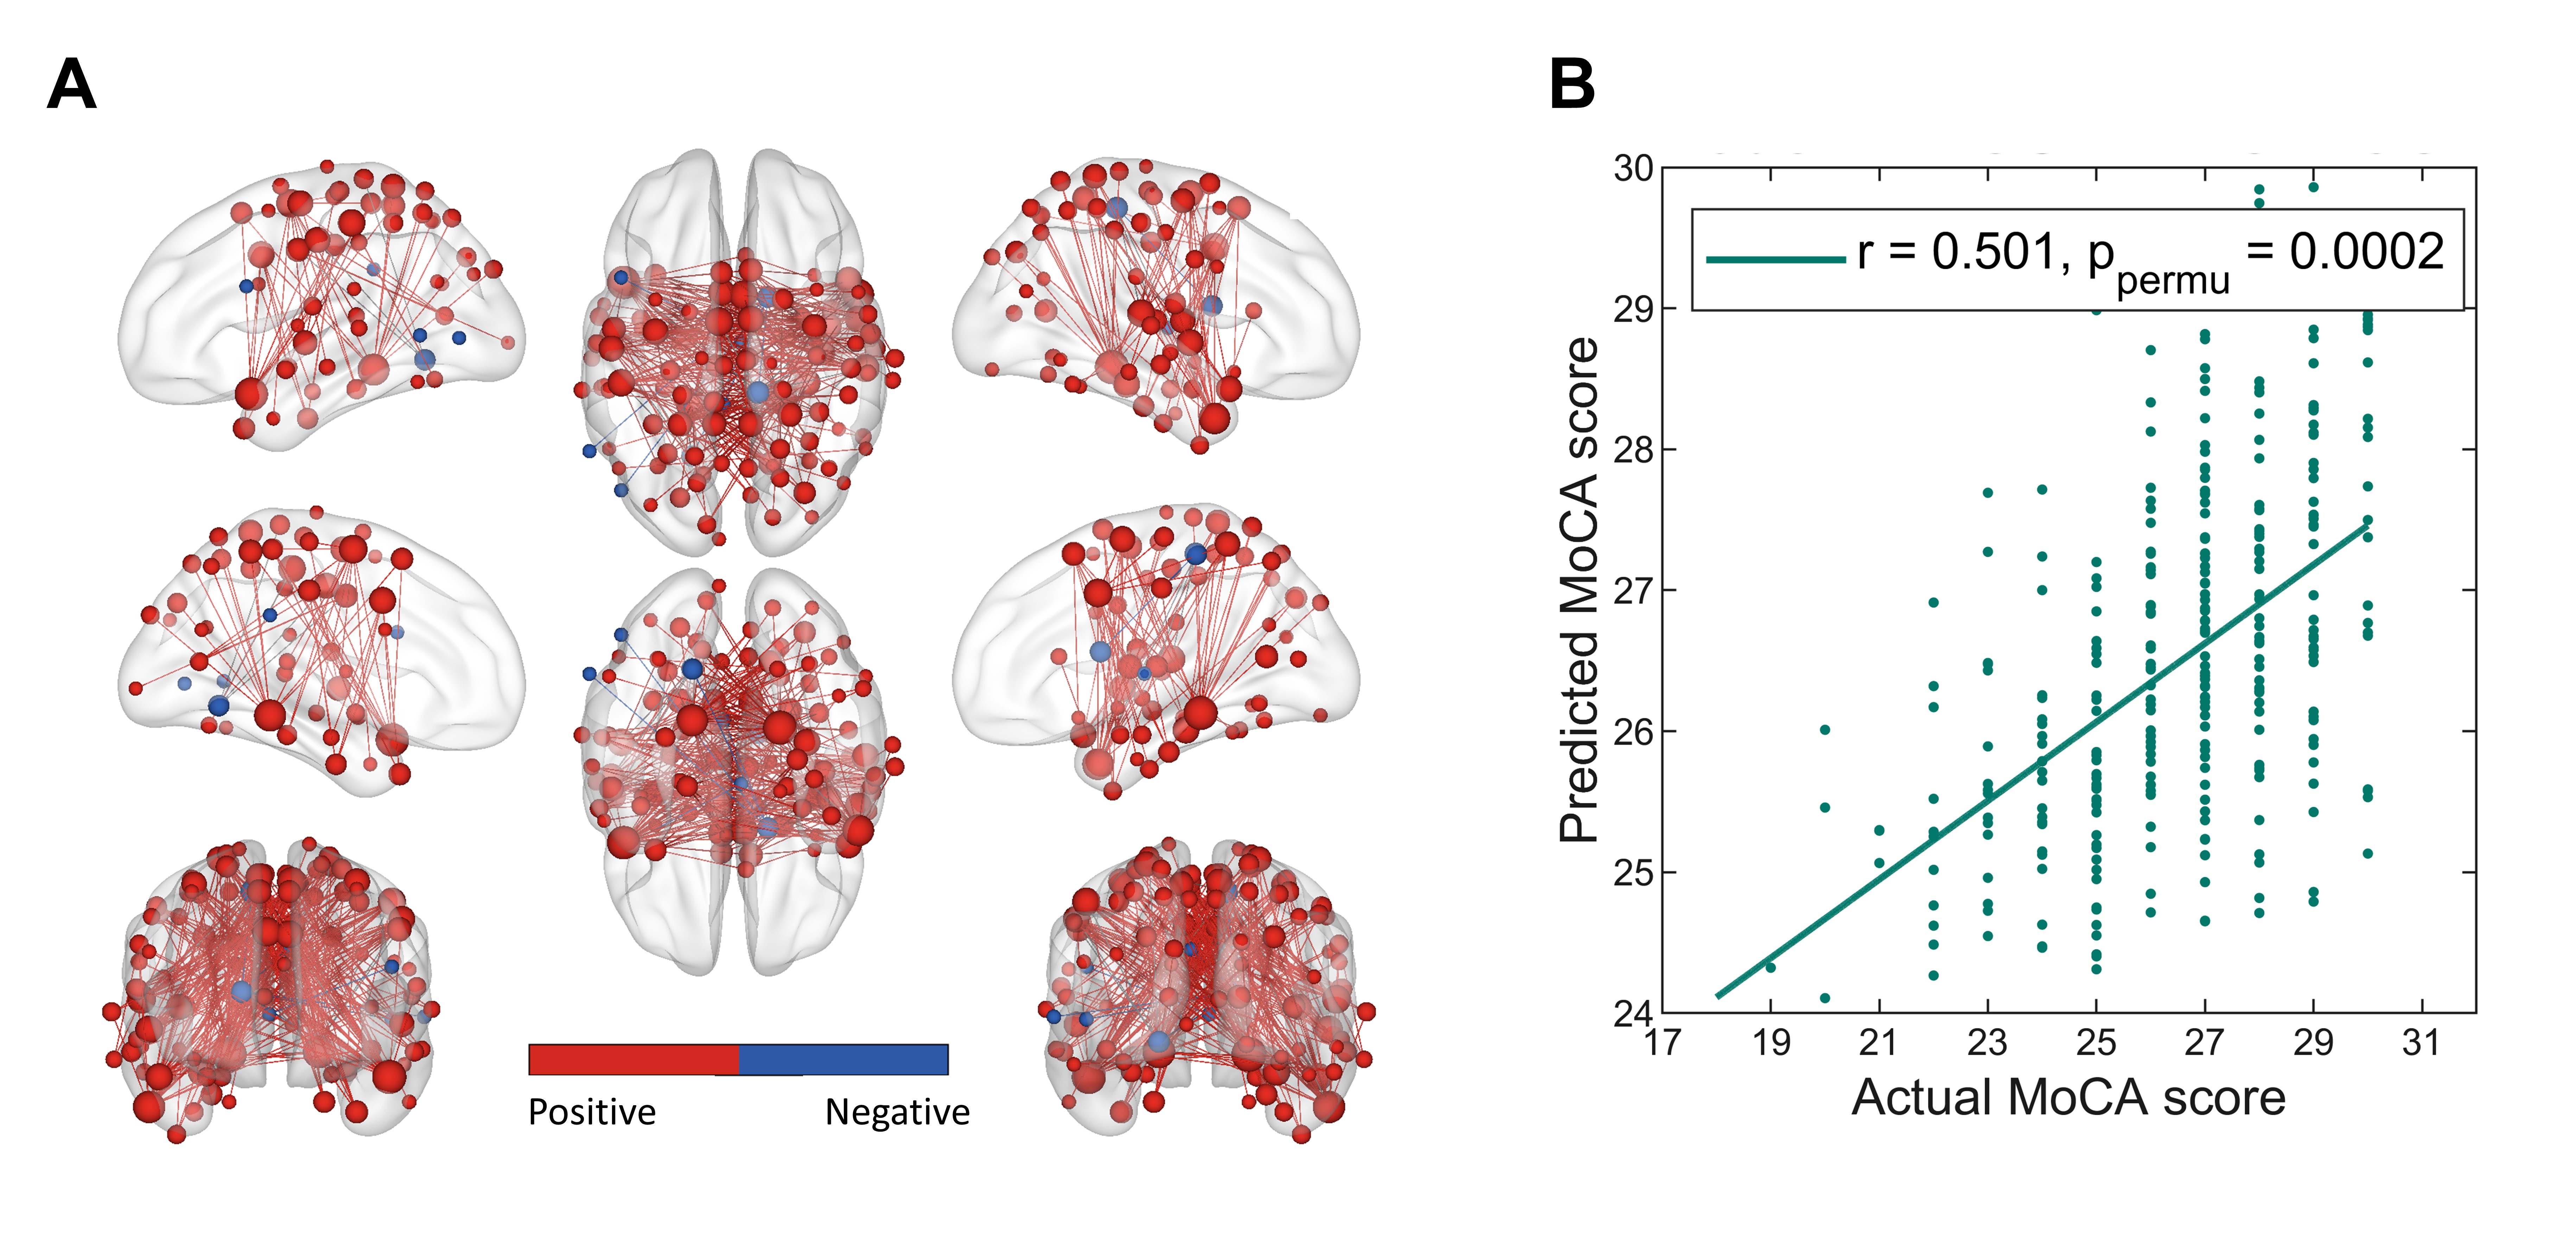
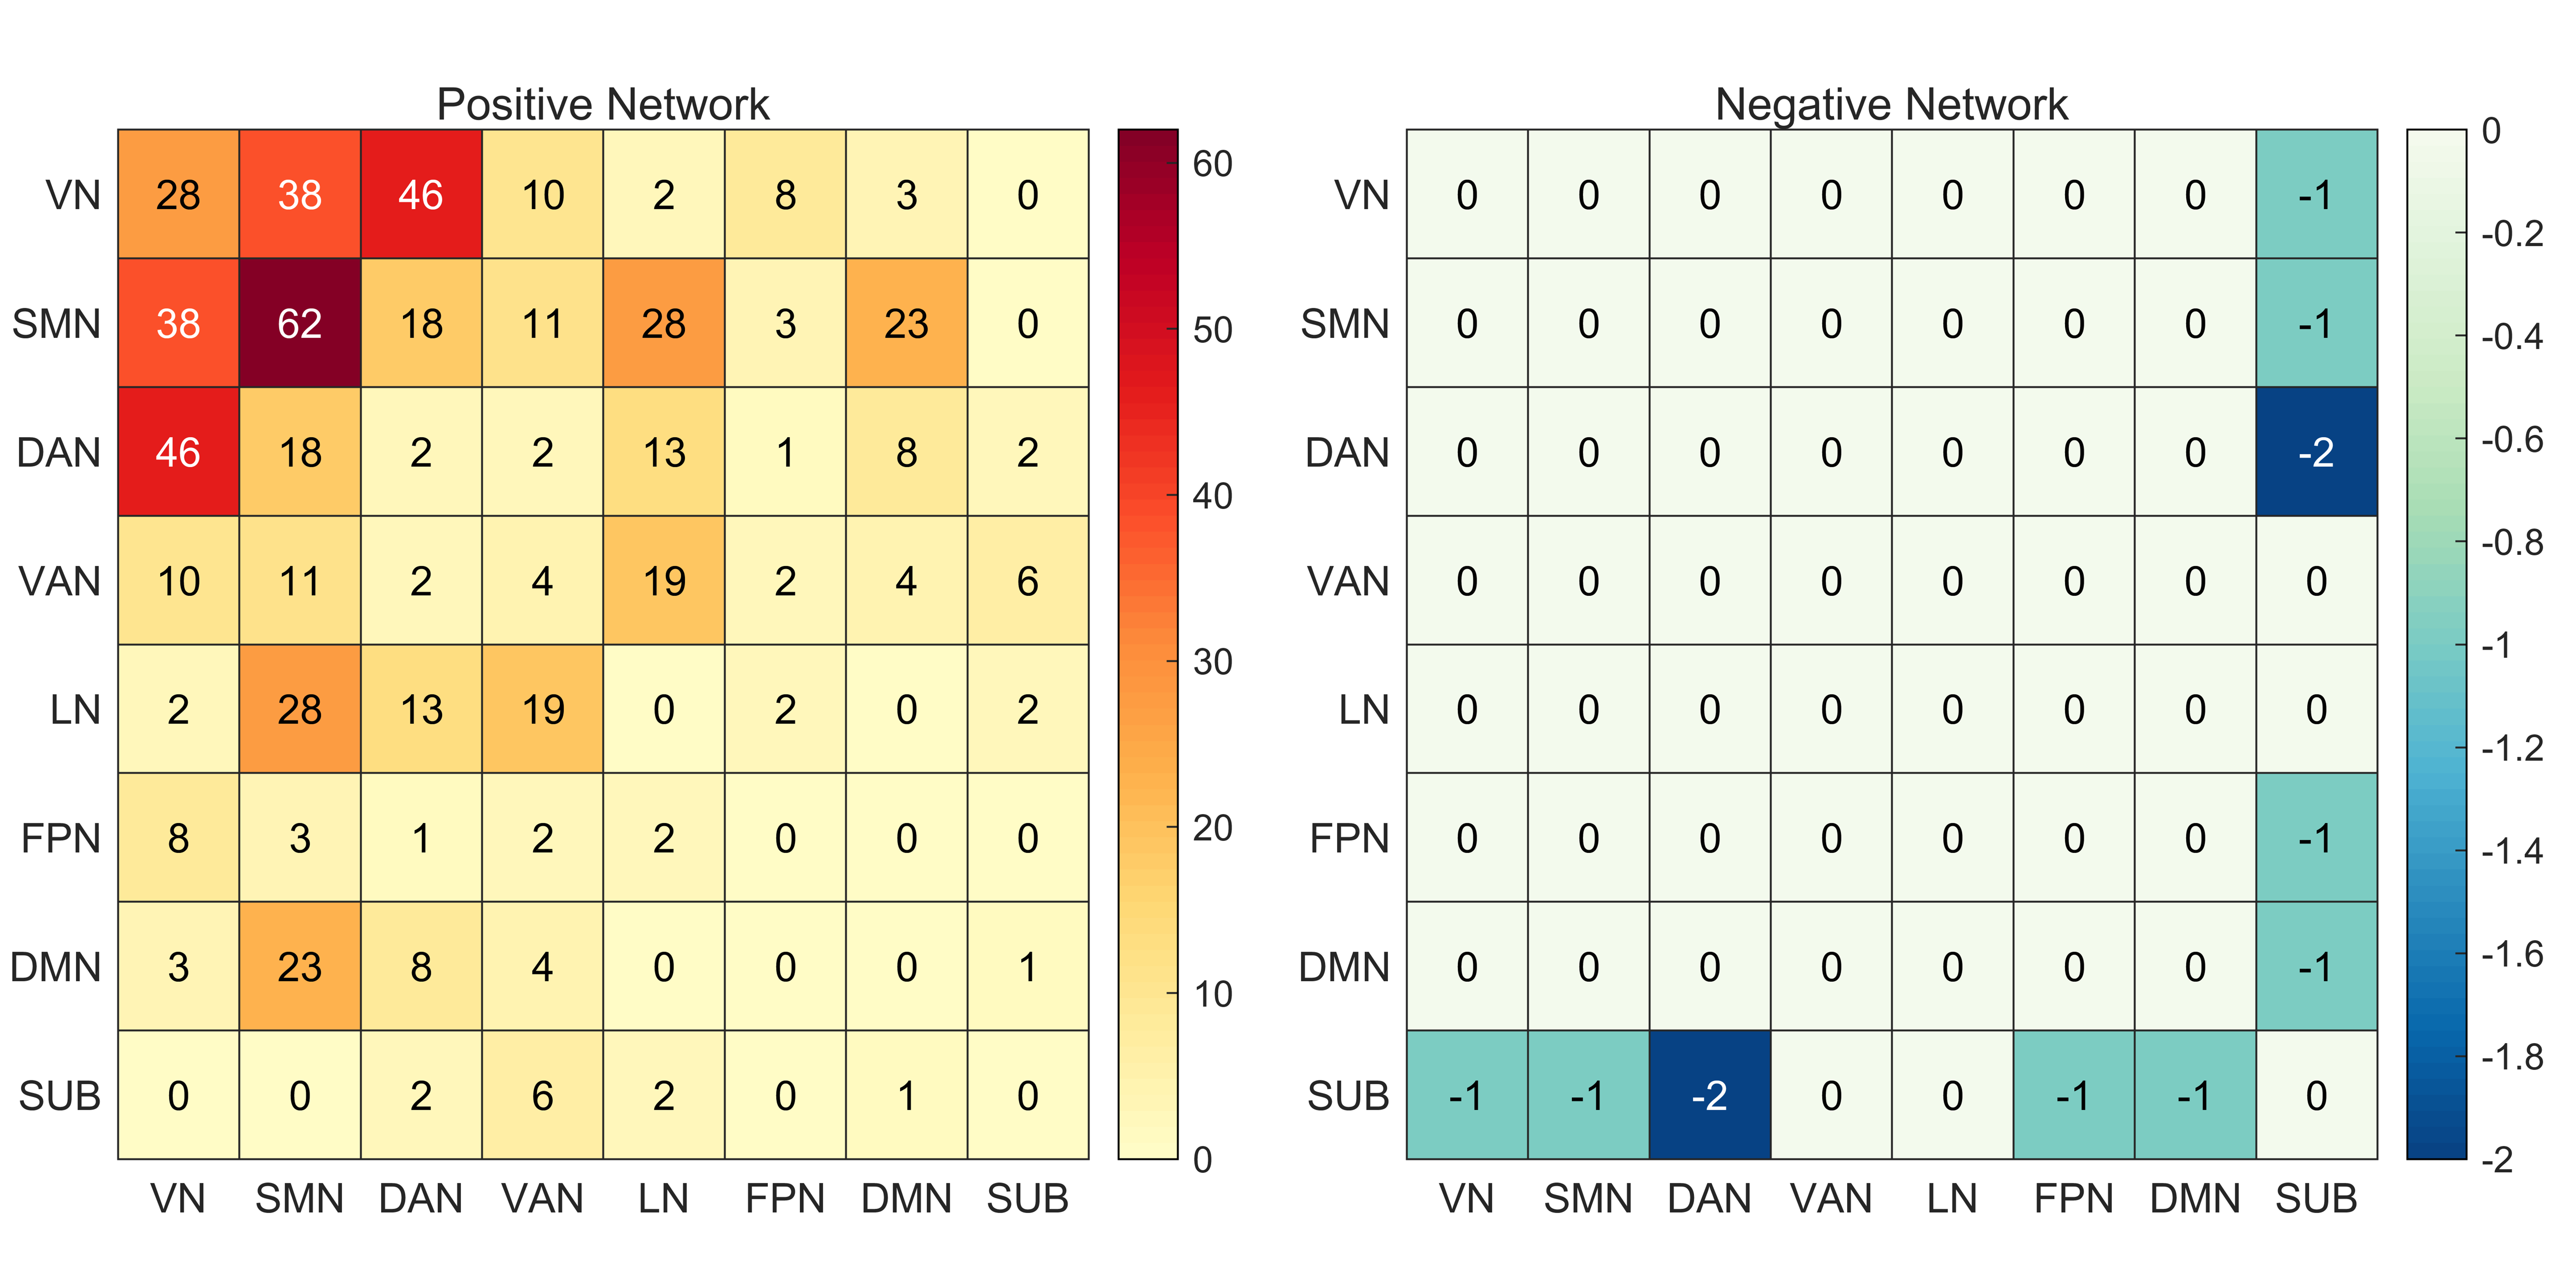
CPM predicted global cognition as indicated by a significant correlation between predicted and actual MoCA values (r=0.501, Pperm=0.0002, MAE=1.544). The connectivity edge predictive of global cognition was identified within and between networks implicated in sensorimotor, attention and visual perception. The identified model in training set was generalized to predict global cognition in independent testing set 1 (r=0.508, Pperm=0.0002, MAE=2.014) and testing set 2 (r=0.311, Pperm=0.014, MAE=4.478), suggesting the replicability of CPM approach. In addition, positive network strengths were significantly different between T2D with MCI and without MCI (P<0.01). The areas under the curves of the predicted values of the CPM model for diagnosing MCI were training set (AUC=0.974), testing set 1 (AUC=0.752), and testing set 2 (AUC=0.776). In treatment sample, the change value of the positive network strength of the subjects with improved cognition was significantly higher than those without cognitive improvement.Conclusion
These findings point to the feasibility of using the whole-brain functional connectome to predict global cognitive performance in T2D and provide evidence that individual differences in large-scale neural networks contribute to the diagnosis of cognitive impairment and cognitive improvement after treatment.Acknowledgements
No acknowledgement found.References
1. Shen X, Finn ES, Scheinost D, Rosenberg MD, Chun MM, Papademetris X, Constable RT. Using connectome-based predictive modeling to predict individual behavior from brain connectivity. Nat Protoc. 2017 Mar;12(3):506-518.
2. Yip SW, Scheinost D, Potenza MN, Carroll KM. Connectome-Based Prediction of Cocaine Abstinence. Am J Psychiatry. 2019 Feb 1;176(2):156-164.
Figures