4357
Neuromelanin Change in the Substantia nigra for Differentiating Multiple System Atrophy from Parkinson’s Disease1Radiology, Ruijin Hospital, Shanghai Jiao Tong University School of Medicine, Shanghai, China, 2Radiology, Wayne State University, Detroit,, MI, United States, 3Philips Healthcare, Shanghai, China, 4Faculty of Medical Imaging Technology, College of Health Science and Technology, Shanghai Jiao Tong University School of Medicine, Shanghai, China
Synopsis
Keywords: Parkinson's Disease, Neurodegeneration
Motivation: Multiple system atrophy (MSA) and Parkinson’s disease (PD) are sharing many common clinical presentations. The clinical diagnosis has been empirical due to a lack of a subjective imaging biomarker.
Goal(s): To investigate possible NM change in the SN and to better facilitate differential diagnosis.
Approach: 38 MSA , 38 PD patients and 38 HCs were scanned on a 3T MRI system. We calculated the relative contrast ratio (rCR) and NM volume of bilateral SN.
Results: HCs had higher rCR and NM volume than patients with PD and MSA (p<0.001). Of note, patients with MSA had lower NM volume than patients with PD (p<0.001).
Impact: Our finding suggests that NM degeneration and depigmentation of SN may be more severe in patients with MSA in comparison with PD. Hence, NM measures of the SN may provide promising insight into differentiating MSA and PD.
Introduction
Parkinson’s disease (PD) and multiple system atrophy (MSA) are devastating and deteriorating neurodegenerative diseases characterized by abnormal α-synuclein aggregation and propagation1. Many overlapping clinical manifestations between PD and MSA impose substantial challenges on clinicians to differentiate these two movement disorders. The substantia nigra (SN) has been histologically identified as the common site of subcortical neuronal loss in parkinsonian syndromes, including PD2 as well as atypical parkinsonism, including MSA3. The SN is a neuromelanin (NM)-rich structure located in the anterior part of the midbrain tegmentum, which is the main source of dopamine (DA) in the brain. Novel NM-MRI techniques and advanced process methods, such as artificial intelligence, might foster the development of NM-related biomarkers and hold promise to aid differential diagnosis in clinical research4. Ohtsuka et al investigated NM change in 30 PD and 10 MSA patients with a T1-weighted fast spin-echo technique and demonstrated a decreased contrast ratio of the SN in MSA and PD patients compared to healthy controls (HCs)5. Magnetization transfer contrast (MTC) imaging has also been used to visualize NM predominantly due to the suppression of surrounding tissues while leaving the NM otherwise visible6. The aim of this study was to investigate possible NM change in the SN and to better facilitate differential diagnosis between PD and MSA.Methods
Three age- and gender-matched groups: 38 MSA patients, 38 PD patients and 38 HCs were scanned on a 3T MRI system using a 3D multi-echo gradient recalled echo sequence with a magnetization transfer (MT) pulse. The imaging parameters were as follows: an in-plane resolution = 0.67 mm × 1 mm (interpolated to 0.67 mm × 0.67 mm), five echoes with TE1 = 7.5ms, ΔTE = 7.5ms, TR = 62ms, slice thickness = 1.34 mm and flip angle= 30°. Image processing and data collection were performed using SPIN software (SpinTech, Inc., Bingham Farms, Ml, USA). The regions of interest (ROIs) for the SN and bilateral adjacent grey matter (both left and right side) were automatically segmented with the help of a template-based mapping approach as reported in a previous study7. We calculated the relative contrast ratio (rCR) and NM volume to measure the tissue properties of the SN. The rCR of the SN compared to adjacent reference regions was defined as:rCR = ( SISN - SIref) / SIref *100%
where SISN is the mean signal intensity of the SN and SIref is the average value of the mean signal intensity of the bilateral reference regions. Intergroup difference analyses were performed using SPSS version 22.0 (IBM, Armonk, NY). Two tailed P-values<0.05 were considered to be of statistical significance.
Results
Table 1 shows the clinical and demographical characteristics of patients with MSA and age-, gender-matched PD and HCs. Compared with HCs, the signal intensity was visually decreased in patients with MSA and PD on MT magnitude images (Fig. 1). NM measurements of the SN for the three groups are summarized in Table 2. HCs had higher rCR and NM volume of both right and left SN than patients with PD (p<0.001) and MSA (p<0.001). Of note, patients with MSA had yet lower NM volume of both left and right SN than patients with PD (p<0.001) ( Fig. 2).Discussion and conclusion
In PD and MSA, our study confirmed that the SN signal intensity and NM volume were significantly reduced in comparison with HCs, which is in agreement with a series of NM-MRI imaging studies5,8. At the molecular point of view, α-synuclein inclusions and modifications in glial and neuronal cytoplasm are pathological characteristics of patients with MSA9. SN is one of the most vulnerable targets affected, which is associated with striatonigral degeneration in MSA. Also, α-synuclein, the major component of Lewy body disease, is attributed to PD pathogenesis and progression. Researchers evidenced the presence of Lewy body involvement in SN among MSA cases9. Of note, we found patients with MSA had significantly lower NM volume than patients with PD, suggesting that NM degeneration and depigmentation of SN may be more severe in patients with MSA in comparison with PD. However, Chougar et al reported no significant difference regarding to NM volume between MSA and PD8. Conflicting findings may be due to differences in imaging techniques and patient characteristics. Another neuroimaging study reported that mean midbrain volume of patients with MSA was significantly lower than that of HCs (p=0.03), while no significant difference was observed in PD and HCs10. This suggests that there might be more severe pathological involvement of midbrain structures in MSA. Hence, NM measures of the SN may provide promising insight into differentiating MSA and PD.Acknowledgements
No acknowledgement found
References
1. Krismer F, Wenning GK. Multiple system atrophy: insights into a rare and debilitating movement disorder. Nat Rev Neurol. Apr 2017;13(4):232-243.
2. Poewe W, Seppi K, Tanner CM, et al. Parkinson disease. Nat Rev Dis Primers. Mar 23 2017;3:17013.
3. Poewe W, Stankovic I, Halliday G, et al. Multiple system atrophy. Nat Rev Dis Primers. Aug 25 2022;8(1):56.
4. He N, Chen Y, LeWitt PA, Yan F, Haacke EM. Application of Neuromelanin MR Imaging in Parkinson Disease. Journal of magnetic resonance imaging : JMRI. Feb 2023;57(2):337-352.
5. Ohtsuka C, Sasaki M, Konno K, et al. Differentiation of early-stage parkinsonisms using neuromelanin-sensitive magnetic resonance imaging. Parkinsonism & related disorders. Jul 2014;20(7):755-760.
6. Liu Y, Li J, He N, et al. Optimizing neuromelanin contrast in the substantia nigra and locus coeruleus using a magnetization transfer contrast prepared 3D gradient recalled echo sequence. NeuroImage. Sep 2020;218:116935.
7. Jin Z, Wang Y, Jokar M, et al. Automatic detection of neuromelanin and iron in the midbrain nuclei using a magnetic resonance imaging-based brain template. Human brain mapping. Apr 15 2022;43(6):2011-2025.
8. Chougar L, Arsovic E, Gaurav R, et al. Regional Selectivity of Neuromelanin Changes in the Substantia Nigra in Atypical Parkinsonism. Movement disorders : official journal of the Movement Disorder Society. Jun 2022;37(6):1245-1255.
9. Ozawa T, Paviour D, Quinn NP, et al. The spectrum of pathological involvement of the striatonigral and olivopontocerebellar systems in multiple system atrophy: clinicopathological correlations. Brain : a journal of neurology. Dec 2004;127(Pt 12):2657-2671.
10. Paviour DC, Price SL, Jahanshahi M, Lees AJ, Fox NC. Regional brain volumes distinguish PSP, MSA-P, and PD: MRI-based clinico-radiological correlations. Movement disorders : official journal of the Movement Disorder Society. Jul 2006;21(7):989-996.
Figures
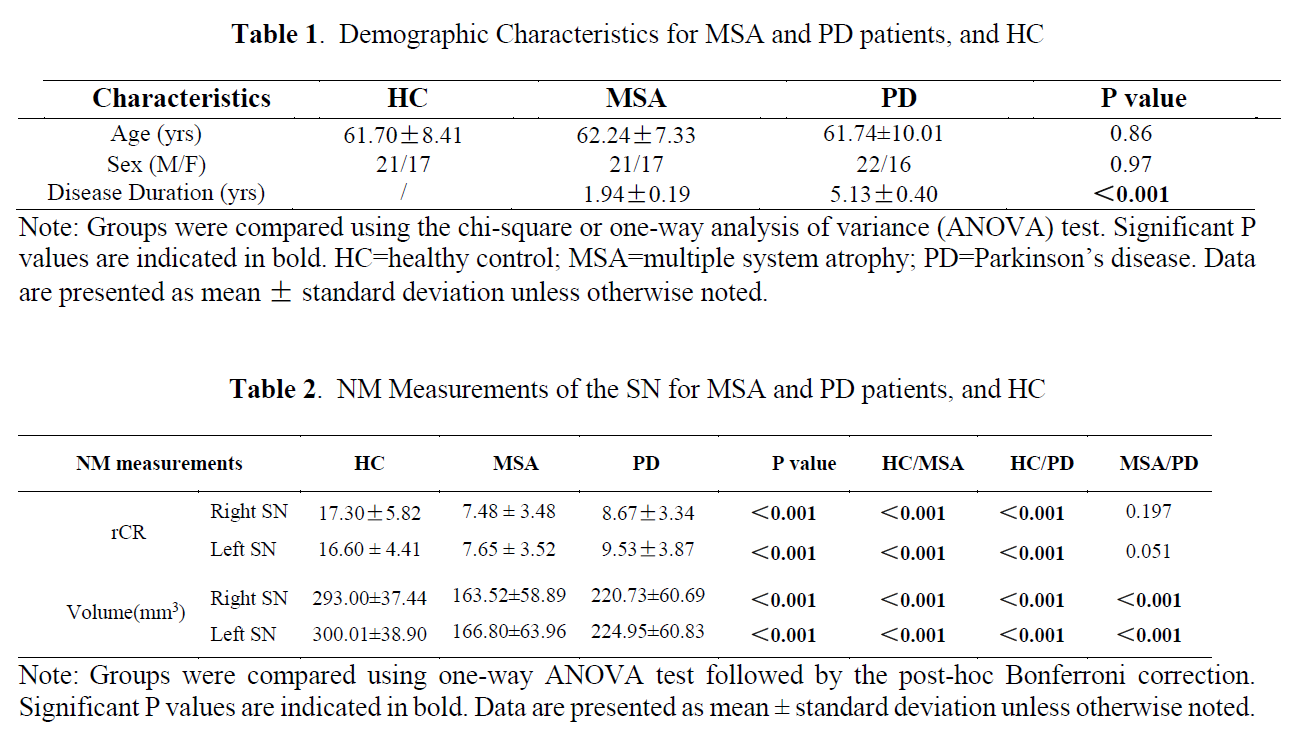
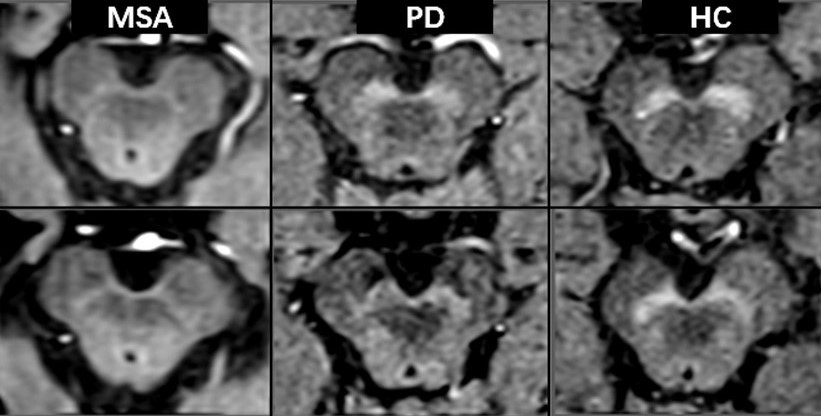
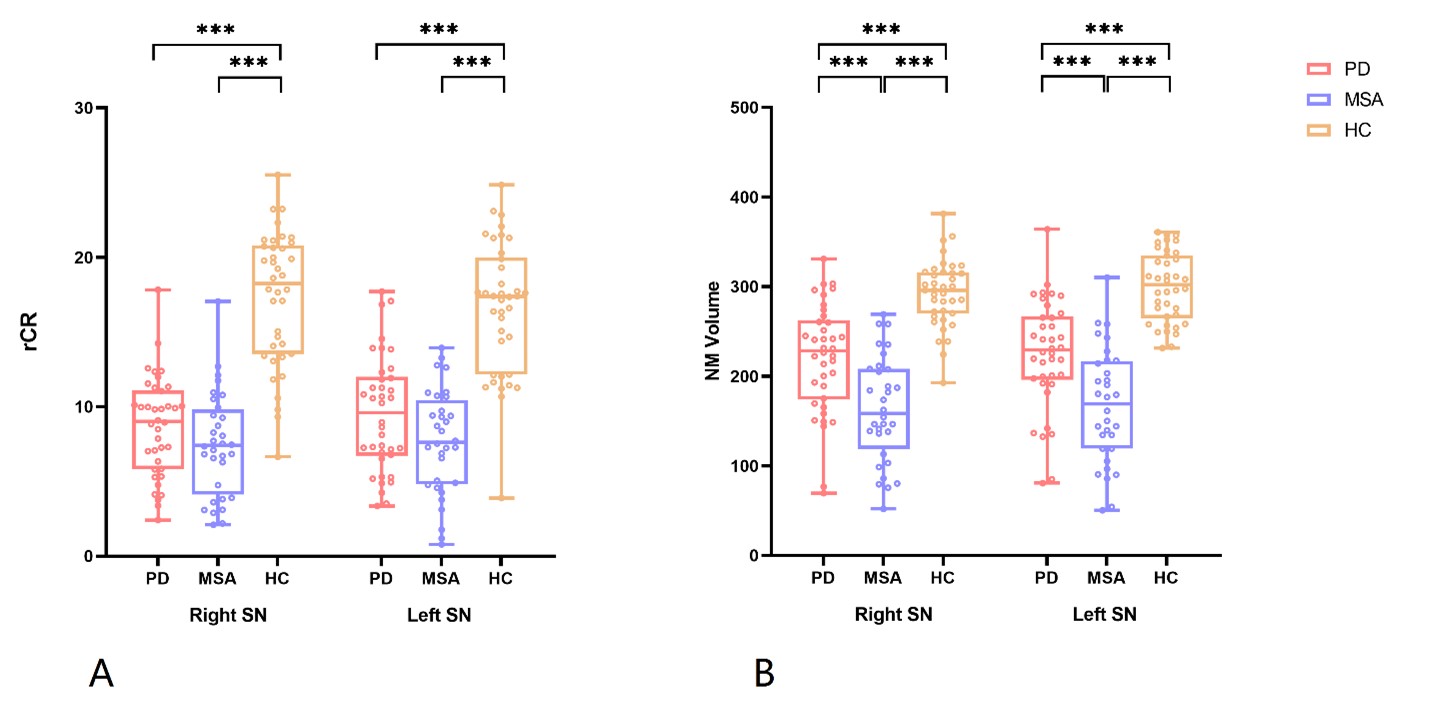
Fig. 2. NM-MRI measurements of the SN were assessed in patients with PD and MSA, and HCs. Relative contrast ratio (rCR) and NM volume of the bilateral SN were illustrated in A and B respectively. ***p<0.001