4356
MRI Correlates of 18F-AV133 in Parkinson's Disease1Center for Advanced Neuroimaging, University of California Riverside, Riverside, CA, United States, 2Department of Bioengineering, University of California Riverside, Riverside, CA, United States
Synopsis
Keywords: Parkinson's Disease, Parkinson's Disease, VMAT2, striatum, iron
Motivation: The limited availability and high cost of 18F-AV133 PET impedes its widespread adoption for use in diagnosis of Parkinson’s disease.
Goal(s): Our goal was to assess the relationship between 18F-AV133 PET and MRI imaging markers in Parkinson's disease.
Approach: Magnetization transfer and relaxometry imaging metrics derived in the basal ganglia of Parkinson's disease patients were compared to standardized uptake ratios from 18F-AV133 PET.
Results: Significant correlations were seen between 18F-AV133 PET and MRI imaging metrics. These results suggest that MRI is able to capture neurodegenerative processes in Parkinson's disease.
Impact: Our demonstration of the relationship between 18F-AV133 PET and MRI imaging markers suggests MRI imaging markers may serve as a surrogate measure for the integrity of the nigrostriatal system in Parkinson's disease.
Introduction
Parkinson's disease (PD) is a neurodegenerative disorder characterized by the loss of dopaminergic neurons in the substantia nigra pars compacta (SNpc)1,2 and, subsequently, the loss of presynaptic dopaminergic terminals in the striatum. The function of presynaptic dopamine terminals can be assessed using positron emitted tomography (PET) ligands such as 18F-AV133, which is sensitive to vesicular monoamine transporter 2 (VMAT2).3 Several studies have demonstrated reduced VMAT2 in the striatum of PD patients relative to controls4-5 and, while 18F-AV133 metrics have successfully been used as in vivo PD diagnostic markers, limited availability and high cost impede its widespread adoption. These limitations may be overcome by an MRI-based imaging marker that detects neurodegenerative parkinsonism in individuals meeting the diagnostic criteria for PD.MRI can be used to image dopaminergic neurons in the SNpc with the application of incidental or explicit magnetization transfer (MT) effects.6-8 Incidental MT effects are generated by an interleaved multislice turbo spin echo acquisition7 and explicit MT effects can be generated by MT preparation8 or fat saturation pulses.7 Prior work implementing both approaches found reductions in nigral contrast or volume in PD relative to controls.9-12 However, the relationship between 18F-AV133 and MRI measures has not been established. Here, we examine the relationship between nigral and striatal MRI metrics and 18F-AV133 uptake in the striatum.
Methods
Data was obtained from the Parkinson’s Progression Markers Initiative (PPMI) database (www.ppmi-info.org/data). Criteria for enrollment in PPMI can be found at www.ppmi-info.org. Institutional IRB approved the study for each site and subjects gave written informed consent.To be included in the analysis, PD participants in the PPMI database must have the following scans at the baseline time point: 1) a magnetization transfer (MT) prepared gradient recalled echo (GRE) sequence or a dual echo turbo spin echo (TSE) sequence and 2) 18F-AV133 PET. A total of 19 subjects from the PPMI1 protocol (TSE) and 14 subjects from the PPMI2 protocol (MT-GRE) met these criteria. Demographic information from the two cohorts is summarized in Table 1. Imaging data were downloaded in July 2023.
18F-AV133 PET imaging was performed at each site according to standardized protocols. PET imaging data were analyzed with FSL and PET partial volume correction toolbox. A schematic of the 18F-AV133 processing pipeline is shown in Figure 1. The median standardized uptake value (SUV) in the occipital cortex was chosen as a reference and used to calculate mean SUV ratio (SUVR) in caudate and putamen regions of interest (ROIs).
T1-weighted structural images in the PPMI1 and PPMI2 cohorts were used for registration to common space. Dual TSE images were acquired in the PPMI1 protocol with the following parameters: TE1/TE2/TR=11/101/3270 ms, voxel size=0.9×0.9×3 mm3, fat saturation pulse, 48 slices. The first echo of the TSE acquisition was used to segment SNpc using the procedure outlined in Figure 1. A MT-prepared GRE (mean TE=4.12 ms, mean TR=4.78, voxel size=0.5×0.5×2 mm3) was used to generate MT effects in the PPMI2 cohort and a schematic of the processing pipeline is outlined in Figure 1.
R2 was calculated from the dual echo TSE acquisition using a custom script in MATLAB by fitting the signal to a monoexponential model. Standard space putamen and caudate ROIs were transformed to native space and mean R2 was measured in each ROI.
Results
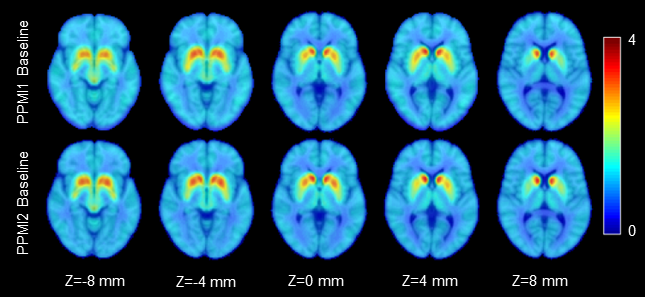
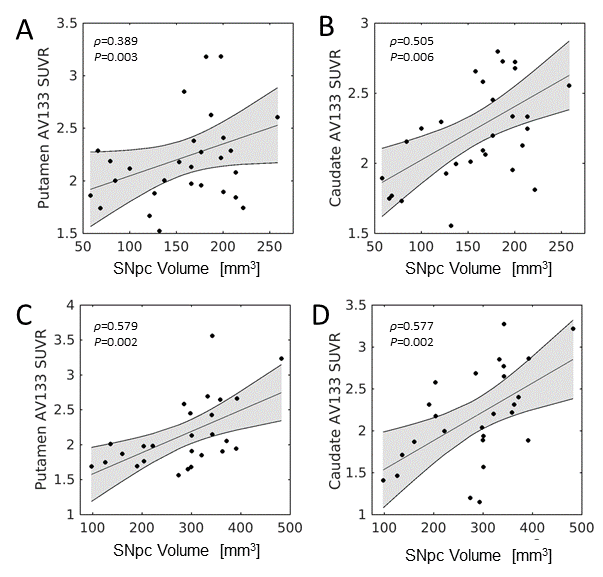
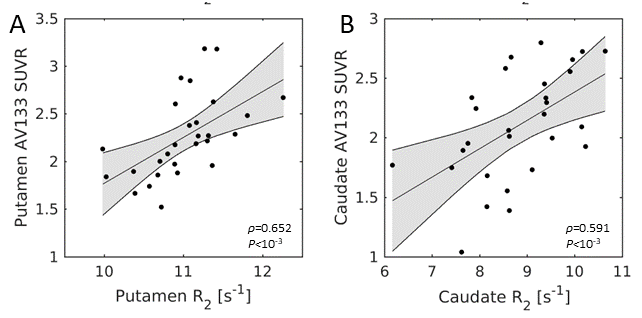
A comparison of 18F-AV133 SUVR in both cohorts is shown in Figure 2. Spearman’s rank correlation analysis yielded significant associations between nigral volume and putamen 18F-AV133 SUVR (PPMI1: ρ=0.389, P=0.003; PPMI2: ρ=0.579, P=0.002) cohorts and caudate 18F-AV133 SUVR (PPMI1: ρ=0.505, P=0.006; PPMI2: ρ=0.577, P=0.002) in both cohorts with higher nigral volume associated with higher 18F-AV133 SUVR. These correlations are shown in Figure 3. In the PPMI1 cohort, striatal R2 was correlated with 18F-AV133 SUVR (putamen: ρ=0.652, P<10-3; caudate nucleus: ρ=0.591, P<10-3). These associations are shown in Figure 4.Discussion
Earlier studies using single photon positron emitted computed tomography (SPECT) to image dopamine transporter (DaTScan) found higher striatal DaTScan binding ratios were associated with larger nigral volumes.12-14 In agreement with these results, we found striatal 18F-AV133 uptake is related to nigral volume derived from scans with incidental and explicit MT effects with larger SNpc volumes correlated with higher 18F-AV133 SUVR. Taken together, these results suggest that nigral volumes derived using scans with MT effects may serve as a surrogate measure for the integrity of the nigrostriatal system in PD.Acknowledgements
PPMI – a public-private partnership – is funded by The Michael J. Fox Foundation for Parkinson’s Research and funding partners, including [list the full names of all of the PPMI funding partners found at https://www.ppmi-info.org/about-ppmi/who-we-are/study-sponsors].References
1. Braak, et al. Staging of brain pathology related to sporadic Parkinson's disease. Neurobiol Aging, 24:197-211.
2. Fearnley & Lees. Ageing and Parkinson’s disease: substantia nigra regional selectivity. Brain, 114:2283-2301.
3. Hall, et al. Decreased vesicular monoamine transporter 2 (VMAT2) and dopamine transporter (DAT) function in knockout mice affects aging of dopaminergic systems. Neuropharmacology, 76:146−155.
4. Beauchamp, et al. Reduced striatal vesicular monoamine transporter 2 in REM sleep behavior disorder: imaging prodromal parkinsonism. Scientific Reports, 10:17631.
5. Okamura, et al. In vivo measurement of vesicular monoamine transporter type 2 density in Parkinson disease with (18)F-AV-133. J Nucl Med, 51:223-8.
6. Sasaki, et al. Neuromelanin magnetic resonance imaging of locus ceruleus and substantia nigra in Parkinson's disease. Neuroreport. 17:1215-8.
7. Schwarz, et al. T1-Weighted MRI shows stage-dependent substantia nigra signal loss in Parkinson's disease. Movement Disorders. 26:1633–8.
8. Chen, et al. Simultaneous imaging of locus coeruleus and substantia nigra with a quantitative neuromelanin MRI approach. Magn Reson Imaging. 32:1301-6.
9. Ohtsuka, et al. Differentiation of early-stage parkinsonisms using neuromelanin-sensitive magnetic resonance imaging. Parkinsonism Relat. Disord. 20:755–760.
10. Castellanos, et al. Automated neuromelanin imaging as a diagnostic biomarker for Parkinson's Disease. Mov. Disord. 30:945–952.
11. Hwang, et al. In vivo detection of substantia nigra and locus coeruleus volume loss in Parkinson's disease using neuromelanin-sensitive MRI: Replication in two cohorts, PLoS One 18:e0282684.
12. Biondetti, et al. The spatiotemporal changes in dopamine, neuromelanin and iron characterizing Parkinson's disease, Brain 144:3114-3125.
13. Isaias, et al. Neuromelanin Imaging and Dopaminergic Loss in Parkinson's Disease. Front. Aging Neurosci. 8:196.
14. Okuzumi, et al. Neuromelanin or DaT-SPECT: which is the better marker for discriminating advanced Parkinson's disease. Euro. J. Neurol. 26:1408-1416.
Figures
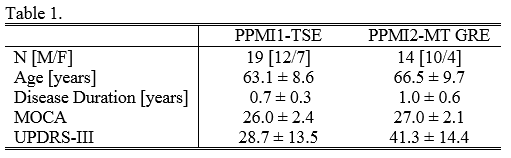
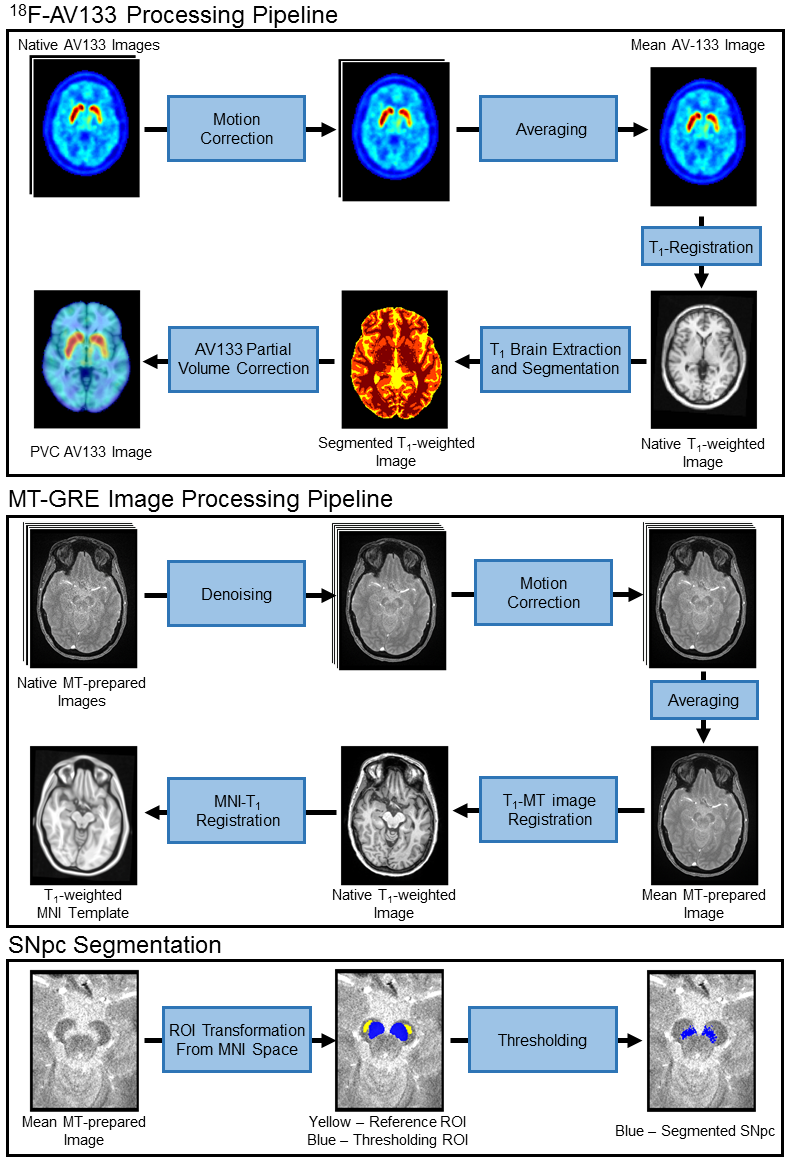
Figure 1. A schematic for the processing pipelines. AV133 images were motion corrected, averaged, and registered to the T1-weighted image. Grey matter, white matter, and CSF maps were segmented and used to correct partial volume effects.
MT-GRE images were denoised, motion corrected, and averaged. Next the mean MT-GRE image was registered to the T1-weighted image. SNpc was segmented similarly in both datasets. Standard space thresholding and reference ROIs were transformed into native space. Voxels in the thresholding ROI with intensity> μREF+3σREF were considered to be SNpc.