4355
Optimal deep brain stimulation sites pathways and networks for different Symptoms in Dystonia1Department of Radiology, Ruijin Hospital, Shanghai Jiao Tong University School of Medicine, Shanghai, China, 2Department of Neurology & Institute of Neurology, Ruijin Hospital, Shanghai Jiao Tong University School of Medicine, Shanghai, China, 3Department of Neurosurgery, Center for Functional Neurosurgery, Ruijin Hospital, Shanghai Jiao Tong University School of Medicine, Shanghai, China, 4Human Phenome Institute, Fudan University, Shanghai, China, 5Philips Healthcare, Shanghai, China, 6Faculty of Medical Imaging Technology, College of Health Science and Technology, Shanghai Jiao Tong University School of Medicine, Shanghai, China
Synopsis
Keywords: Parkinson's Disease, Neuroscience
Motivation: STN-targeted DBS shows promise in Dystonia treatment. However, optimal stimulation sites, pathway modulation, and network effects for different dystonia subtypes are unknown.
Goal(s): To examine stimulation sites, pathway modulation, and network effects in dystonia subtypes for personalized DBS interventions.
Approach: Retrospective study of 71 dystonia patients undergoing STN-DBS. Clinical outcomes assessed with Burke-Fahn-Marsden Dystonia Rating Scale. Imaging, tissue activation estimation, and pathway/network reconstruction performed using Lead-DBS and Iso2Mesh toolbox.
Results: Subtypes have varied stimulation sites. Orofacial group shows positive correlations between VTA-STN intersection and clinical improvement. Dorsolateral STN effective for orofacial and hindlimb symptoms. Targeting lenticular fasciculus benefits orofacial dystonia.
Impact: Study proposes a comprehensive model for personalized DBS, improving treatment strategies. Further research needed to validate targets, pathways, and networks, enhancing clinical decision-making and outcomes.
Purposes
Dystonia, a debilitating disorder, lacks adequate conservative treatment options. However, deep brain stimulation (DBS) targeting the subthalamic nucleus (STN) has shown efficacy in various isolated dystonia forms. Despite this, a comprehensive examination of optimal stimulation sites, potential pathway modulation, and network effects specific to different dystonia types (e.g., orofacial, forelimb, hindlimb) remains unexplored. This knowledge gap necessitates large-scale investigations to better understand the interplay between stimulation targets, neural pathways, and networks, thereby advancing our ability to tailor DBS interventions for improved treatment outcomes across diverse dystonia subtypes.Methods
Patients’ cohortIn this retrospective study, we assessed the clinical outcomes of STN-DBS in 71 dystonia patients. Patients were assessed using the Burke-Fahn-Marsden Dystonia Rating Scale (BFMDRS) preoperatively and postoperatively. The BFMDRS encompasses scoring of seven body regions, namely eye, mouth, speech, neck, right arm, left arm, trunk, right leg, and left leg. Patients presenting with symptoms in the eye, mouth, and speech regions were classified as the orofacial group (n=48, 47.9±3.6 years), those with symptoms in the neck, right arm, left arm, and trunk regions were classified as the forelimb group(n=49, 49.1±4.8 years), and those with symptoms in the right leg and left leg regions were classified as the hindlimb group(n=20, 46.2±5.1 years). Clinical improvement percentage was defined as the percentage change in individual symptom scores [(preoperative score-postoperative score) / preoperative score]×100%.
Pre-and postoperative Imaging
Prior to surgery, all patients underwent preoperative MRI and neuropsychological evaluations to exclude structural abnormalities and severe psychiatric comorbidities. Postoperative MRI or CT imaging was performed to confirm the accurate placement of the DBS electrodes. The preoperative imaging protocol included a 3D T1 MPRAGE sequence (TR=6.4ms, TE=1.9ms, TI=450ms, Flip angle=15°, voxel size=1x1x1 mm³) and a T2 FSE sequence (TR=3000ms, TE=128 ms, FA=90°, pixel size=0.75x0.75 mm², slice thickness=1.5mm, slices=150). The postoperative CT imaging parameters included a tube current of 360 mA, tube voltage of 140 KV, and a slice thickness of 2.5mm.
Volume of Tissue Activated Estimation
Volume of tissue activated (VTA) was constructed based on the surface meshes of DBS electrodes and subcortical nuclei using the Iso2Mesh toolbox (http://iso2mesh.sourceforge.net/) as included within Lead-DBS. Subcortical gray matter nuclei were defined by the DISTAL atlas. The normalized intersection between the VTA and the STN, STN-motor area summed over both hemispheres for each participant was calculated in Lead Group as outlined in detail by Horn et al[1].
Optimal stimulation sites, pathway, and network reconstruction
Utilizing Lead-DBS, DBS electrode localizations were determined, and subsequent electric fields (E-Fields) were estimated using a finite element methodology, accounting for the long-term stimulation parameters administered to each patient. The E-Field distributions were then spatially transformed into the MNI (Montreal Neurological Institute) space. By conducting voxel-wise rank correlation analyses between the magnitudes of the E-Field vectors and the corresponding clinical improvements, a map revealing positive associations was generated, denoted as optimal stimulation sites[2]. Moreover, we performed a comprehensive analysis of the stimulation effects by employing a detailed pathway model[3], aiming to elucidate the modulation of specific neural tracts that contribute to the observed clinical improvements. Additionally, we examined the impact of stimulation within the framework of the whole-brain structural connectome to reveal potential network-level effects[4].
Results
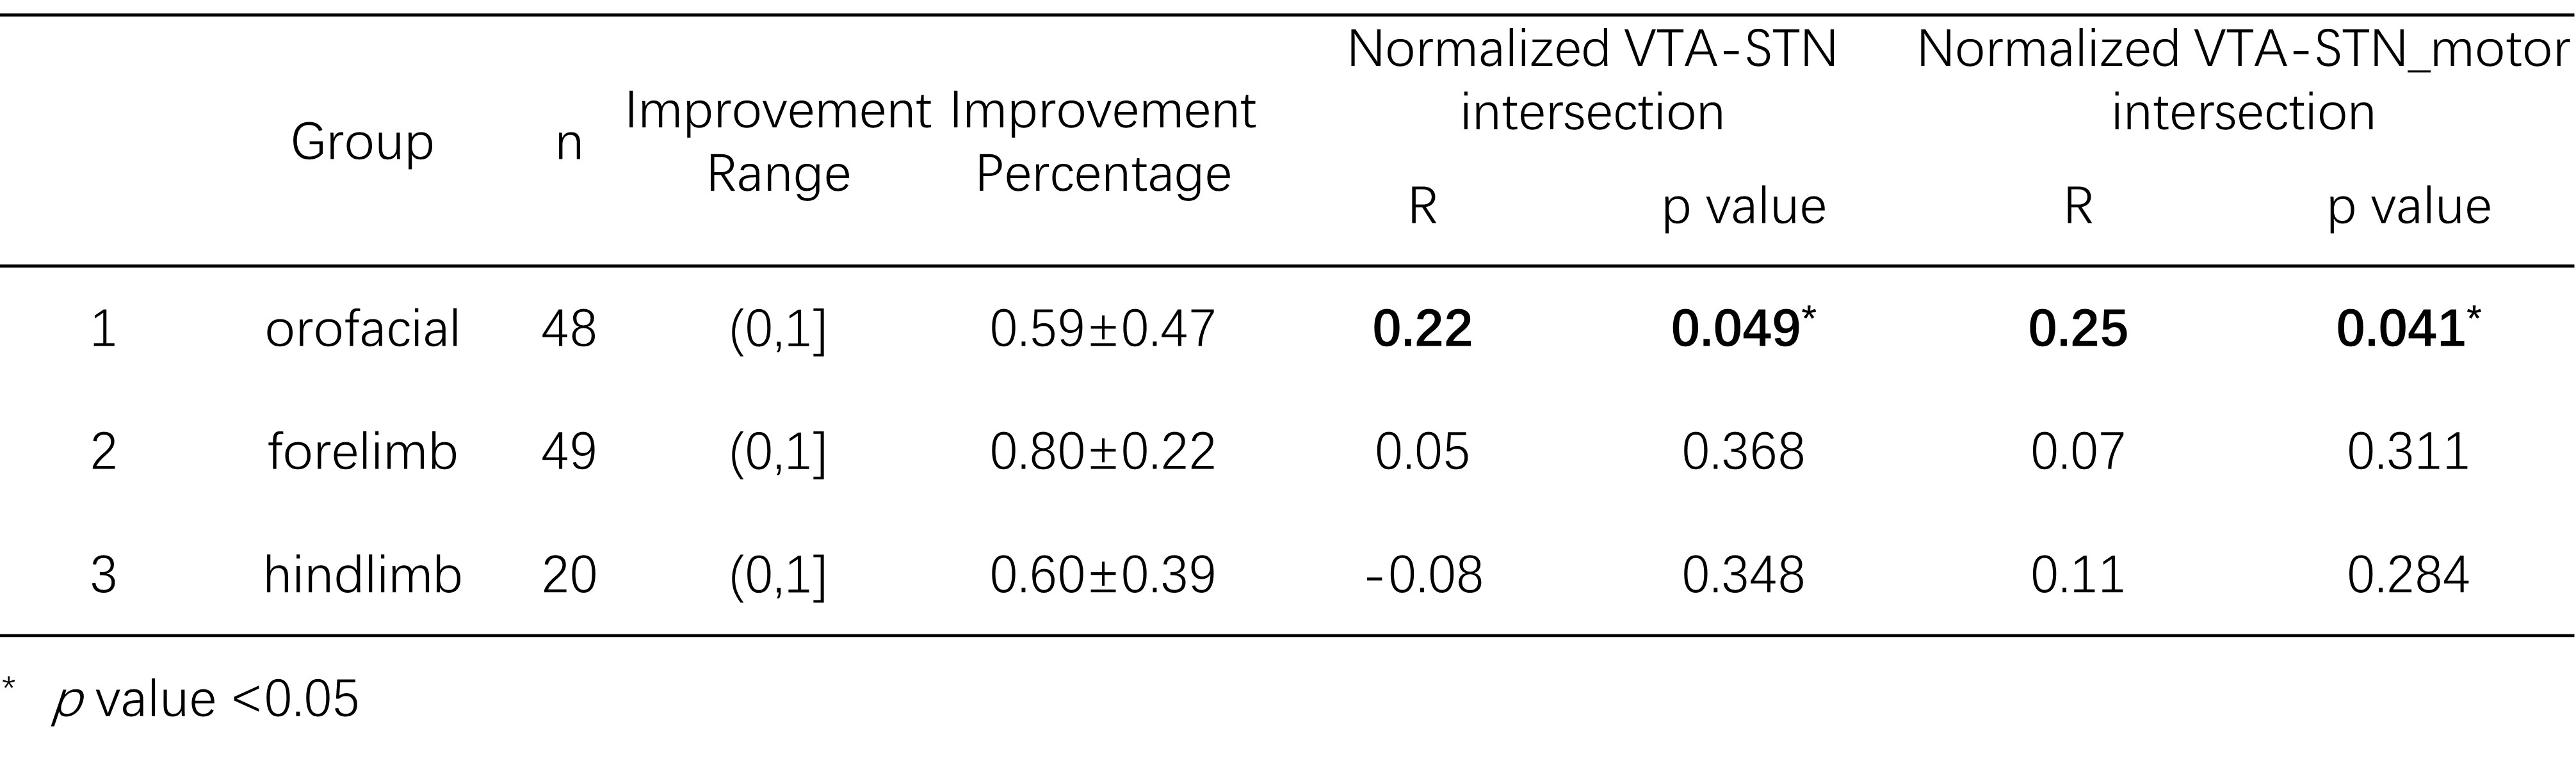
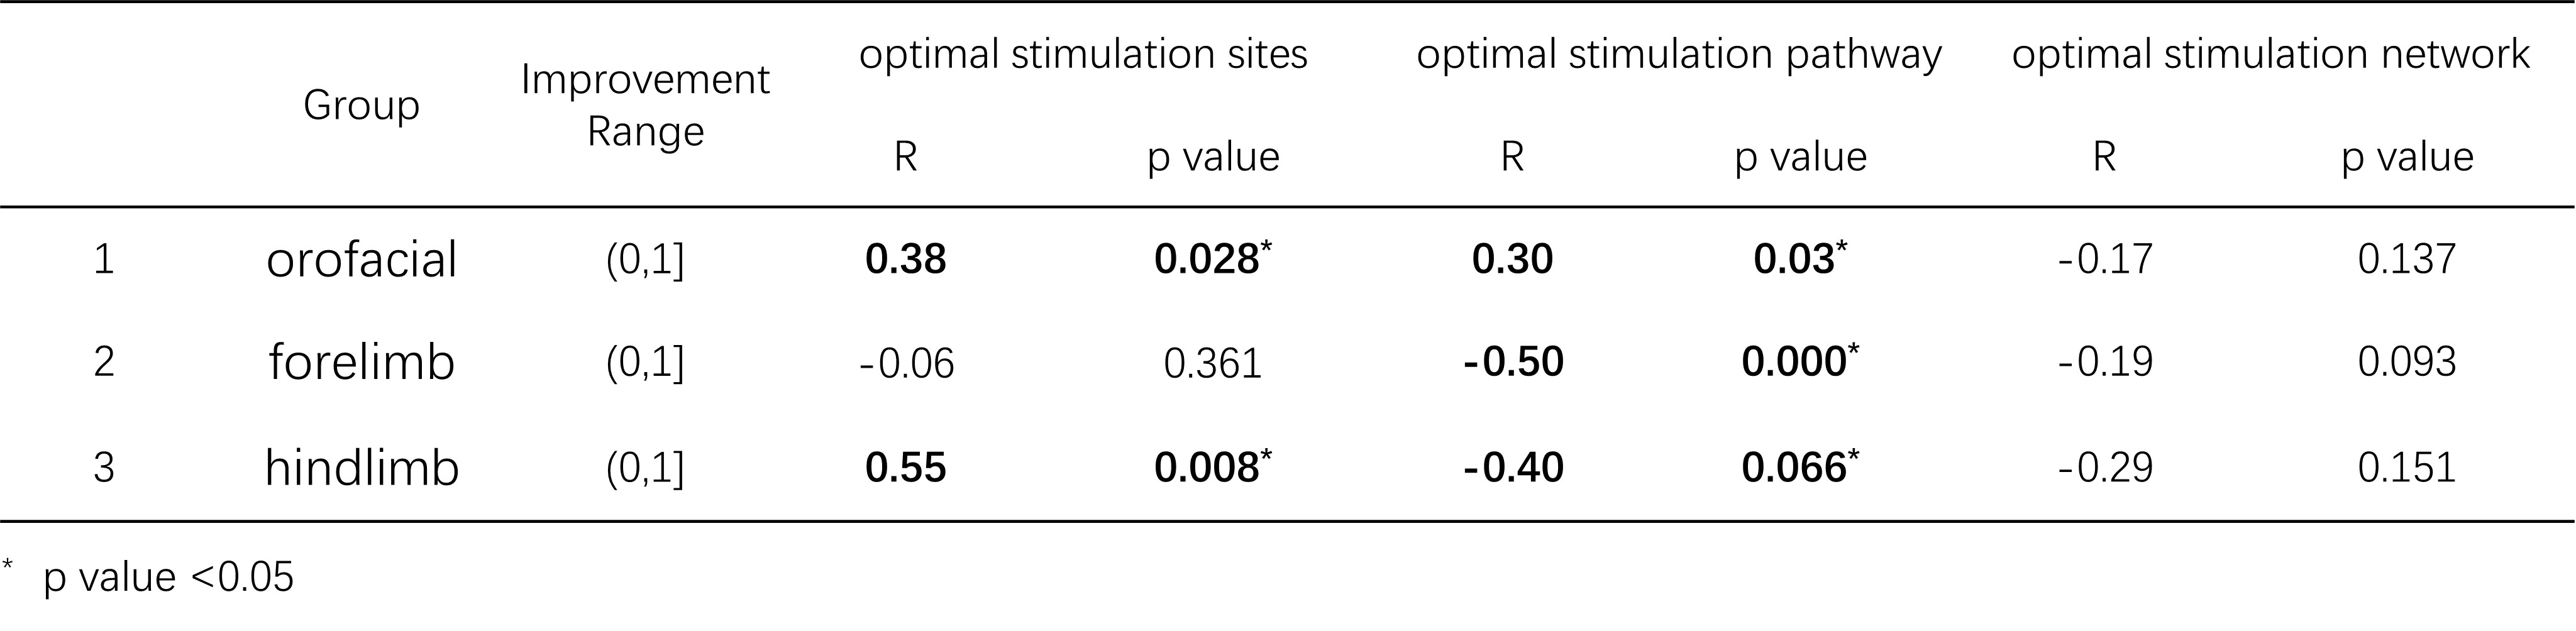
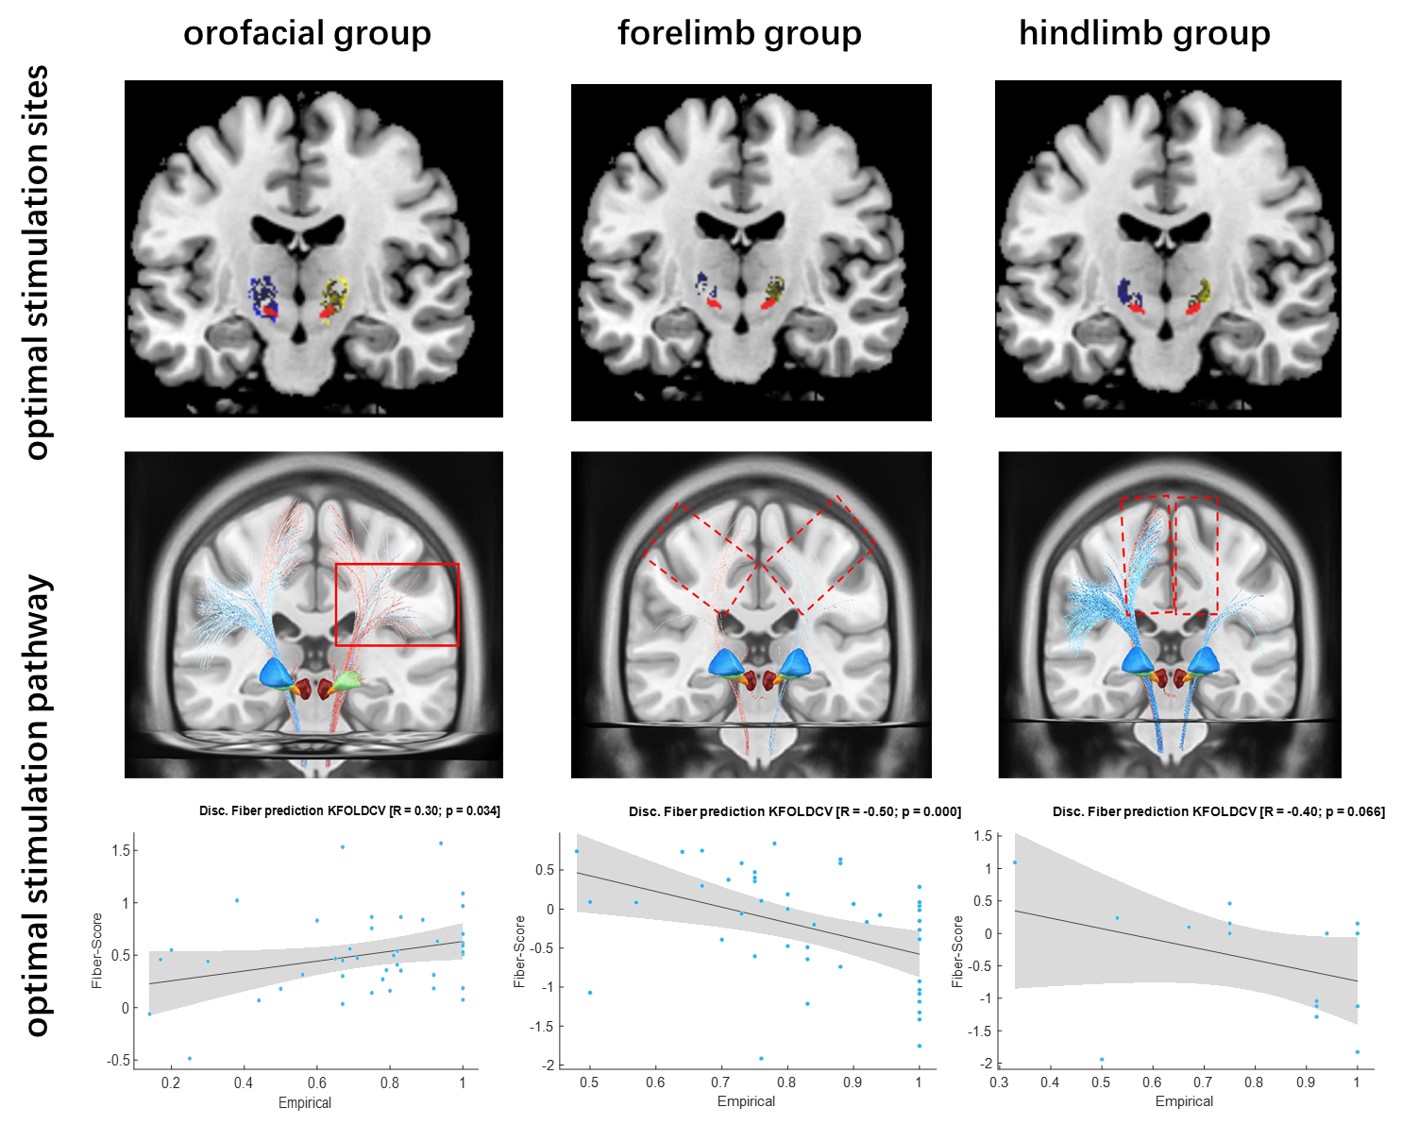
Our study demonstrates notable variations in the optimal stimulation sites among different subtypes of dystonia. Specifically, in the orofacial group, we observed a positive correlation between the normalized VTA-STN intersection and the clinical improvement percentage (R=0.22, p value=0.049), as well as between the normalized VTA-STN_motor intersection and the clinical improvement percentage (R=0.25, p value=0.041), as depicted in Table 1. However, neither the normalized VTA-STN intersection nor the VTA-STN_motor intersection exhibited a significant correlation with the clinical improvement percentage in the other two sub-cohorts. Furthermore, based on the findings presented in Table 2 and Figure 1, we specifically identified the dorsolateral region of the STN as the most effective stimulation sites for orofacial and hindlimb symptoms. Additionally, our results emphasize the potential therapeutic advantages of targeting the lenticular fasciculus in the treatment of orofacial dystonia. Unfortunately, we did not provide compelling evidence of a specific structural network associated with any sub-cohort symptoms.Discussion and Conclusions
The findings of our study propose a comprehensive multi-level model, which offers insights into the efficacy of treatment across various subtypes of dystonia. This model has the potential to serve as a valuable guide for DBS programming and surgical interventions, facilitating personalized and optimized therapeutic strategies. Understanding the intricate interplay between neural circuits and brain regions in dystonia will facilitate evidence-based clinical decision-making and enhance treatment outcomes for individuals with dystonia.Acknowledgements
This work was supported, in part, by the National Natural Science Foundation of China (grant number: 82271954, 81971576); Chinese National Science & Technology Pillar Program (grant number: 2022YFC2009900/2022YFC2009905) and the Innovative Research Team of High-level Local Universities in Shanghai.References
[1] Horn A, Kühn AA. Lead-DBS: A toolbox for deep brain stimulation electrode localizations and visualizations. Neuroimage 2015;107:127–35.
[2]Astrom M, Diczfalusy E, Martens H, Wardell K. Relationship between neural activation and electric field distribution during deep brain stimulation. IEEE Trans Biomed Eng 2015;62(2):664-672.
[3] Petersen MV, Mlakar J, Haber SN, Parent M, Smith Y, Strick PL, et al. Holographic Reconstruction of Axonal Pathways in the Human Brain. Neuron 2019;104(6):1056-1064.
[4]Horn A, Reich M, Vorwerk J, Li N, Wenzel G, Fang Q, et al. Connectivity Predicts deep brain stimulation outcome in Parkinson disease. Ann Neurol 2017;82(1):67–7.
Figures