4354
Abnormal brain perfusion pattern related to motor dysfunction and levodopa reactivity in Parkinson's disease1Department of Radiology, The Second Affiliated Hospital, Zhejiang University School of Medicine, Hangzhou, China, 2GE Healthcare, Shanghai, China
Synopsis
Keywords: Parkinson's Disease, Arterial spin labelling, Parkinson’s disease; PD-related perfusion pattern; levodopa reactivity
Motivation: A kind of perfusion biomarker capable of effectively distinguishing Parkinson's disease (PD) from normal subjects and reflecting motor dysfunction and levodopa reactivity is under research.
Goal(s): To construct a stable PD-related perfusion pattern based on arterial spin labelling (ASL), and to explore levodopa reactivity of motor symptoms with the pattern.
Approach: Principal component analysis and the scaled sub-profile model (PCA-SSM) was used to construct and validate PD-related perfusion pattern, with correlation and predictive analysis.
Results: The PD-related perfusion pattern was constructed to predict the severity of motor symptoms and assess levodopa reactivity in PD patients with axial symptom.
Impact: The PD-related perfusion pattern could serve as a potential biomarker for evaluating the severity of motor symptoms and the prognosis of levodopa therapy in PD patients with axial symptom.
Backgroud
Currently, a kind of perfusion biomarker capable of effectively distinguishing Parkinson's disease (PD) patients from normal subjects and reflecting motor dysfunction and levodopa reactivity is under research1-4.Purpose
Our goal is to develop a stable PD-related perfusion pattern based on arterial spin labelling (ASL), allowing us to assess the severity of motor symptoms. We additionally conducted exploratory analyses on the relationship between PD-related perfusion pattern and the improvement of motor symptoms following levodopa (L-DOPA) treatment to explore its ability to predict L-DOPA reactivity.Material and methods
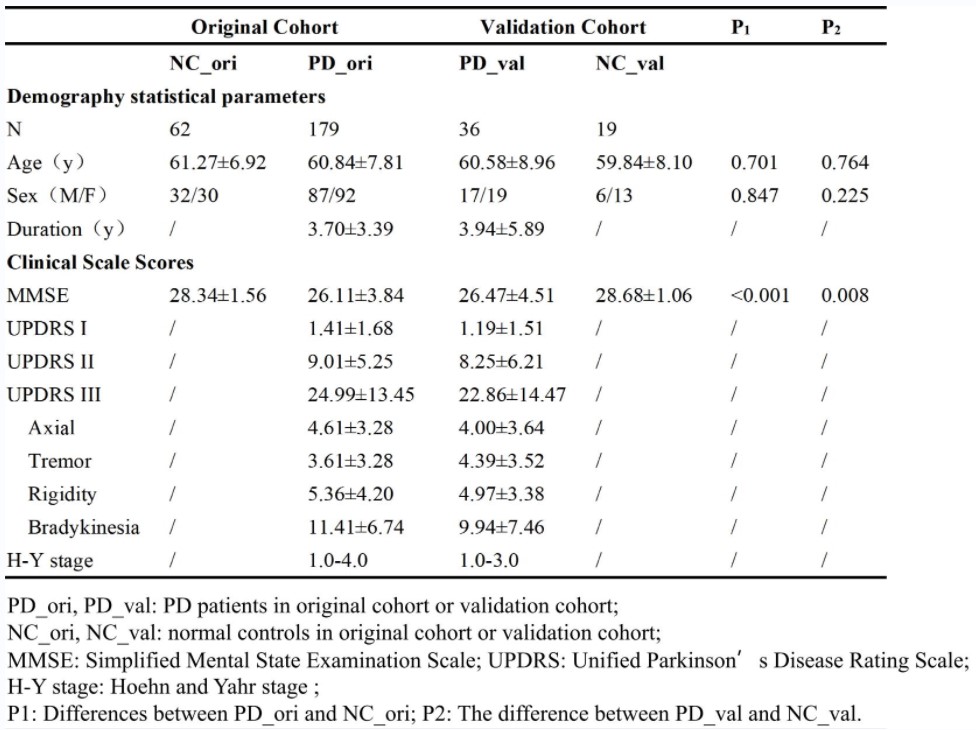
Two independent cohorts were recruited, comprising an original cohort consisting of 179 PD patients and 62 age- and gender-matched normal controls (NC) and a validation cohort included 36 PD patients and 19 NC. Principal component analysis and the scaled sub-profile model (PCA-SSM)5 was used to construct and validate PD-related perfusion pattern. We compared the clinical variables between PD and NC and utilized ASL technology to assessed the expression of the PD-related pattern in both cohorts. Pearson correlation and hierarchical multiple linear regression were applied to determine the PD-related perfusion pattern, exploring the relationship between the pattern and motor symptoms. In exploratory analysis, multivariate Cox regression and Kaplan-Meier survival analysis were further conducted in 54 PD patients with longitudinal clinical data about L-DOPA administration in the original cohort to predict the L-DOPA reactivity of motor symptoms.Results
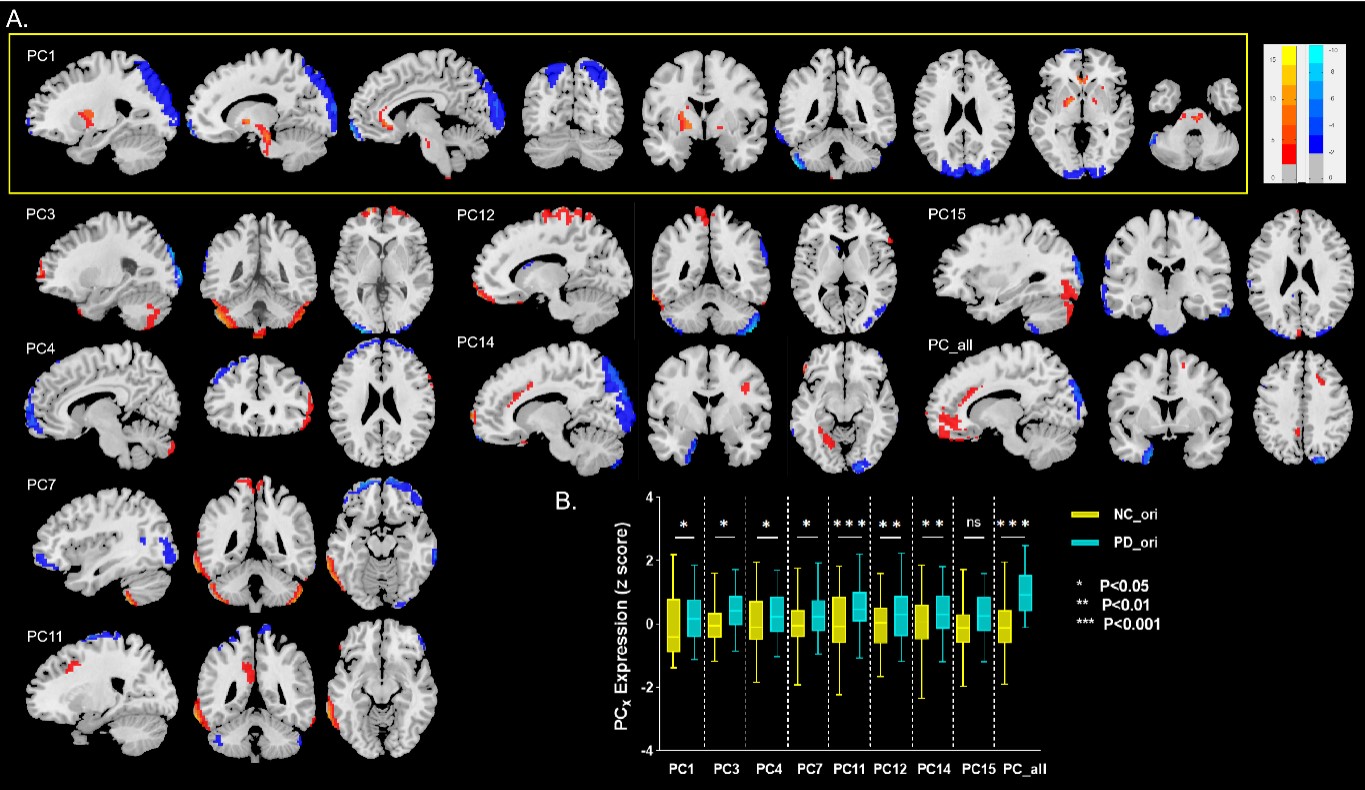
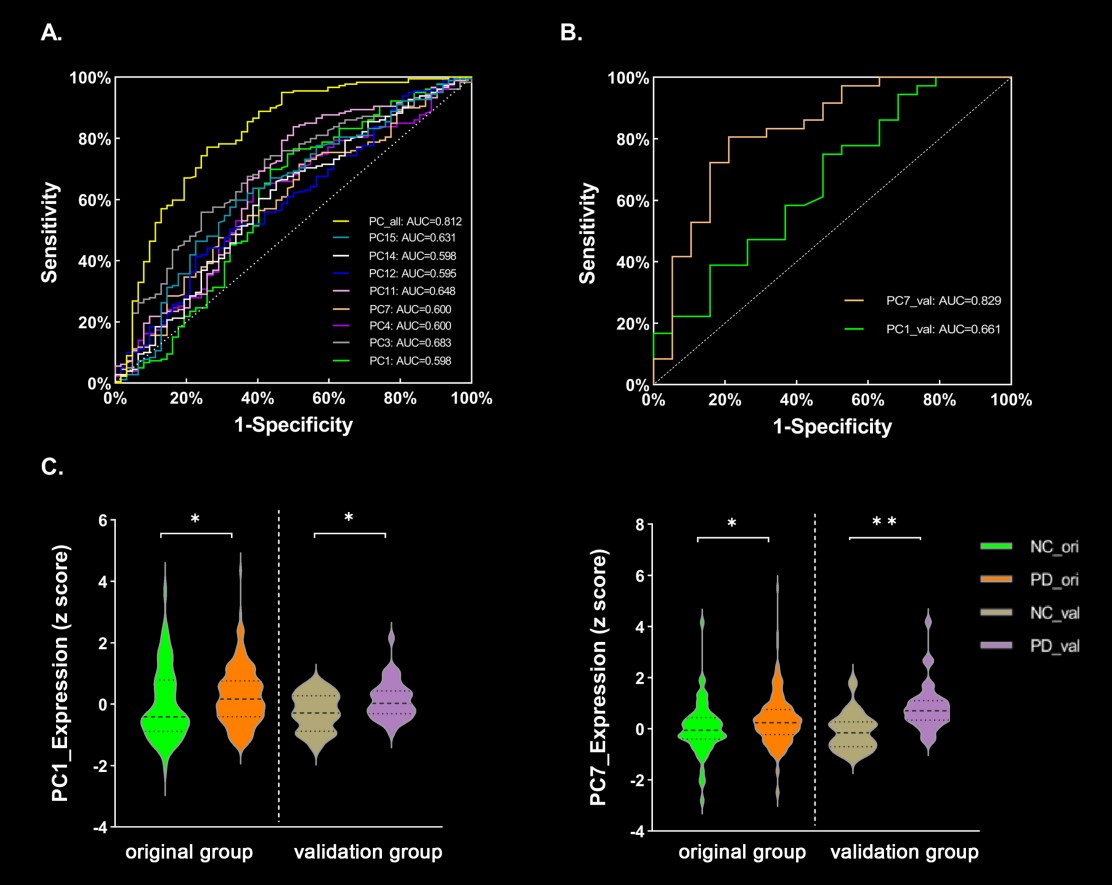
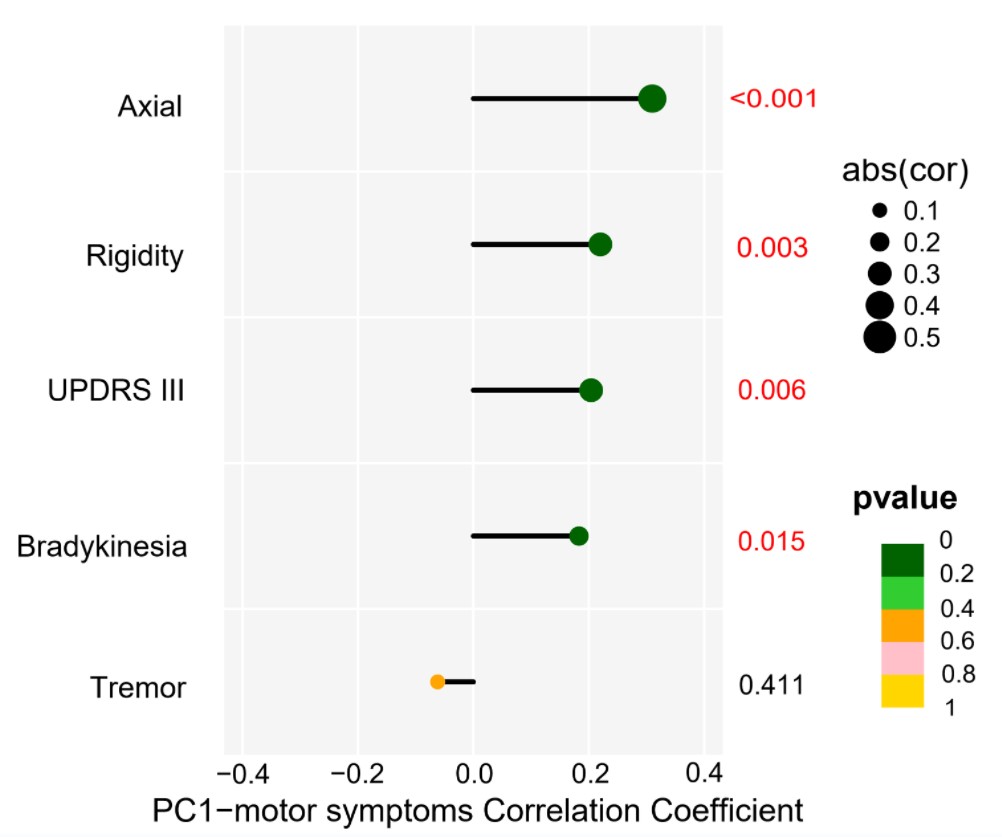
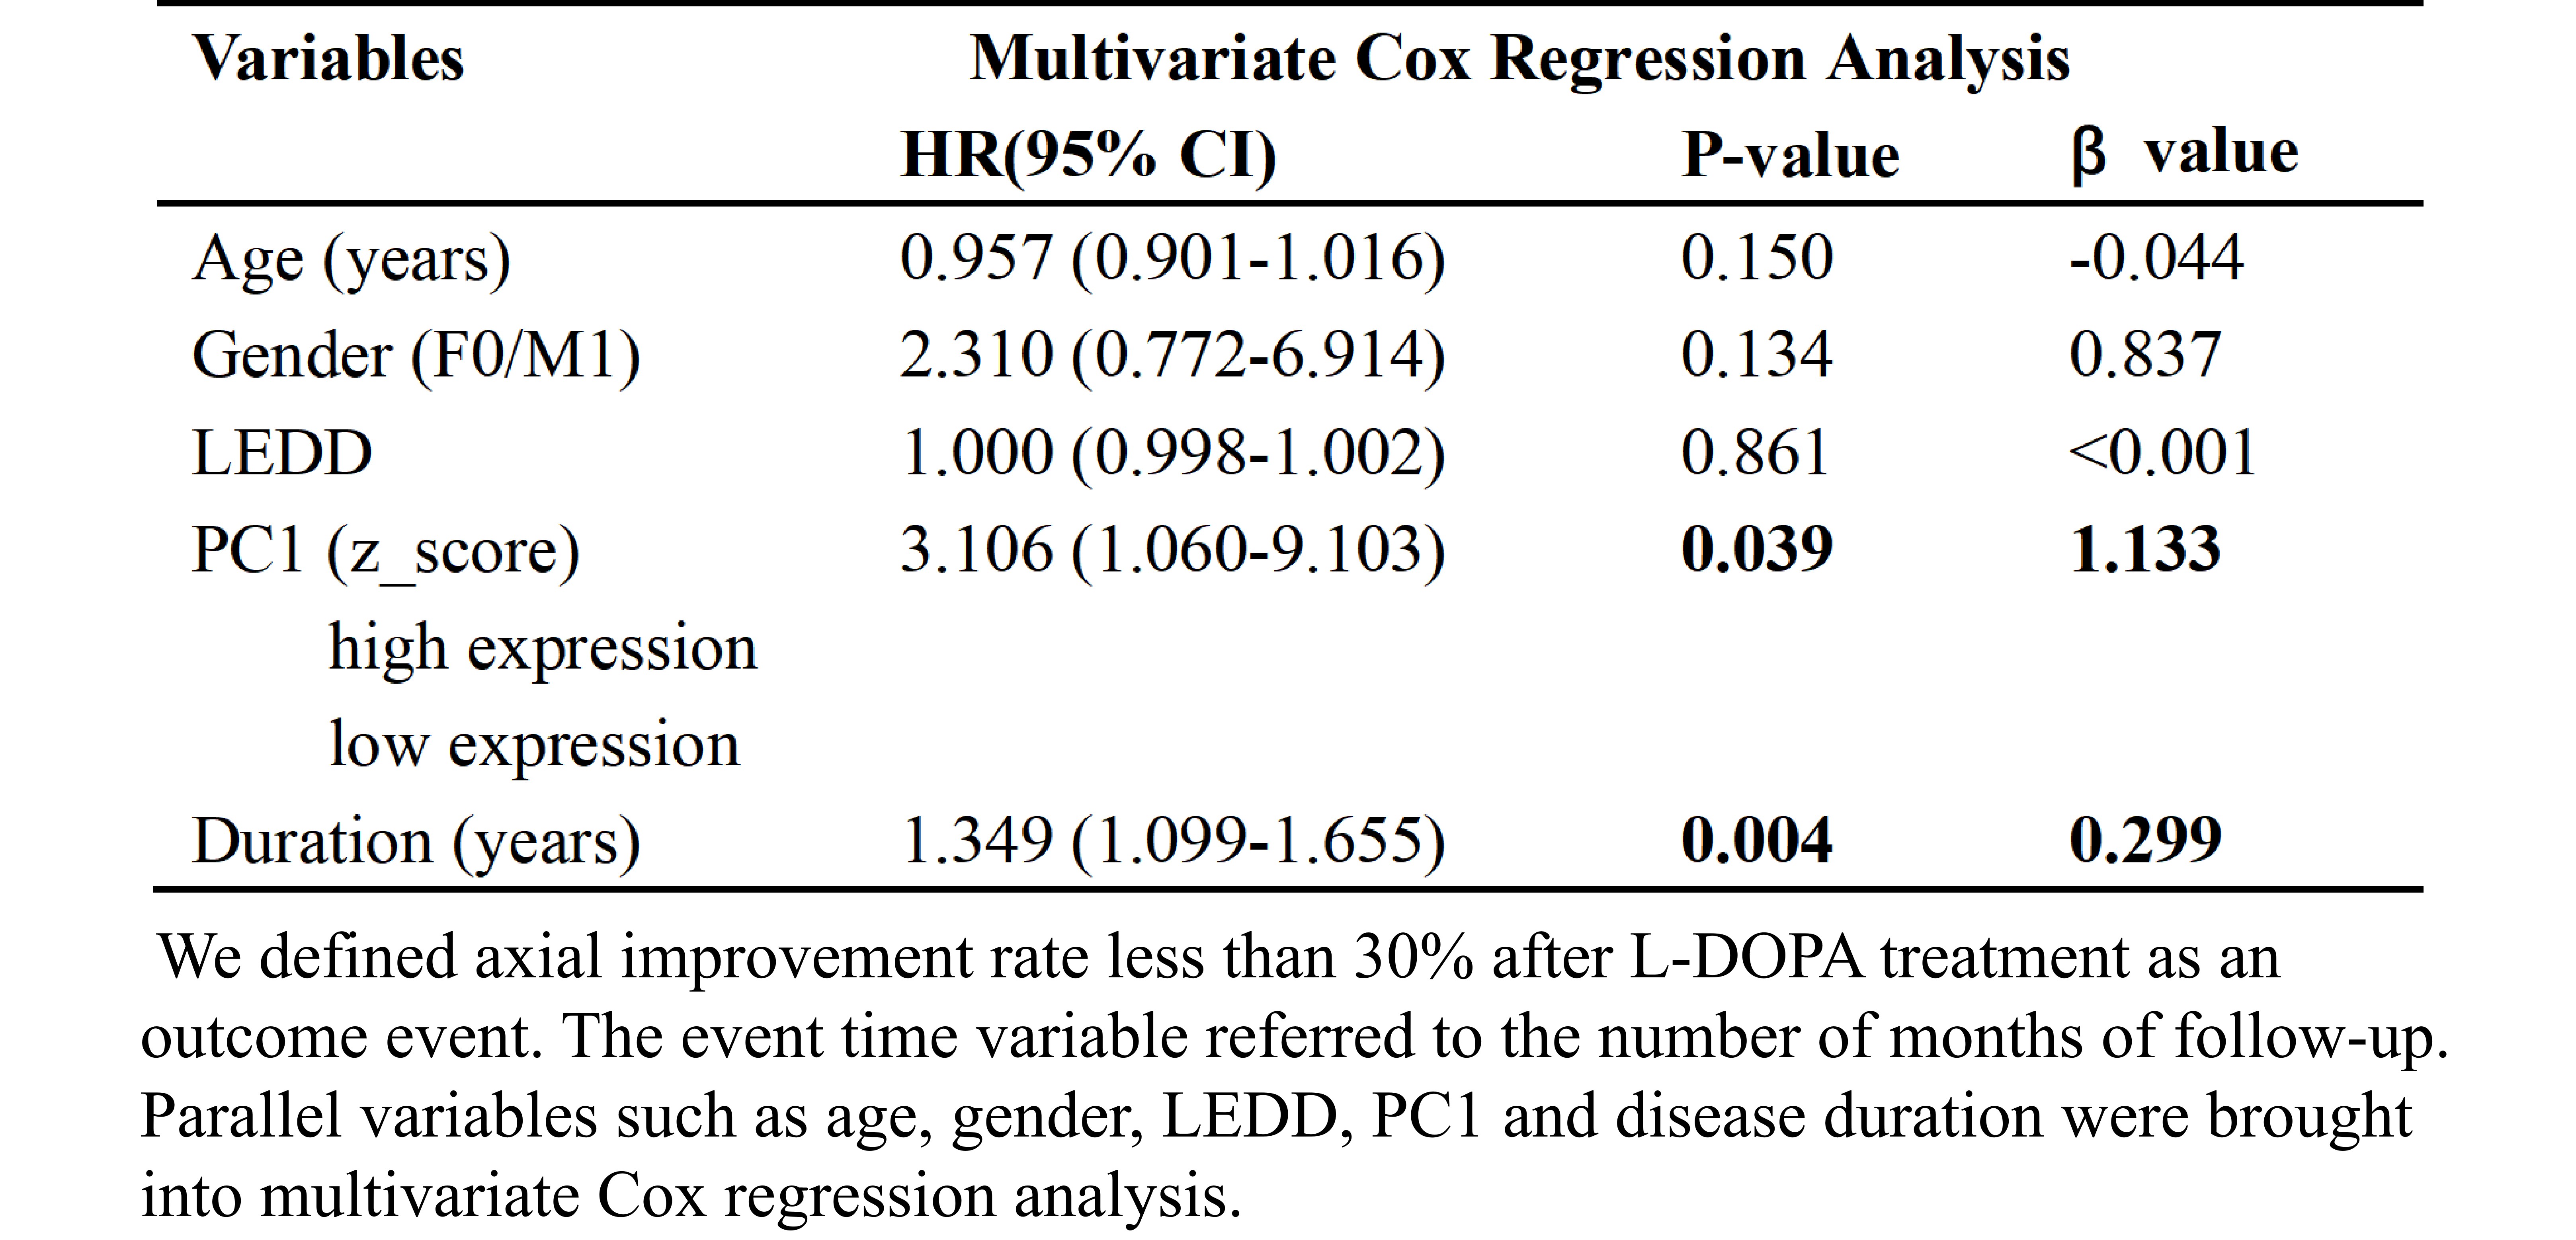
The primary principal component (PC1) at baseline in the OFF state was predominantly recognized as the PD-related perfusion pattern, with its expression being higher in PD subjects than in NC in both sets (original set: P = 0.017, validation set: P = 0.024, adjusted for gender and age) (Fig 1.-2.). The expression of the pattern was associated with UPDRS III (P = 0.006, r = 0.204) and its sub-symptoms, including axial (P < 0.001, r = 0.296), rigidity (P = 0.003, r = 0.220) and bradykinesia (P = 0.05, r = 0.183) symptoms, except for tremor symptom (P = 0.411, r = -0.062) at baseline (Fig 3.). During follow-up, we had obtained evidence indicating that baseline expression of the pattern was capable of predicting the severity of UPDRS III (P = 0.021). Exploratory research indicated that higher expression of the pattern was associated with a poorer L-DOPA reactivity for axial motor symptoms (P = 0.039; HR = 3.106, CI 1.060-9.103) (Table 2.).Conclusion
Our study identified the PD-related perfusion pattern, which served as a crucial biomarker for distinguishing PD from NC subjects, giving the results that the expression of the pattern at baseline could predict the severity of motor symptoms. Moreover, the pattern might hold promise as a potential biomarker for assessing the prognosis of L-DOPA therapy in PD patients with axial symptom.Acknowledgements
We wish to thank all the participants including patients with Parkinson’s disease and normal volunteers. We also thank the assistance from Department of Neurology in the Second Affiliated Hospital of Zhejiang University School of Medicine.References
1. Eckert, T. et al. Abnormal metabolic networks in atypical parkinsonism. Mov Disord. 2008; 23, 727-33.
2. Huang, C. et al. Changes in network activity with the progression of Parkinson's disease. Brain. 2007; 130, 1834-46.
3. Ma, Y. et al. Parkinson's disease spatial covariance pattern: noninvasive quantification with perfusion MRI. J Cereb Blood Flow Metab. 2010; 30, 505-9.
4. Melzer, T.R. et al. Arterial spin labelling reveals an abnormal cerebral perfusion pattern in Parkinson's disease. Brain. 2011; 134, 845-55.
5. Jolliffe, I.T. & Cadima, J. Principal component analysis: a review and recent developments. Philos Trans A Math Phys Eng Sci. 2016; 374, 20150202.
Figures