4352
Locus Coeruleus Visualisation at 7T: Optimisation through Multi-Contrast Acquisition and Wavelet-Based Fusion1Wellcome Centre for Human Neuroimaging, Department of Imaging Neuroscience, UCL Queen Square Institute of Neurology, University College London, London, United Kingdom, 2Dementia Research Centre, Department of Neurodegenerative Disease, UCL Queen Square Institute of Neurology, University College London, London, United Kingdom, 3Department of Brain Repair and Rehabilitation, UCL Queen Square Institute of Neurology, University College London, London, United Kingdom
Synopsis
Keywords: Dementia, Multi-Contrast, Locus Coeruleus, Magnetisation transfer, Ultra-high field, Neurodegeneration
Motivation: Magnetisation transfer (MT) weighting has been used to visualise the Locus Coeruleus (LC) at 7T, but robust visualisation remains challenging due to its small size and complex contrast mechanisms.
Goal(s): Investigate how proton-density- (PD) and T1-weighting interact with MT-weighting and optimise an advanced post-processing pipeline for LC visualisation.
Approach: Multi-echo 3D gradient echo images were acquired with MT-weighting and either PD- or T1-weighting from two individuals, including scan-rescan acquisitions.
Results: MT-PD-weighting enhanced visualisation of the LC with respect to the surrounding tissue, whereas MT-T1-weighting enhanced contrast with respect to the nearby CSF. Combining these via wavelet-based fusion maximises these respective benefits.
Impact: Enhancing visualisation of the Locus Coeruleus with our proposed acquisition and processing technique will pave the way for neurologists and cognitive neuroscientists to understand the key role this structure plays in human cognition and neurodegeneration.
Introduction
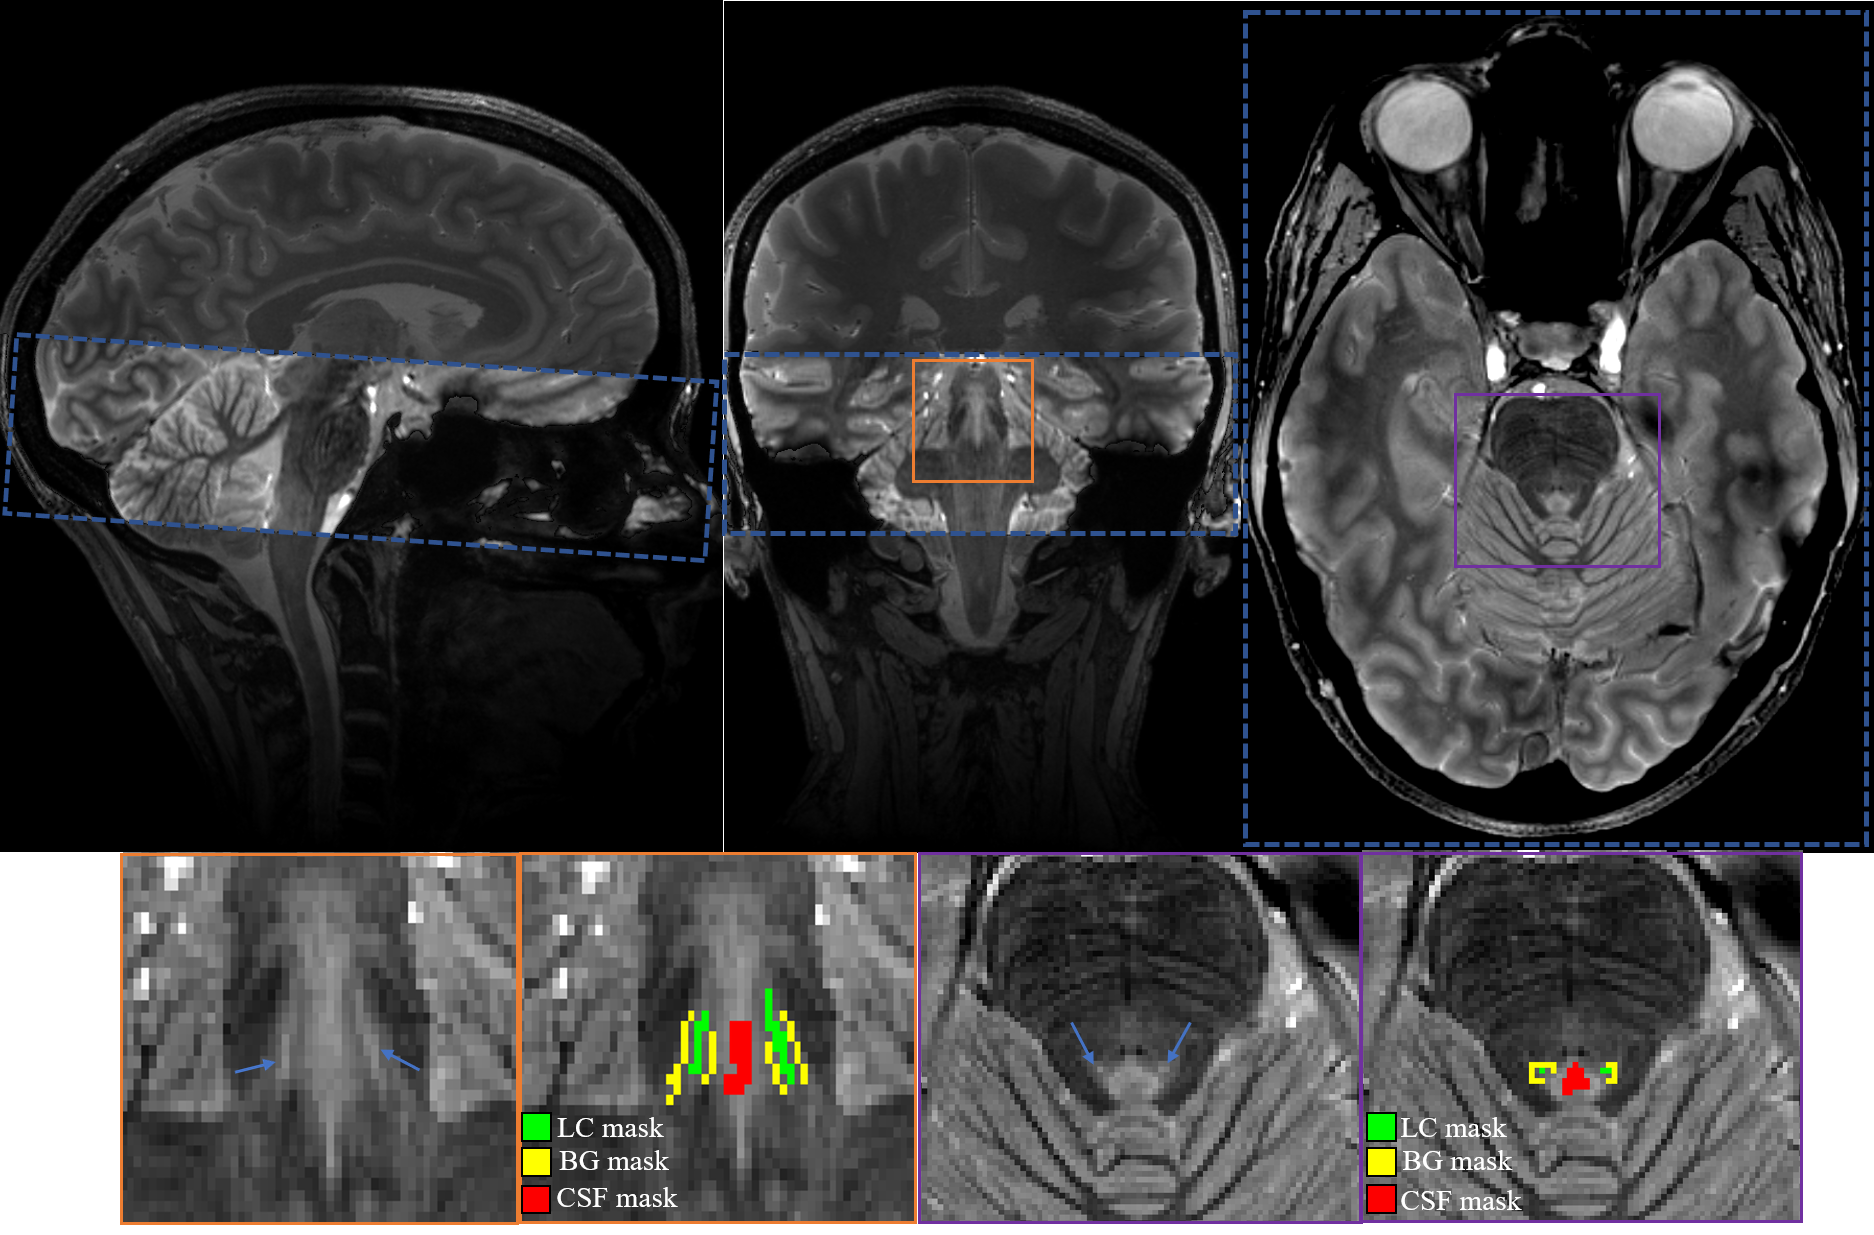
The Locus Coeruleus (LC), a small string-shaped nucleus deep in the pons, plays a crucial role in various cognitive processes, e.g. working memory, learning and attention1. Over the past decade, MRI has been employed to visualise the LC which has posed a significant challenge due to its small size (see Figure 1) and only partially understood contrast mechanisms2,3. A recent study confirmed a role for magnetisation transfer (MT) in generating contrast between the LC and surrounding tissue (LC-BG, i.e. contrast to background) at 7T4. However, given the LC’s proximity to the fourth-ventricle, visualisation of the LC is diminished when the signal level of the LC and cerebrospinal fluid (CSF) are similar, resulting in poor LC-CSF contrast5.Here, we investigated two MT-based gradient-echo acquisitions: one with a proton-density weighted readout (MT-PD) and the other with a T1-weighted readout (MT-T1). Our aim was to determine which was optimal for LC visualisation, or if the visualisation could be enhanced through their combination.
Material & Methods
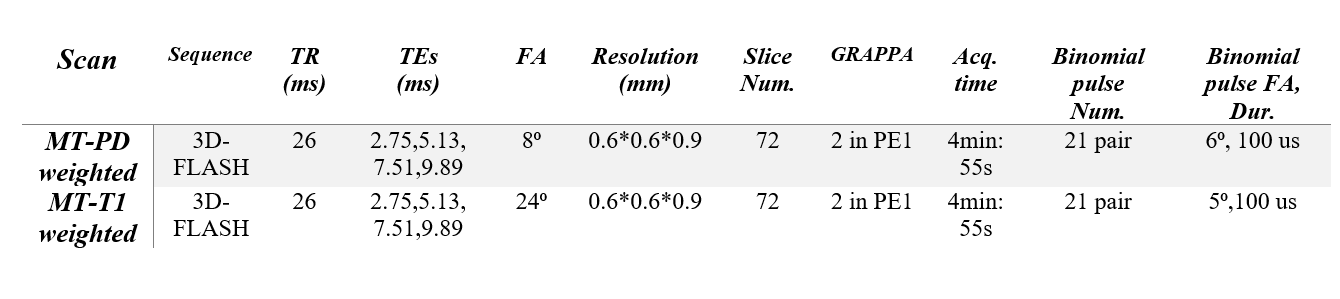
Pulse sequence: An MT module was integrated into a 3D multi-echo FLASH sequence before each excitation. This module comprises a binomial pulse-train with small flip angle (FA) to selectively saturate the macromolecules6 and a gradient to spoil any residual on-resonance excitation. See Table 1 for full details.Data acquisition: Three datasets were acquired: two from one healthy volunteer (scan-rescan), and one from another, using a 7T Siemens Terra with 8-trasmit and 32-receive channels. In the MT-PD and MT-T1 weighted acquisitions, 4 echoes were acquired with an excitation flip angle (FA) of 8° and 24° respectively. Due to the higher FA in the MT-T1 weighted protocol, the FA of the binomial pulse-train was reduced to remain within SAR limits. Each weighting was acquired twice per session. See Table 1 for full details.
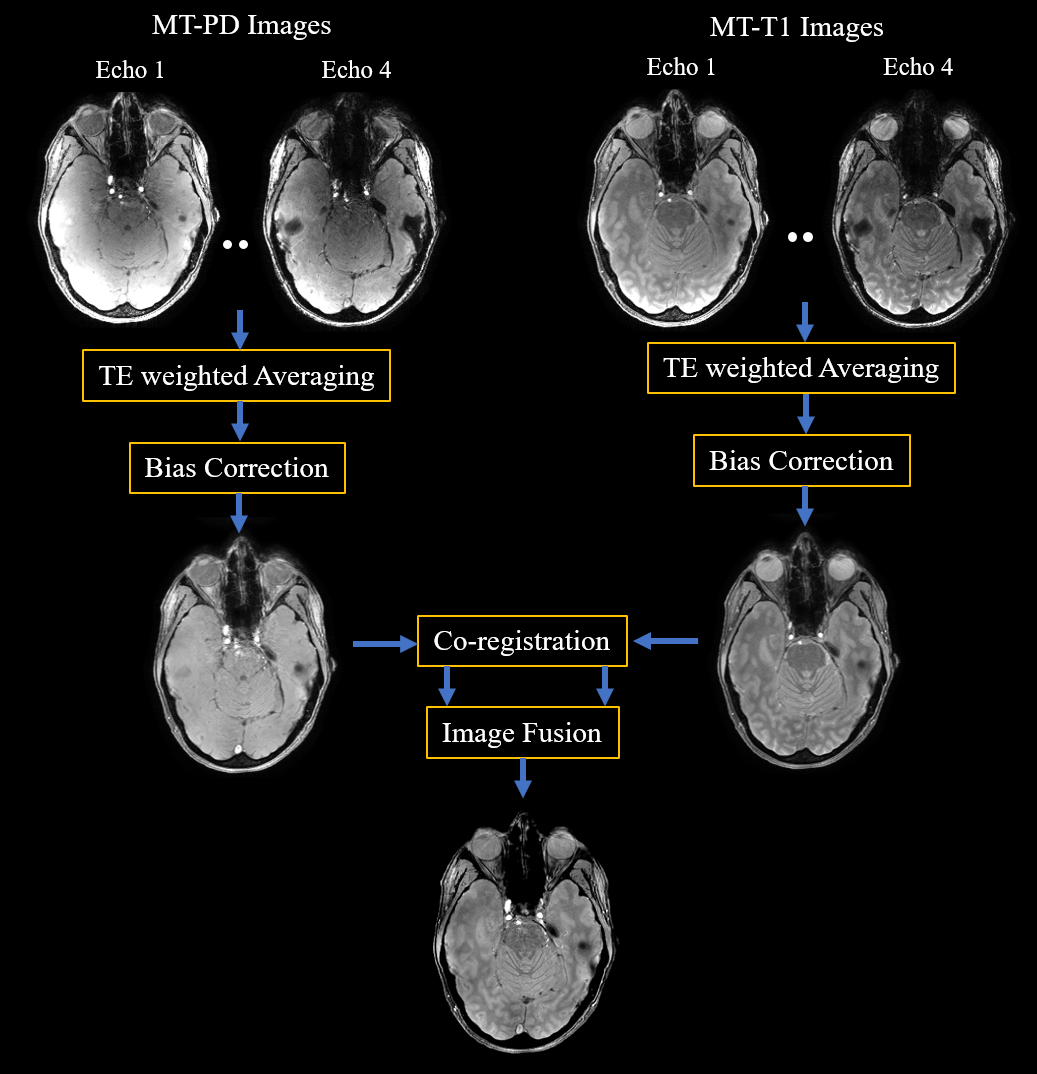
Data processing: The processing pipeline is shown in Figure 2. Each multi-echo dataset was combined via TE-weighted averaging followed by intensity “bias” correction using SPM12. Co-registration was performed to align the scans using FSL’s FLIRT with DOF=6. We assessed the LC visibility both qualitatively and quantitively. The total acquisition time was kept constant across the following comparisons:
-Average of two MT-PD weighted acquisitions
-Average of two MT-T1 weighted acquisitions
-Square root of the product of MT-PD and MT-T1 weighted acquisitions
-Wavelet-based combination of MT-PD and MT-T1 weighted acquisitions
For each combination, the LC-BG and LC-CSF contrasts were calculated within tissue masks (see zoomed-panels in Figure 1) using equations 1&2. The tissue masks were manually-defined, for each acquired dataset, on the product of all cross-contrast combinations.
$$Contrast_{LC-BG}(\%)=100\times\frac{S_{LC}-S_{BG}}{S_{BG}} (1)$$
$$Contrast_{LC-CSF}(\%)=100\times\frac{S_{LC}-S_{CSF}}{S_{CSF}} (2)$$
Results
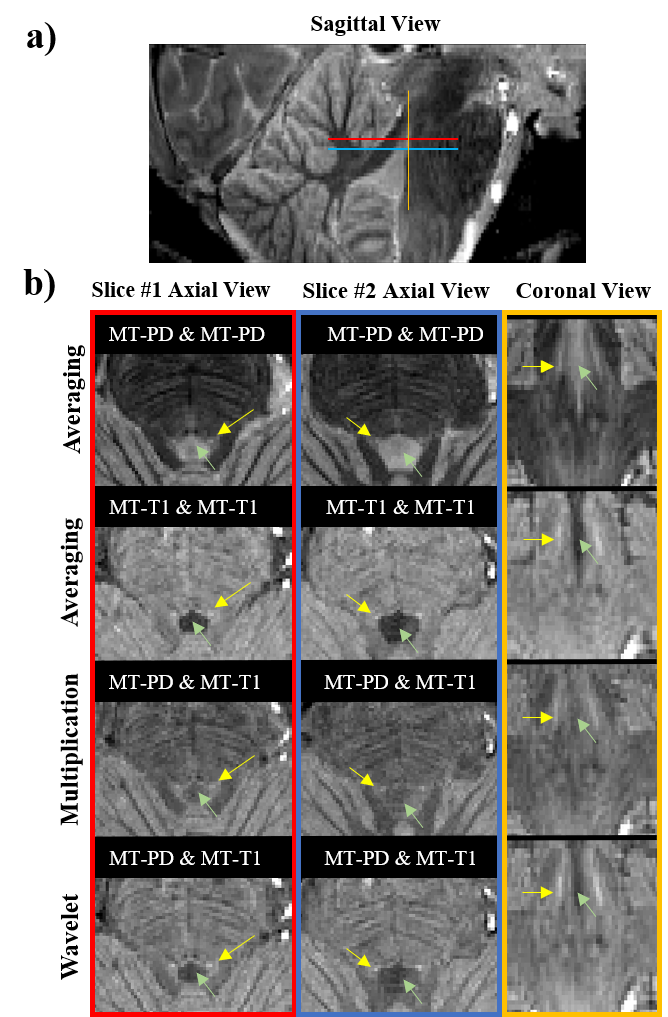
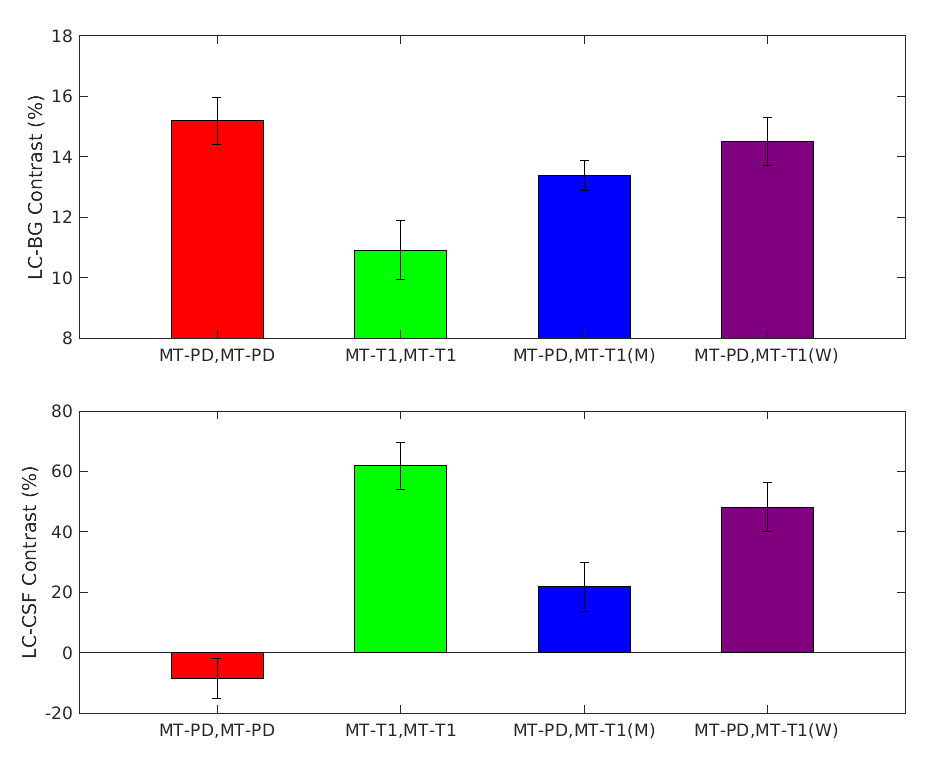
Figure 3 qualitatively illustrates the difference in LC visualisation across the various datasets, and is supported by contrast quantification in Figure 4.Figure 3b slice#1 shows that the averaged MT-PD benefits from greater visibility of the LC with respect to its surroundings than the averaged MT-T1 data, with mean LC-BG contrast of 15.19% and 10.91% respectively (Figure 4). However, when the LC is closer to the fourth-ventricle, as in slice#2, the suppression of the CSF in the MT-T1 data greatly aids visualisation. In this case, the mean LC-CSF is 61.82 % versus -8.53% in the MT-PD case.
Multiplication of the MT-PD by the MT-T1 data improves the LC-CSF contrast (mean of 21.76%) but at the cost of increased noise and reduced contrast with respect to the surrounding tissue (mean LC-BG of 13.38%). The wavelet-based fusion offers greater advantage by further improving the LC-CSF contrast (mean of 48.14%) while restoring the crucial LC-BG contrast to a level close to that of the averaged-MT-PD data (mean of 14.51%). Consistent with this, the LC is most robustly visualised in the wavelet-based combination of the MT-PD and MT-T1 images regardless of slice position (Figure 3b).
Discussion
We have developed an MT-weighted FLASH sequence with a binomial pulse-train to boost LC visualisation, and examined the impact on LC visualisation of combining MT weighting with either PD or T1-weighting. Visualisation crucially depends on high contrast between the LC and the surrounding tissue. This was higher in the MT-PD weighting. However, the MT-T1 weighting benefits from suppression of the CSF signal. Unfortunately, this comes at the cost of reduced contrast with respect to the surrounding tissue. Combining the two weightings via wavelet-based fusion maximises the benefits of each without excessive noise amplification. This improvement was primarily driven by higher weighting of the coarse wavelet sub-band of the MT-T1.Conclusion
Acquiring both MT-PD and MT-T1 data benefits LC visualisation, especially when combined with an advanced fusion technique. Future work will focus on elucidating the complex contrast mechanisms underlying LC visualisation.Acknowledgements
The Wellcome Centre for Human Neuroimaging is supported by core funding from the Wellcome [203147/Z/16/Z].References
[1] Poe, G.R., Foote, S., Eschenko, O., Johansen, J.P., Bouret, S., Aston-Jones, G., Harley, C.W., Manahan-Vaughan, D., Weinshenker, D., Valentino, R. and Berridge, C., 2020. Locus coeruleus: a new look at the blue spot. Nature Reviews Neuroscience, 21(11), pp.644-659.
[2] Trujillo, P., Petersen, K.J., Cronin, M.J., Lin, Y.C., Kang, H., Donahue, M.J., Smith, S.A. and Claassen, D.O., 2019. Quantitative magnetization transfer imaging of the human locus coeruleus. Neuroimage, 200, pp.191-198.
[3] Betts, M.J., Kirilina, E., Otaduy, M.C., Ivanov, D., Acosta-Cabronero, J., Callaghan, M.F., Lambert, C., Cardenas-Blanco, A., Pine, K., Passamonti, L. and Loane, C., 2019. Locus coeruleus imaging as a biomarker for noradrenergic dysfunction in neurodegenerative diseases. Brain, 142(9), pp.2558-2571.
[4] Priovoulos, N., Jacobs, H.I., Ivanov, D., Uludağ, K., Verhey, F.R. and Poser, B.A., 2018. High-resolution in vivo imaging of human locus coeruleus by magnetization transfer MRI at 3T and 7T. Neuroimage, 168, pp.427-436.
[5] Beckers, E., 2020. MRI contrast in the locus cœruleus: Optimisation with multi-compartment spoiled gradient echo imaging.
[6] Chai, Y., Li, L., Wang, Y., Huber, L., Poser, B.A., Duyn, J. and Bandettini, P.A., 2021. Magnetization transfer weighted EPI facilitates cortical depth determination in native fMRI space. Neuroimage, 242, p.118455.
Figures