4351
Unsupervised estimation of spatiotemporal atrophy progression patterns in autopsy-confirmed 4-repeat tauopathies1Department of Neurology, Mayo Clinic, Rochester, MN, United States, 2Department of Neuroscience, Mayo Clinic, Jacksonville, FL, United States, 3Department of Radiology, Mayo Clinic, Rochester, MN, United States
Synopsis
Keywords: Other Neurodegeneration, Neurodegeneration
Motivation: To improve understanding of disease progression in four-repeat tauopathies and determine the value of MRI to predict specific pathologies.
Goal(s): To estimate spatiotemporal atrophy progression patterns from 3D structural MRI and to examine the relationship between the atrophy patterns and pathological diagnosis in four repeat tauopathies.
Approach: We applied an unsupervised machine learning algorithm called Subtype and Stage Inference (SuStaIn) to 3D structural MRI images in autopsy-confirmed four-repeat tauopathies.
Results: The estimated subtype correlated well with the pathological diagnosis, and the estimated stage was negatively correlated with time from MRI to death.
Impact: We identified two MRI atrophy subtypes with different patterns of progression that correlated to pathology in autopsy-confirmed four-repeat tauopathies. This improves understanding of how these pathologies spread through the brain and suggests that MRI could help predict pathology during life.
Introduction
Four-repeat (4R) tauopathies are a group of neurodegenerative diseases characterized by deposition of tau protein isoforms with four microtubule-binding domains and include progressive supranuclear palsy (PSP), corticobasal degeneration (CBD), argyrophilic grain disease (AGD), and glial globular tauopathy (GGT)1. The 4R tauopathies can have overlapping clinical presentations, making it difficult to predict the underlying brain pathologies during life. Recently, an unsupervised machine learning algorithm called Subtype and Stage Inference (SuStaIn) was proposed to estimate data-driven disease progression patterns from cross-sectional imaging datasets2. This method has successfully estimated spatiotemporal atrophy progression patterns in clinically diagnosed PSP and corticobasal syndrome patients3, 4. However, it remains unknown whether estimated atrophy progression patterns are associated with pathology in a pure cohort of autopsy-confirmed 4R tauopathies. The aim of this study is to estimate spatiotemporal atrophy patterns from 3D structural MRI and to examine the relationship between estimated patterns and pathologic diagnosis in autopsy-confirmed 4R tauopathies.Methods
SubjectsWe assessed 71 prospectively recruited patients (28 females) who had died with a pathologic diagnosis of PSP (n=43), CBD (n=25), AGD (n=1), or GGT (n=2). The median age at disease onset, MRI scan, and death was 65, 71, and 73, respectively.
MRI acquisition and processing
All patients underwent antemortem 3 Tesla MRI scans with standardized research protocols. The 3D T1-weighted images from the magnetization-prepared rapid acquisition with gradient echo (MPRAGE) sequence were segmented into gray and white matter using templates and settings from the Mayo Clinic Adult Lifespan Template (MCALT, https://www.nitrc.org/projects/mcalt/). A brain atlas for regional analysis was nonlinearly registered from the template space to each subject space using Advanced Normalization Tools (ANTs). Forty regional tissue volumes in the entire cortical and subcortical areas were calculated from the MCALT atlas5 (originally derived from Automated Anatomical Labeling atlas6), and then 20 volumes were obtained by summing the left and right sides. These volumes were converted to z-scores corrected for age, sex, total brain volume, and scanner manufacturer (GE or Siemens) by using a linear model obtained from the normal control group (n=91).
SuStaIn processing and evaluation
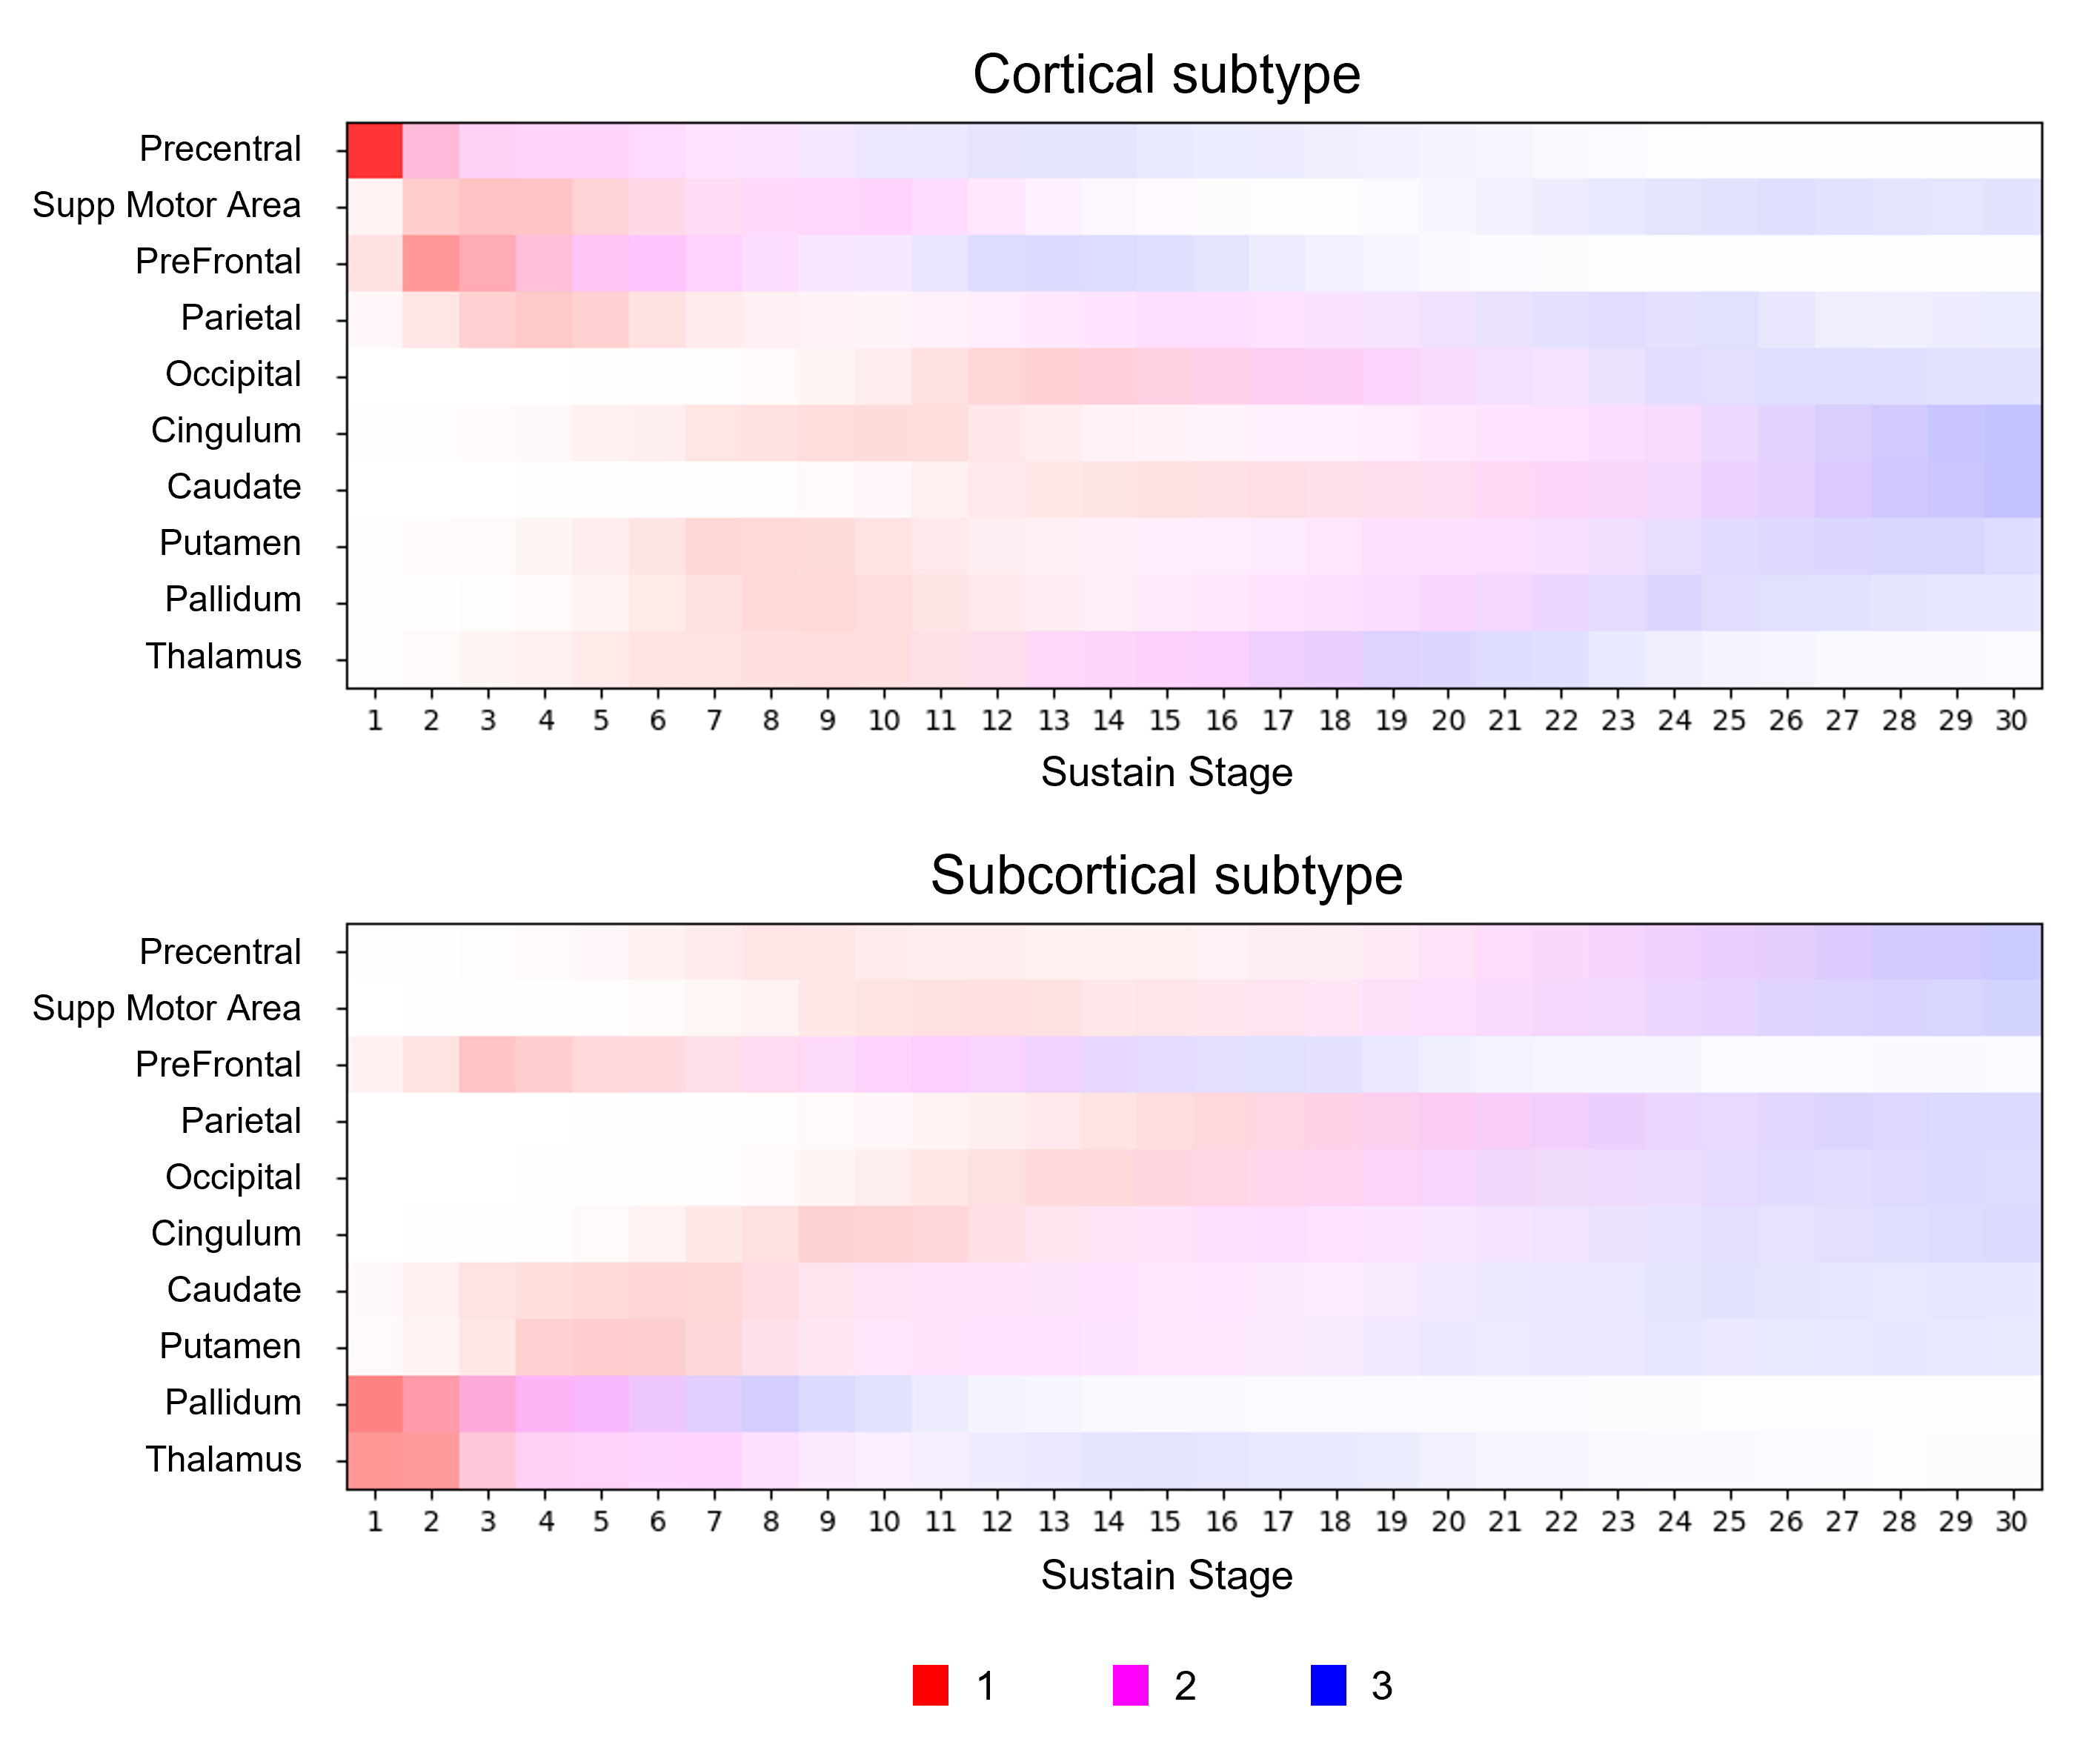
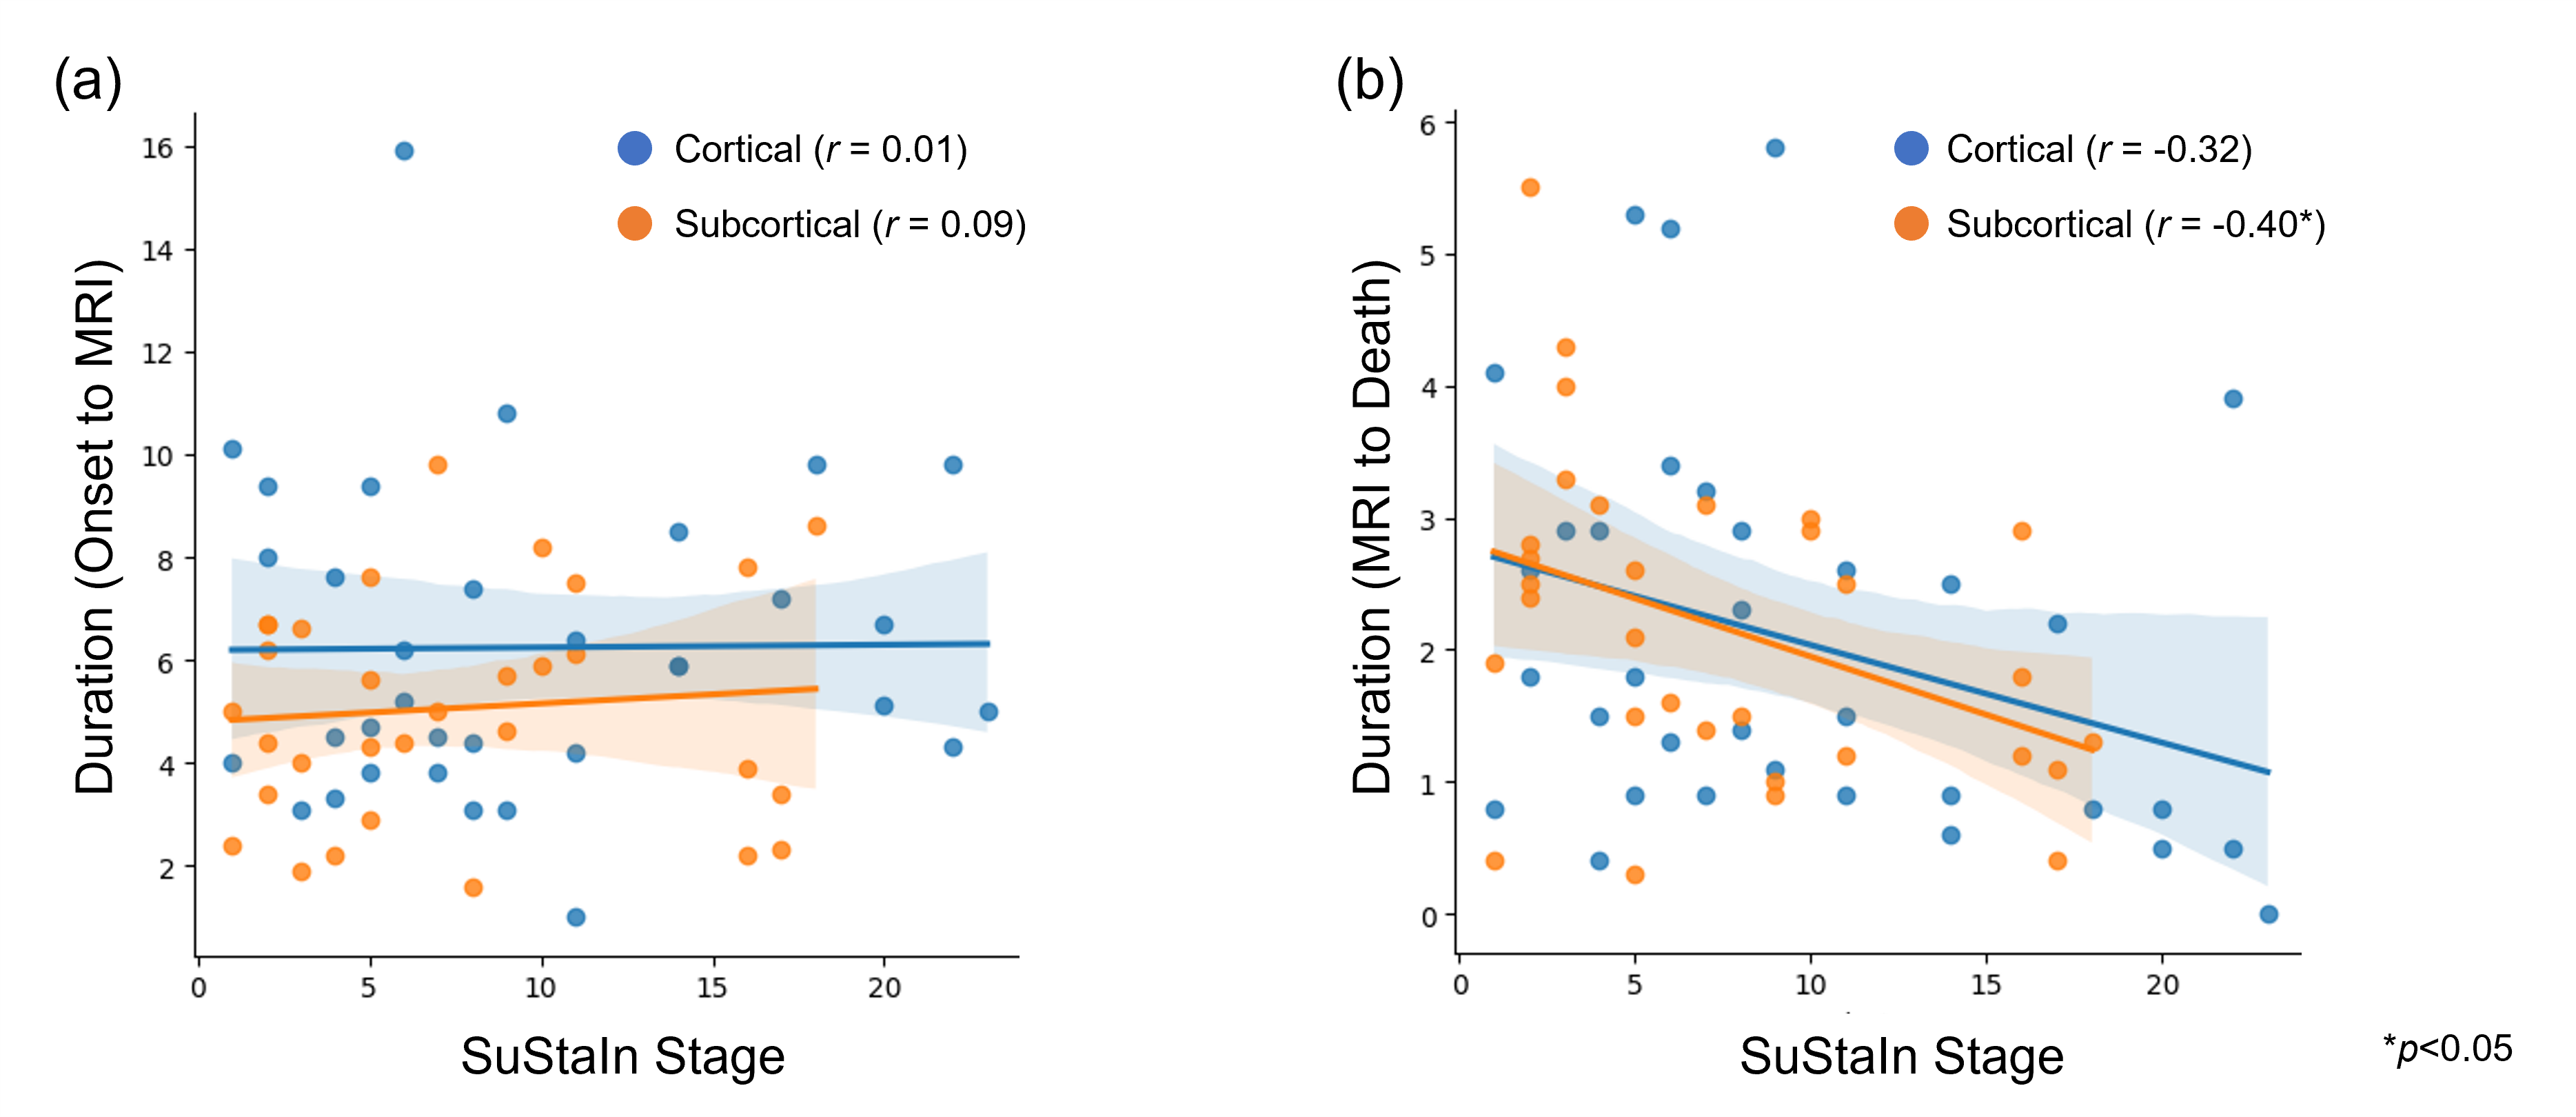
The publicly available SuStaIn code (pySuStaIn, https://github.com/ucl-pond/pySuStaIn)7 was used for SuStaIn processing. The ten regions (see Figure 1) with smaller median z-scores in all patients were used as input to SuStaIn. The SuStaIn algorithm utilized cross-sectional z-score dataset (71 subjects × 10 brain regions) to estimate atrophy progression patterns and to identify data-driven subtype and stages in individual patients. We evaluated the relationship between estimated subtype and pathologic diagnosis by using a chi-squared test and the relationship between estimated stages and two types of disease duration (from onset to MRI scan and from MRI scan to death) by using Pearson’s correlation coefficients.
Results
The SuStaIn algorithm identified two distinct patterns of atrophy progression (Figure 1): 1) a cortical subtype in which atrophy begins in frontal regions, specifically spreading from precentral cortex to prefrontal cortex and supplementary motor area, with later spread into subcortical structures; and 2) a subcortical subtype in which atrophy begins in subcortical structures, specifically the pallidum and thalamus, before spreading into striatum and frontal regions. The two estimated subtypes were correlated with the pathologic diagnosis (Table 1, p<0.01). The cortical subtype was more associated with CBD, and the subcortical subtype was more associated with PSP. Estimated stages were not correlated with the time from onset to MRI scan but were negatively correlated with time from MRI scan to death (Figure 2, r < -0.3 for both subtypes).Discussion
In this study, we applied an unsupervised machine learning algorithm called SuStaIn to autopsy-confirmed 4R tauopathies. We demonstrated that there are two different 4R tauopathy atrophy subtypes which show different patterns of progression and appear to result from different underlying pathologies. The cortical subtype was more strongly associated with CBD while the subcortical subtype was more associated with PSP, consistent with pathological tau patterns in these diseases8. Furthermore, the estimated stages worsened closer to death, as would be expected. These findings contribute to a better understanding of how these 4R tauopathies spread through the brain and support a role of MRI to help predict the specific 4R tauopathy during life. The strength of this study was the use of a large pure cohort of autopsy-confirmed 4R tauopathies, although further studies will be needed to validate the estimated model using external cohorts.Conclusion
The estimated spatiotemporal atrophy subtypes correlated with pathologic diagnosis in autopsy-confirmed 4R tauopathies.Acknowledgements
This study is supported by NIH grants R01-NS89757, R01-DC12519 and R01-DC14942.References
1. Rosler TW, Tayaranian Marvian A, Brendel M, et al. Four-repeat tauopathies. Prog Neurobiol. 2019;180:101644.
2. Young AL, Marinescu RV, Oxtoby NP, et al. Uncovering the heterogeneity and temporal complexity of neurodegenerative diseases with Subtype and Stage Inference. Nat Commun. 2018;9(1):4273.
3. Saito Y, Kamagata K, Wijeratne PA, et al. Temporal progression patterns of brain atrophy in corticobasal syndrome and progressive supranuclear palsy revealed by Subtype and Stage Inference (SuStaIn). Front Neurol. 2022;13:814768.
4. Scotton WJ, Shand C, Todd E, et al. Uncovering spatiotemporal patterns of atrophy in progressive supranuclear palsy using unsupervised machine learning. Brain Commun. 2023;5(2):fcad048.
5. Schwarz CG, Gunter JL, Ward CP, et al. The Mayo Clinic Adult Lifespan Template: Better quantification across the lifespan. Alzheimers Dement. 2017;13(7S Part 16):792.
6. Tzourio-Mazoyer N, Landeau B, Papathanassiou D, et al. Automated anatomical labeling of activations in SPM using a macroscopic anatomical parcellation of the MNI MRI single-subject brain. Neuroimage. 2002;15(1):273-289.
7. Aksman LM, Wijeratne PA, Oxtoby NP, et al. pySuStaIn: a Python implementation of the Subtype and Stage Inference algorithm. SoftwareX. 2021;16:100811.
8. Yoshida M, Akagi A, Miyahara H, et al. Macroscopic diagnostic clue for parkinsonism. Neuropathology. 2022;42(5):394-419.
9. Dickson DW, Ahmed Z, Algom AA, Tsuboi Y, Josephs KA. Neuropathology of variants of progressive supranuclear palsy. Curr Opin Neurol. 2010;23(4):394-400.
Figures