4350
Longitudinal Quantitative MRI Study on Abnormal Brain Iron Progression in Rapid Eye Movement Sleep Behavior Disorder and Parkinson’s Disease1Paris Brain Institute (ICM), Paris, France, 2Department of Neuroradiology, Pitié-Salpêtrière Hospital, AP-HP, Paris, France, 3Sleep Disorders Unit, Pitié-Salpêtrière Hospital, AP-HP, Paris, France, 4Department of Neurology, Pitié-Salpêtrière Hospital, AP-HP, Paris, France
Synopsis
Keywords: Parkinson's Disease, Brain, quantitative susceptibility mapping (QSM), Parkinson's, nigra, basal ganglia, REM Sleep Behavior Disorder, Iron, linear mixed-effects models
Motivation: Although Parkinson’s disease (PD) and isolated REM sleep behavior disorder (iRBD) demonstrate elevated substantia nigra (SN) iron concentration, topography of change is still debated.
Goal(s): To quantify abnormal brain iron progression over time using quantitative susceptibility mapping (QSM).
Approach: Subjects were assessed three times 2 years apart. Mean QSM template was developed to quantify SN and its subdivisions, and subthalamic nucleus. Then caudate nucleus, putamen, globus pallidus and thalamus were also quantified.
Results: At baseline, PD without RBD demonstrated +17.8% posteroventral SN iron overload and during the follow-up, 26.2% overload versus controls.
None of the other tested regions showed significant differences between groups.
Impact: Abnormal iron concentration was only found in the posteroventral SN and not in any other basal ganglia region over time. Further, PD without RBD showed highest iron concentration. Iron-sensitive quantitative MRI could be a potential longitudinal biomarker of the future.
INTRODUCTION
Parkinson’s disease (PD) patients demonstrate elevated iron levels in the substantia nigra (SN)1 that can be assessed using R2* and quantitative susceptibility mapping (QSM)2. Elevated iron concentration in the SN is also found in isolated rapid eye movement (REM) sleep behavior disorder (iRBD) which is considered a prodromal stage of α-synucleinopathies3,4.Although both PD5 and iRBD6 demonstrate nigral iron accumulation, the topographical variation over time is still debated.
METHODS
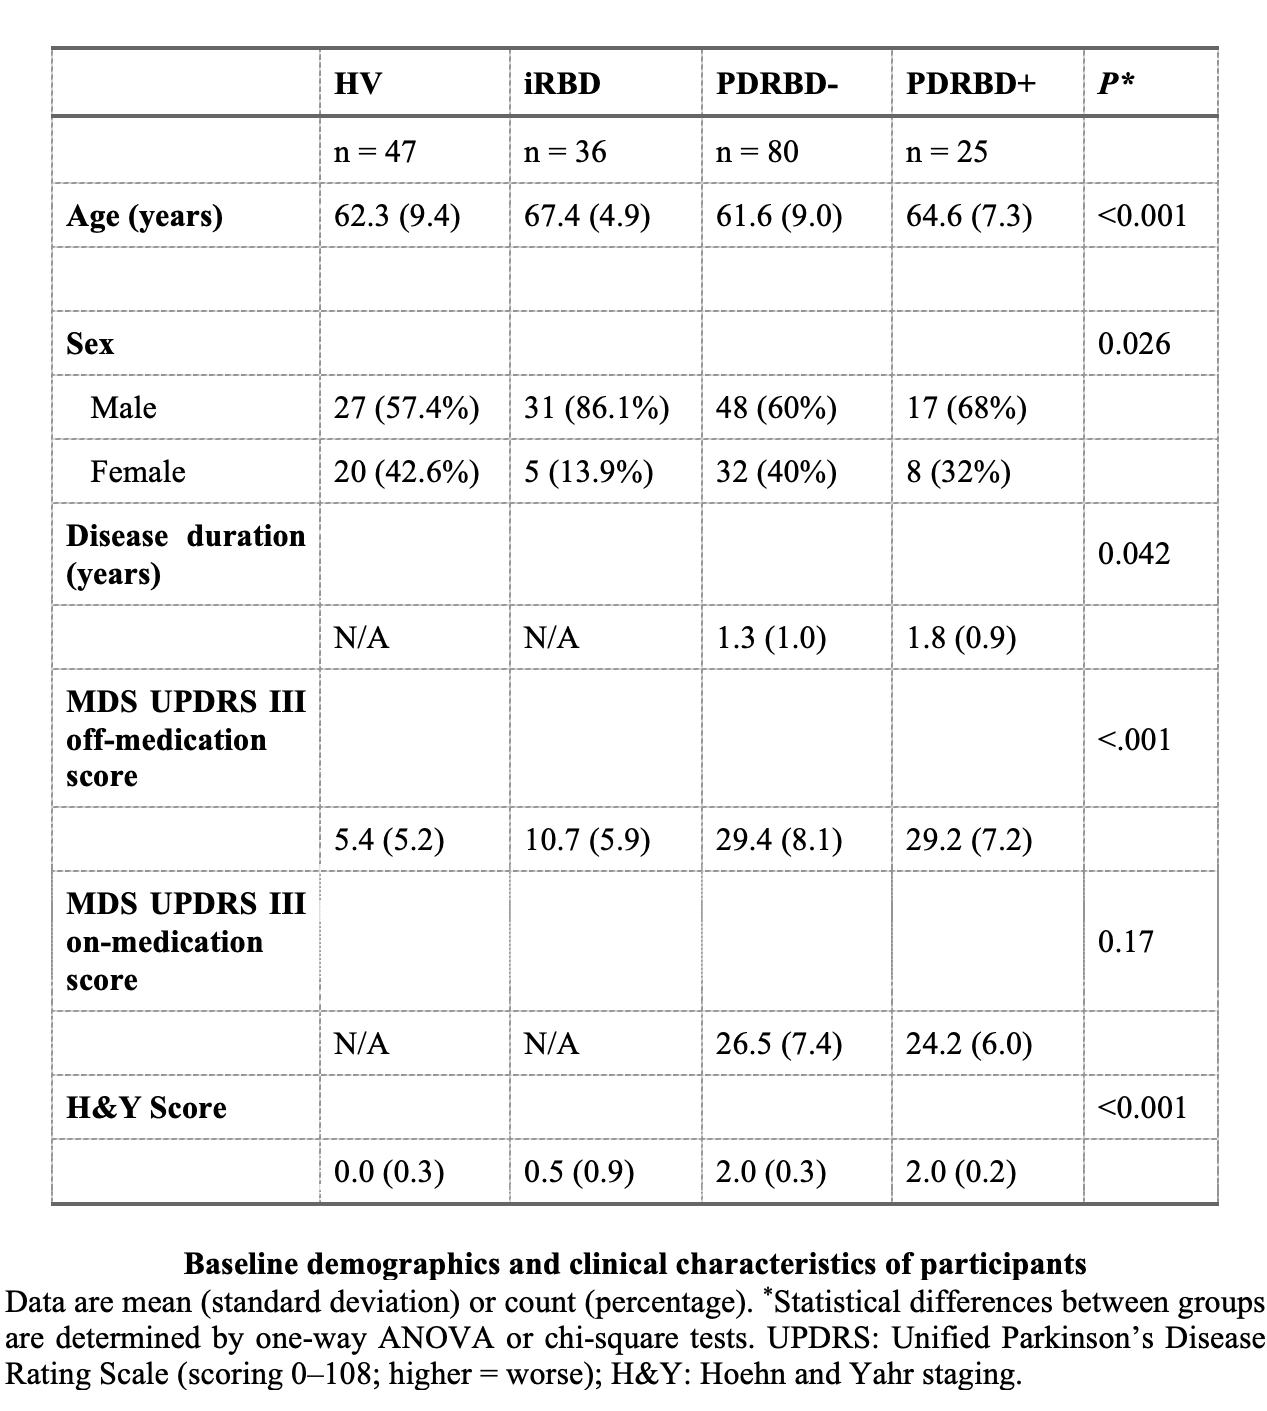
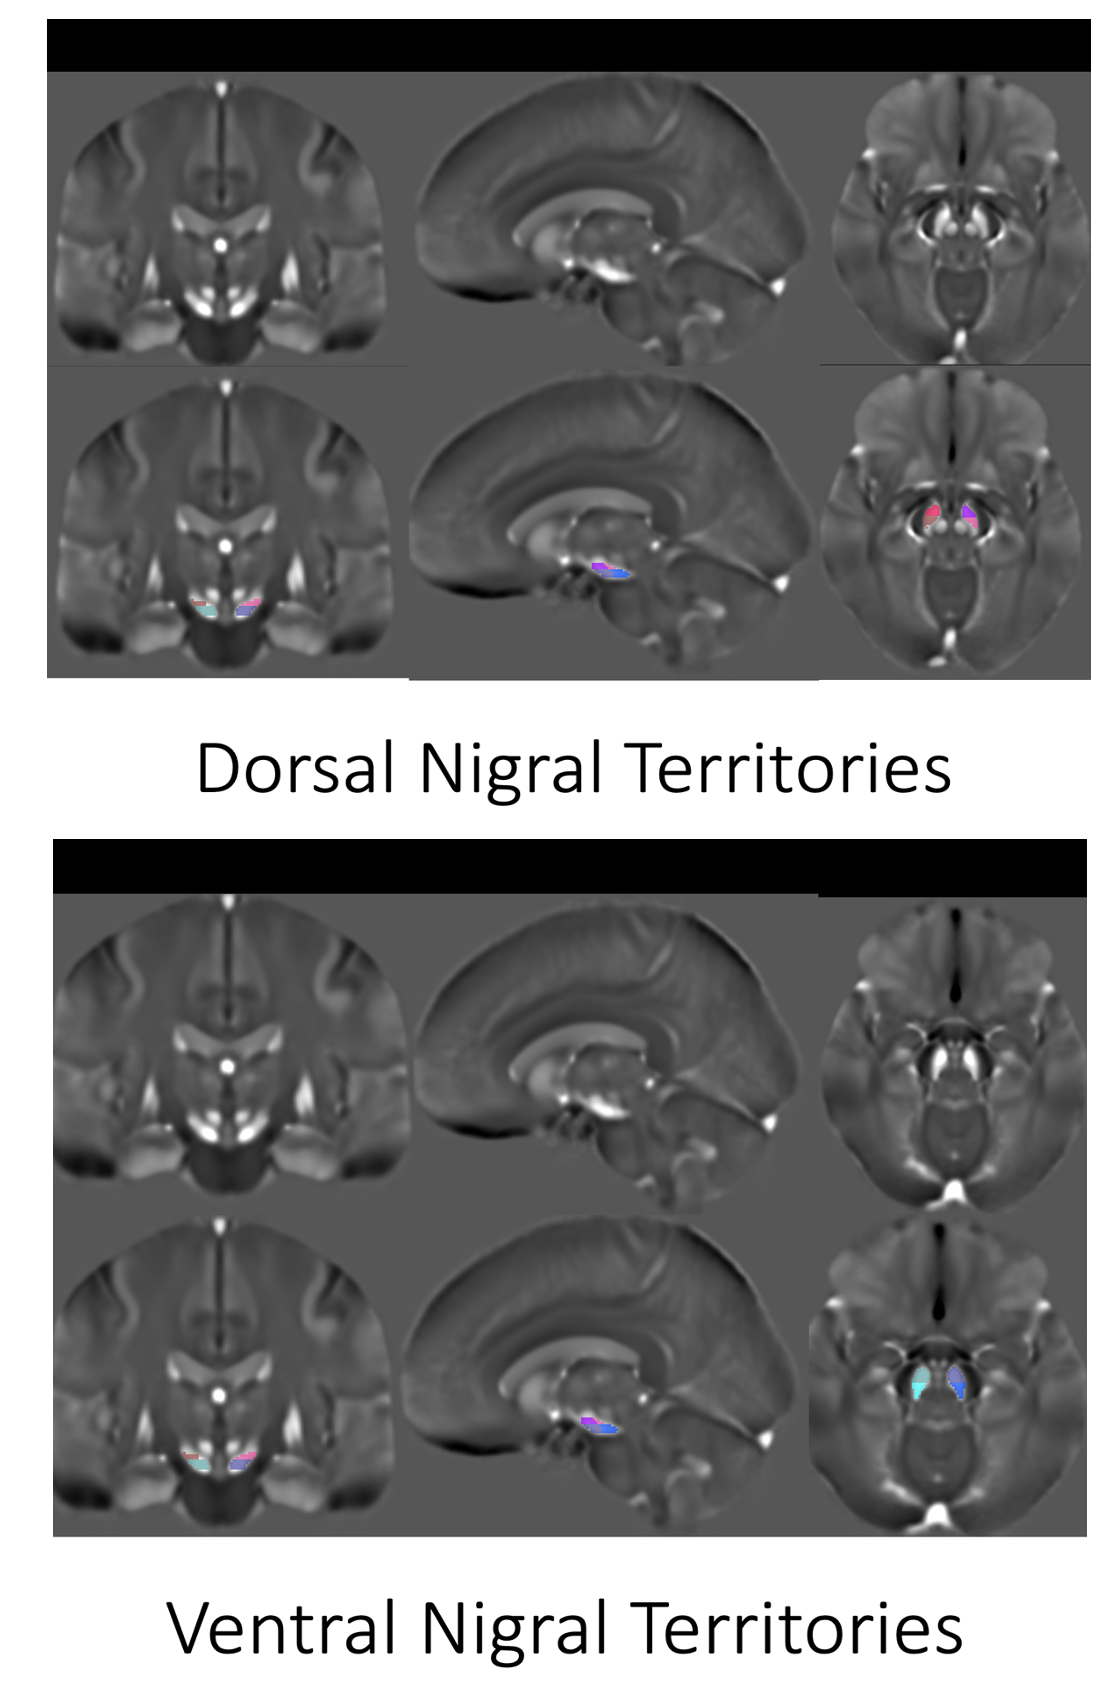
PARTICIPANTS: Polysomnography-confirmed early-stage PD with (PDRBD+) and without RBD (PDRBD-), iRBD, and healthy volunteers (HV) were scanned using 3T PRISMA MRI and comprehensively assessed three times (V1/V2/V3) with an interval of 2.0 ± 0.2 years between the visits.IMAGE ANALYSIS: QSM images were calculated using the MEDI toolbox7,8. We created a mean QSM template using Advanced Normalization Tools (ANTs). The bilateral entire SN and its subdivisions (anterior and posterior territories of dorsal and ventral SN), and the subthalamic nucleus were manually delineated on the mean template by experienced raters. The dorsal SN was drawn on every superior slice where the red nucleus was visible and the ventral SN was drawn on every inferior slice where the red nucleus was either not or barely visible. We split the dorsal and ventral SN along the anterior-posterior axis to obtain anterior and posterior dorsal and ventral SN9. ANTs provided the inverse transformation to denormalize all the regions from the mean template onto the template space to yield the regions for each subject automatically. Using FreeSurfer(v7.0), we also automatically segmented the caudate nucleus, putamen, globus pallidus, and thalamus on the 3D T1-weighted images and coregistered to the QSM images using NiftyReg(v1.5.58). Henceforth, quantitative mean susceptibility values for each region were computed.
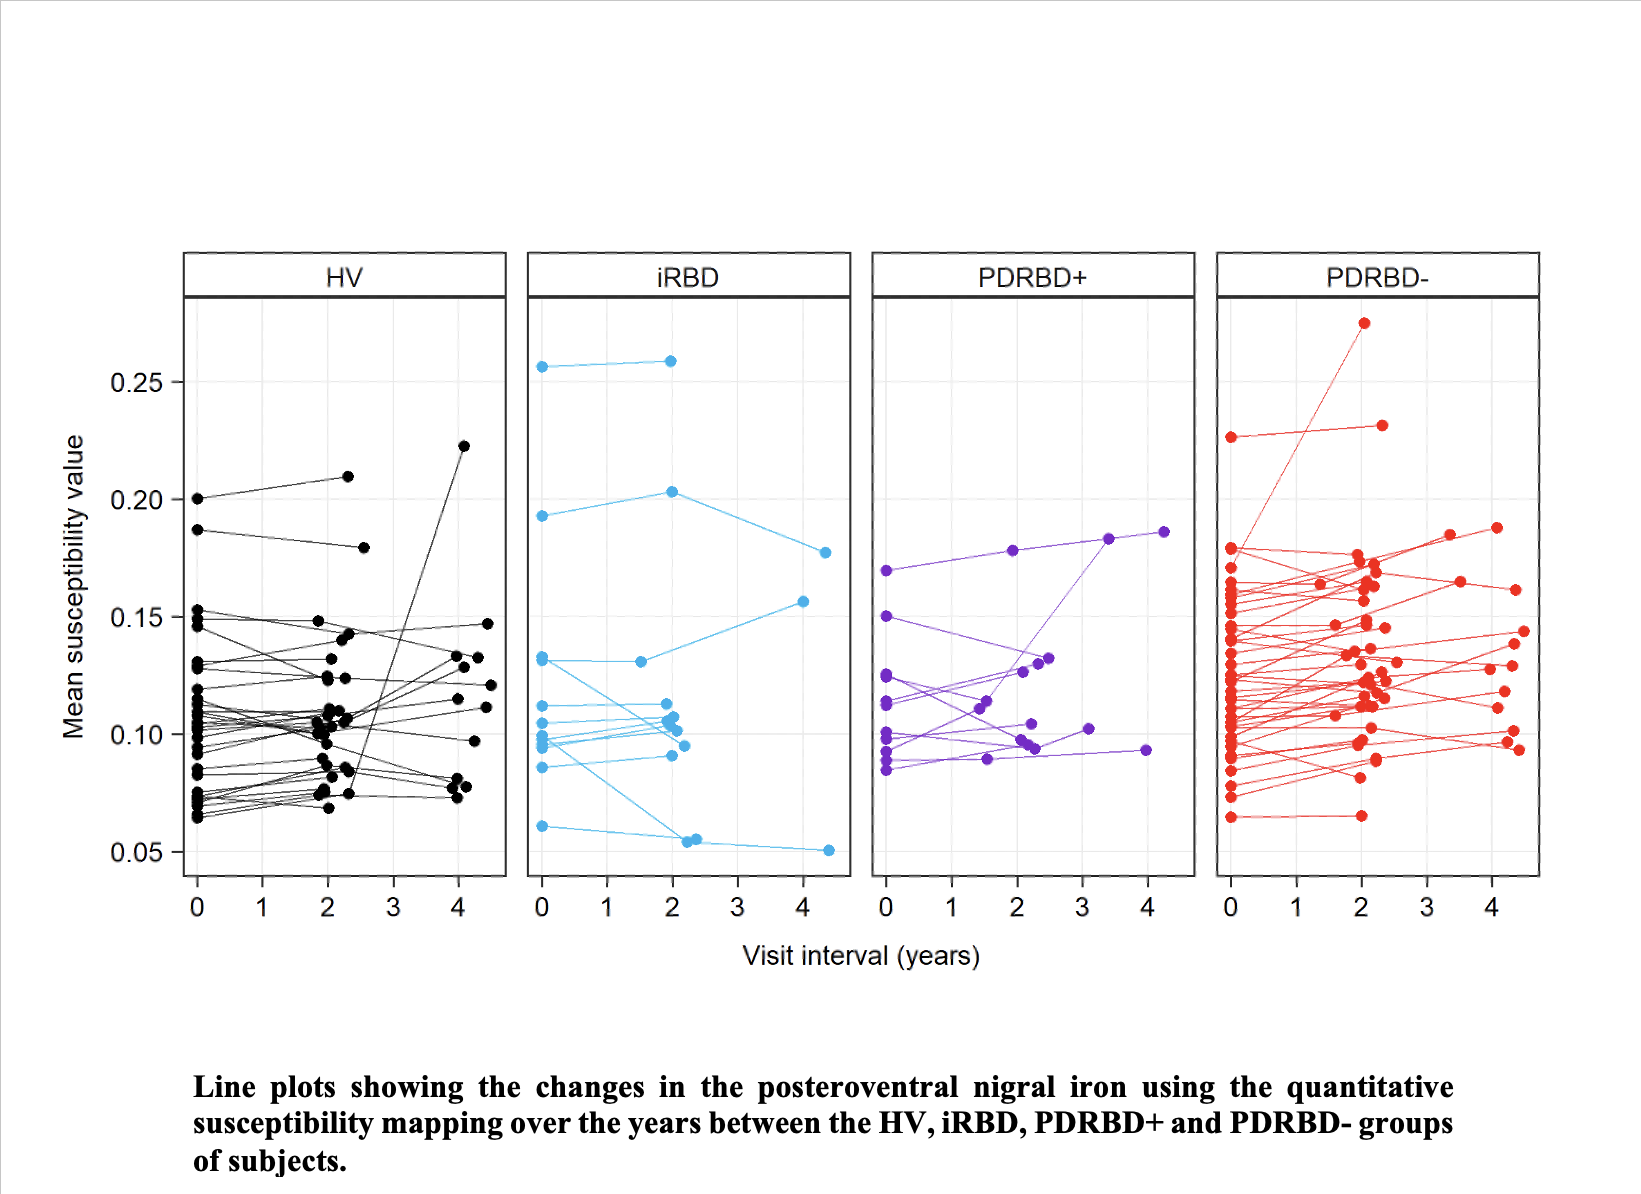
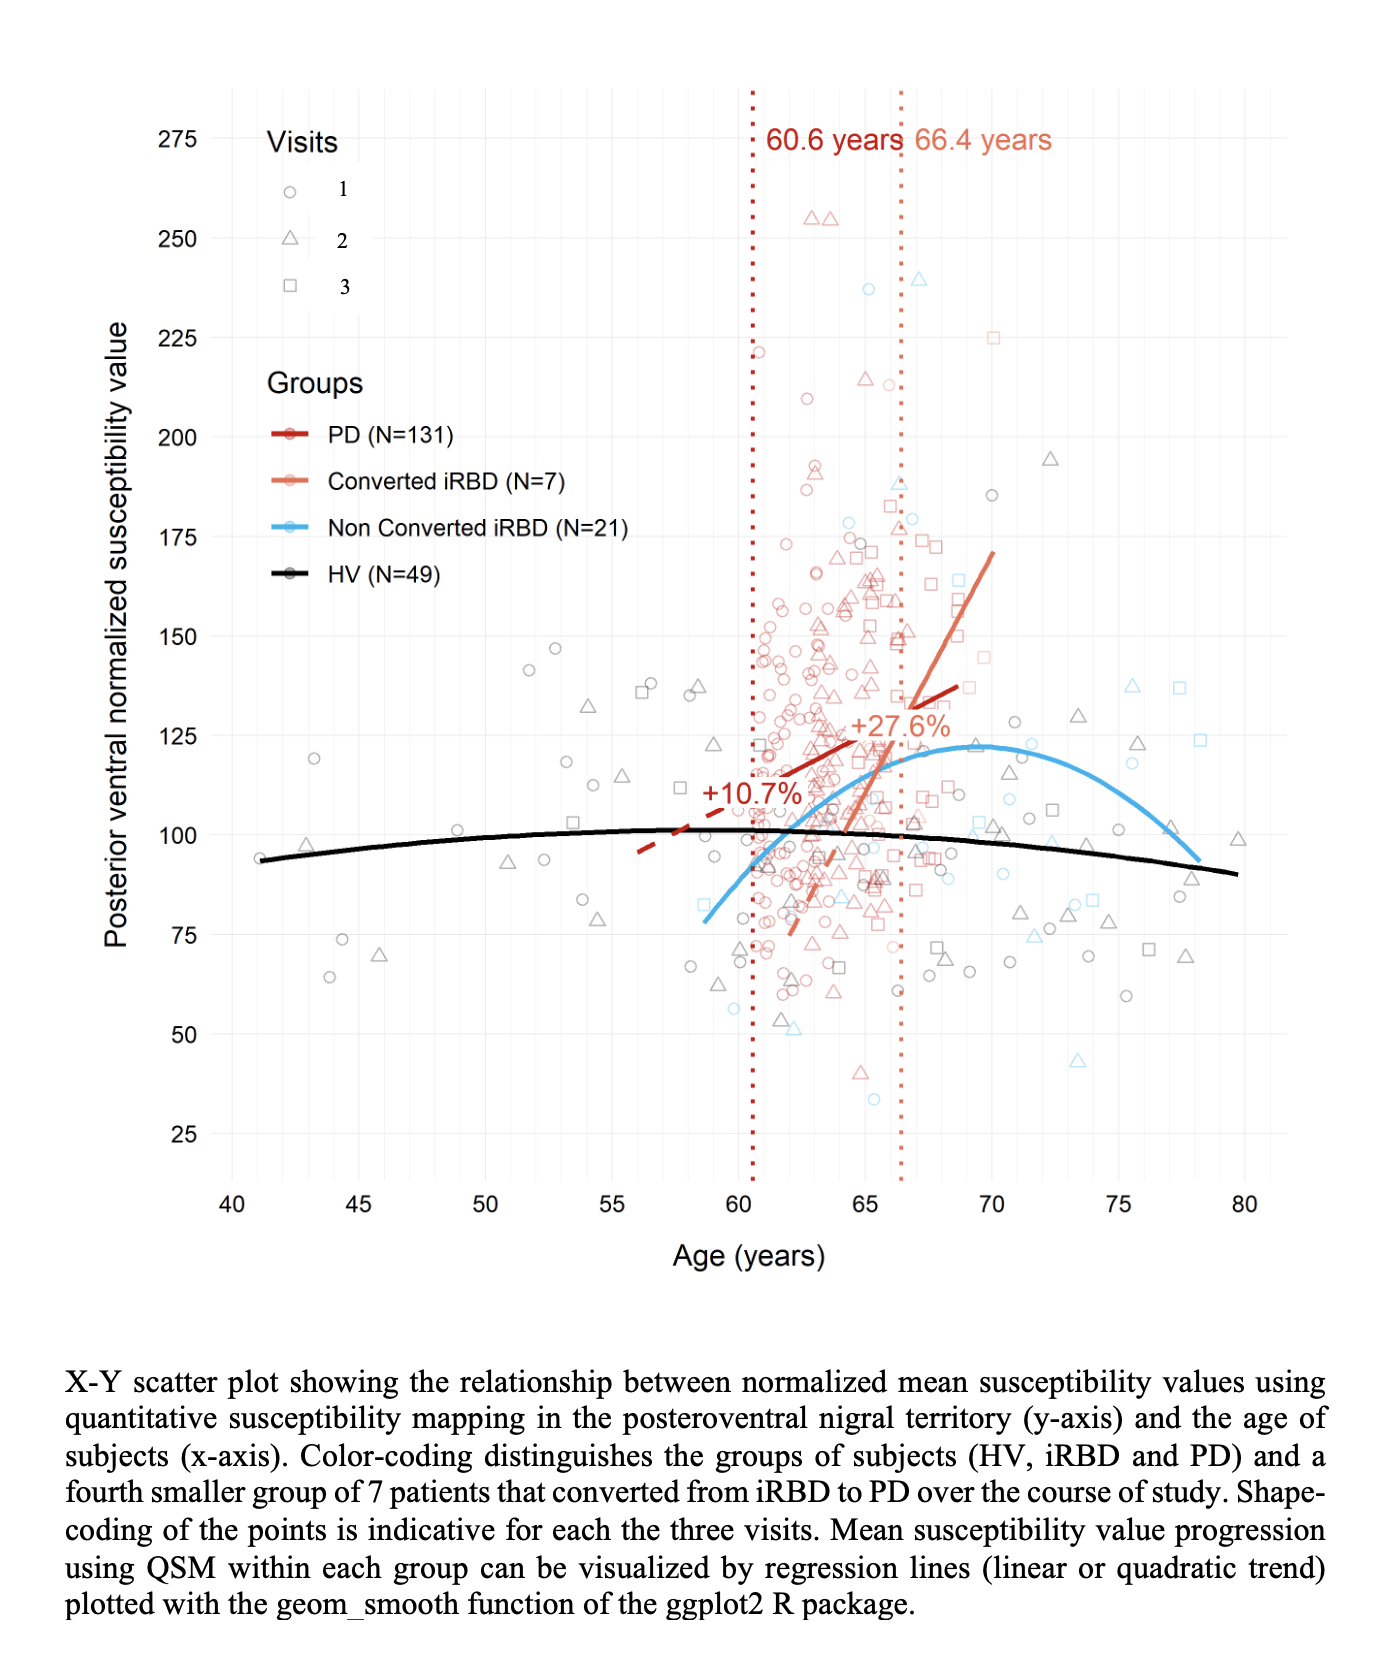
STATISTICAL ANALYSES: Baseline between-group differences in QSM values were tested using multivariate linear regression models including age and sex as covariates (one model fitted per region of interest). The longitudinal analyses were then performed on subjects with at least two-time points over their visits using linear mixed-effects models (LMM). In each LMM, the group, the visit interval, and their interaction term were considered as fixed effects, while a random (intercept) effect was applied to subject identifiers. The significance effects of the main or interaction effects were tested by Type II Wald Chi-square tests. To visualize the QSM progression, the evolution of the values was tracked with respect to the age of the non-PD subjects (HV and iRBD). PDRBD+ and PDRBD- groups were added by aligning all individual ages at onset to the baseline mean age of the HV group.
For ease of data visualization, all QSM values were plotted after normalization by the mean value of the HV representing 100% level at the baseline visit. We also investigated a fourth subgroup of 7 iRBD participants who converted to PD during the follow-up visits.
RESULTS
At V1/V2/V3, 47/31/13 HV, 36/19/7 iRBD, 25/11/6 PDRBD+ and 80/40/12 PDRBD- were included. Overall group comparisons demonstrated a significant difference only in the posteroventral SN (F3,182 = 2.74; p = 0.044) and not in any other regions.Using Tukey’s post hoc pairwise comparisons, PDRBD- demonstrated +17.8% significant posteroventral SN iron overload (p = 0.03) with respect to the HV group, while the iron increase in PDRBD+ (+15.9%) and iRBD (+10.3%) did not reach significance. None of the other tested regions showed significant differences between groups. Longitudinally, overall, there were highly significant group and time effects only in the posteroventral SN (p < 0.001), but no interaction. During the follow-up, the mean level of QSM for posteroventral SN in the PDRBD- group was 26.2% significantly higher (p = 0.0029) with respect to the HV group.
Our modeling based on posteroventral SN iron suggested that iron increase at the time of onset will be around +10.7% at the age of onset (60.6 years) with respect to the mean level of HV.
Further, using the data available for converted iRBD participants, the prediction suggested that there should be a faster increase reaching +27.6% at the age of onset (66.4 years).
DISCUSSION AND CONCLUSION
In this longitudinal quantitative MRI cohort study, we demonstrated elevated iron levels in patients with PD in the posteroventral nigral region and not in any other basal ganglia region over time that did not reach significance in PD patients with RBD and iRBD probably due to lack of statistical power.Longitudinally, iron increased similarly in all groups.
Acknowledgements
This work was supported by grants from DHOS-Inserm, France Parkinson, Ecole des NeuroSciences de Paris (ENP), Fondation pour la Recherche Médicale (FRM), and the Investissements d'Avenir, IAIHU-06 (Paris Institute of Neurosciences – IHU), ANR-11-INBS-0006, Fondation d’Entreprise EDF, BIOGEN Inc., Fondation Thérèse and René Planiol, Fondation Saint-Michel, ANR-21-JPW2-000 (JPND Control-PD).
We are deeply grateful to Energipole (M. Mallart) and Société Française de Médecine Esthétique (M Legrand) for unrestricted support for Research on Parkinson’s disease and to all the participants and technicians who helped to make the ICEBERG project (ClinicalTrials.gov Identifier: NCT02305147) a reality.
References
1. Poewe W, Seppi K, Tanner CM, et al. Parkinson disease. Nat Rev Dis Primers. 2017 Mar 23;3:17013.
2. Barbosa, J. H. O., Santos, A. C., Tumas, V., et al. Quantifying brain iron deposition in patients with Parkinson’s disease using quantitative susceptibility mapping, R2 and R2. Magnetic resonance imaging. 2015; 33(5), 559-565.
3. Ehrminger M, Latimier A, Pyatigorskaya N, et al. The coeruleus/subcoeruleus complex in idiopathic rapid eye movement sleep behaviour disorder. Brain. 2016;139(4):1180-1188. doi:10.1093/brain/aww006.
4. Iranzo A, Fernandez-Arcos A, Tolosa E, et al. Neurodegenerative disorder risk in idiopathic REM sleep behavior disorder: study in 174 patients. PLoS One 2014;9(2):e89741.
5. Langkammer, C., Pirpamer, L., Seiler, et al. Quantitative susceptibility mapping in Parkinson’s disease. 2016; PLoS One, 11(9), e0162460.
6. Sun J, Lai Z, Ma J, et al. Quantitative evaluation of iron content in idiopathic rapid eye movement sleep behavior disorder. Mov. Disord. 2020; 35(3):478–485.
7. Zhou, D., Liu, T., Spincemaille, P., & Wang, Y. Background field removal by solving the Laplacian boundary value problem. NMR in Biomedicine; 2014; 27(3), 312-319.
8. Liu, J., Liu, T., de Rochefort, L., et al. Morphology enabled dipole inversion for quantitative susceptibility mapping using structural consistency between the magnitude image and the susceptibility map. Neuroimage; 2012; 59(3), 2560-2568.
9. Bergsland N, Zivadinov R, Schweser F, et al. Ventral posterior substantia nigra iron increases over 3 years in Parkinson’s disease. Mov. Disord. 2019; 34(7):1006–1013.
Figures