4349
White-matter functional networks changes in PD patients with L-dopa induced dyskinesia1xuanwu hospital of capital medical university, beijing, China, 2Shanghai United Imaging Healthcare Co., Ltd., shanghai, China, 3Beijing United Imaging Research Institute of Intelligent Imaging, beijing, China
Synopsis
Keywords: Parkinson's Disease, Neuroscience
Motivation: Functional connectivity between white-matter networks maybe a neuroimaging biomarker of PD with L-dopa induced dyskinesia (LID).
Goal(s): The aim of this research is to investigate changes of the white-matter functional networks in PD with LID.
Approach: The construction of white-matter network was achieved by using K-means clustering while FC was also calculated.
Results: A decreasing trend (not significant) was also found between LID and noLID group. FC between WM2 and WM11 in LID group showed a significantly positive correlation with MMSE, while a negative relation between FC and MMSE was found in noLID group.
Impact: The study showed that decreased FC between white-matter networks and their influence on clinical performance may indicated the appearance of PD and symptom of LID.
Introduction
Parkinson’s disease (PD) is the second most frequent neurodegenerative disorder worldwide. PD patients may has symptoms of dyskinesia including L-dopa induced dyskinesia (LID). For a long time, WM integrity damage has been associated with PD experience and increase of disease severity. The functional organization of white-matter was getting more attention in recent research. The aim of this research is to investigate changes of the white-matter functional networks in PD with LID.Method
34 PD patients and 20 healthy volunteers underwent brain PET/MR scans (uPMR790, United Imaging, Shanghai). Resting-state fMRI was performed using an echo-planar imaging (EPI) sequence with the following parameters for following research (TE = 30 ms, TR = 2000 ms, filp angle = 76°, FOV = 192 × 192 mm2 , 31 axial slices per volume, voxel size = 3.5 ×3.5 ×3.5 mm3, 1 mm slice gap). High-resolution T1-weighted 3-dimensional images with a magnetization-prepared rapid gradient echo sequence (3D-MPRAGE) was also acquired (TE = 3.8 ms, TR = 2530 ms, TI = 1100 ms, filp angle = 7°, FOV = 256 × 256 mm2, voxel size = 3.5 ×3.5 ×3.5 mm3). Clinical variables were collected from all recruited participants including age of onset, medication time, disease duration as well as Mini-Mental State Examination (MMSE). 2 healthy volunteers were excluded for large head motion. PD patients were further separated into 2 groups based on symptom of L-dopa induced dyskinesia (LID). DPARSFA, SPM12, and in-house MATLAB scripts were utilized to preprocess fMRI and T1 data. Whole preprocessing workflow was similar with recent study [1]. Each voxel was identified as gray matter, white matter and CSF based on the segmentation result for each subject. Calculation of the correlation coefficient between each white-matter voxel was performed to get a group level correlation matrix. The construction of white-matter network was achieved by using K-means clustering. To find the most stable white-matter network, Dice coefficient of the clustering solution for each number of clusters (from 2 to 22) was calculated. Functional connectivity (FC) between any two white-matter networks was calculated and compared among 3 groups (HC, LID, noLID). Correlation analysis was performed to evaluate the relation between clinical performance and activation of white-matter network. A p-value < 0.05 after Bonferroni multiple test correction was considered statistically significant.Result
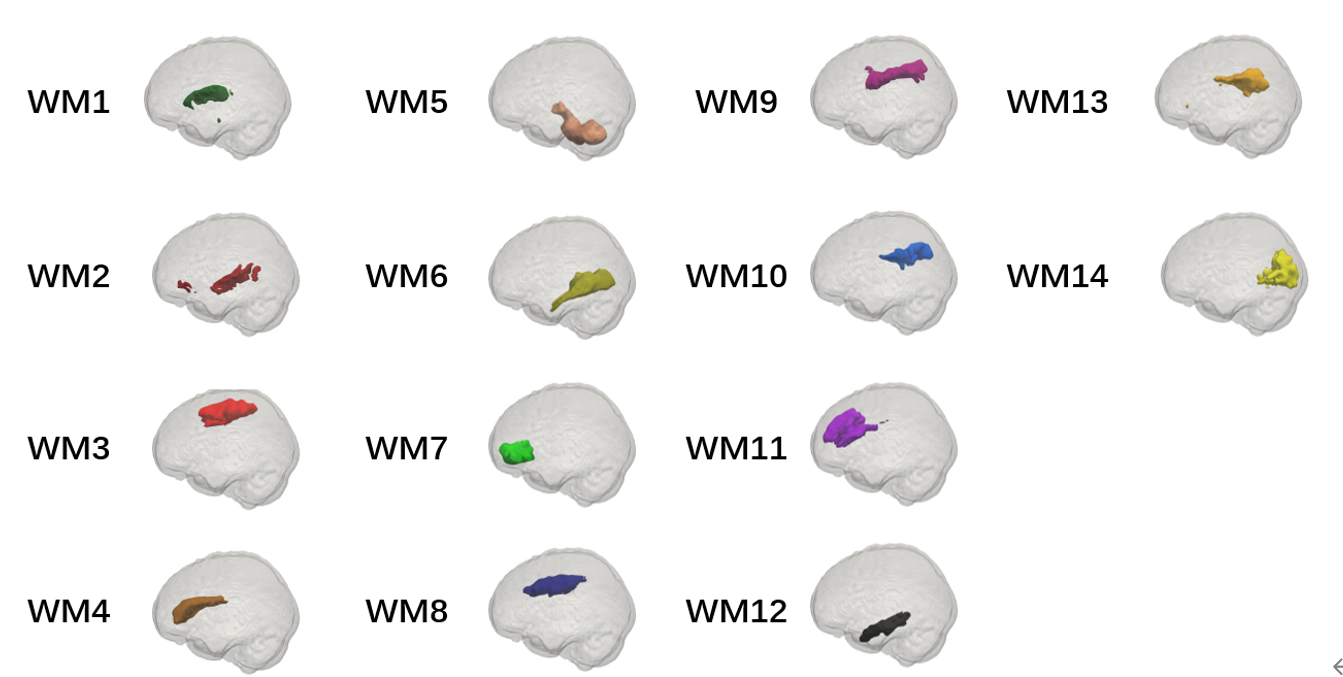
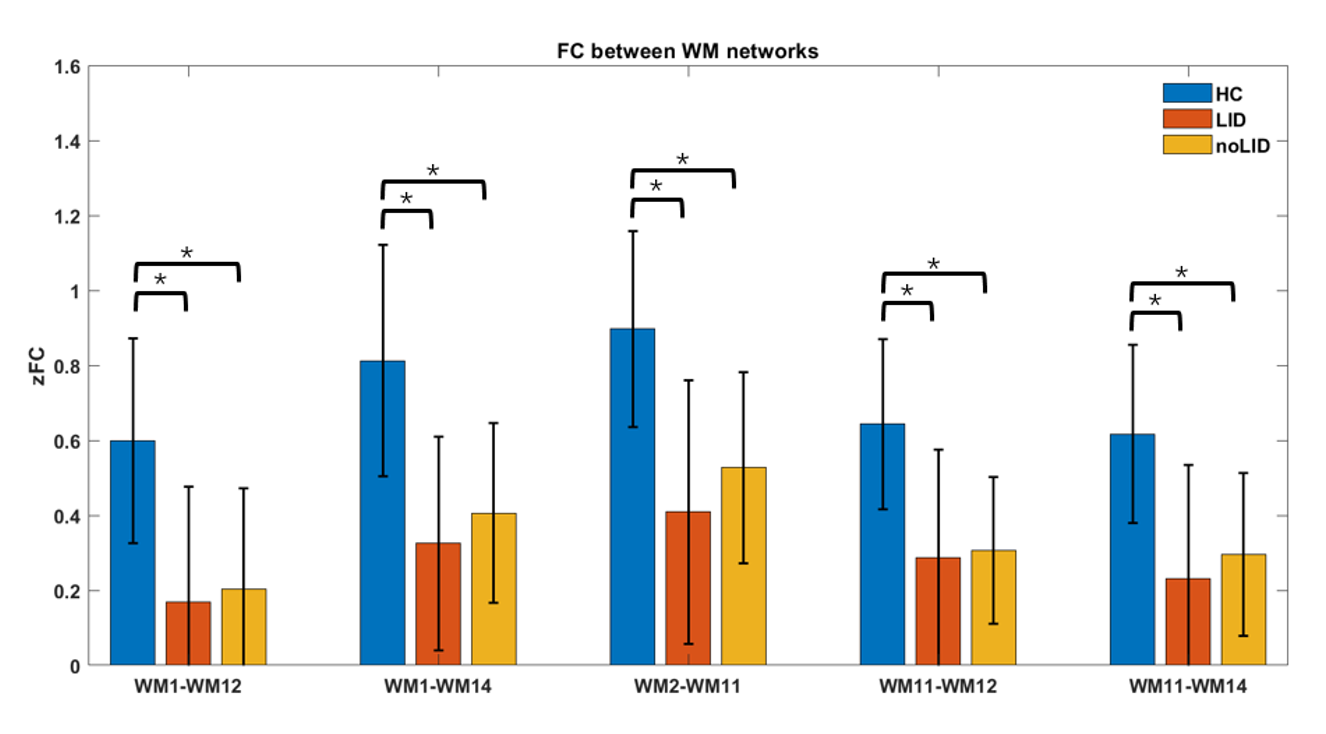
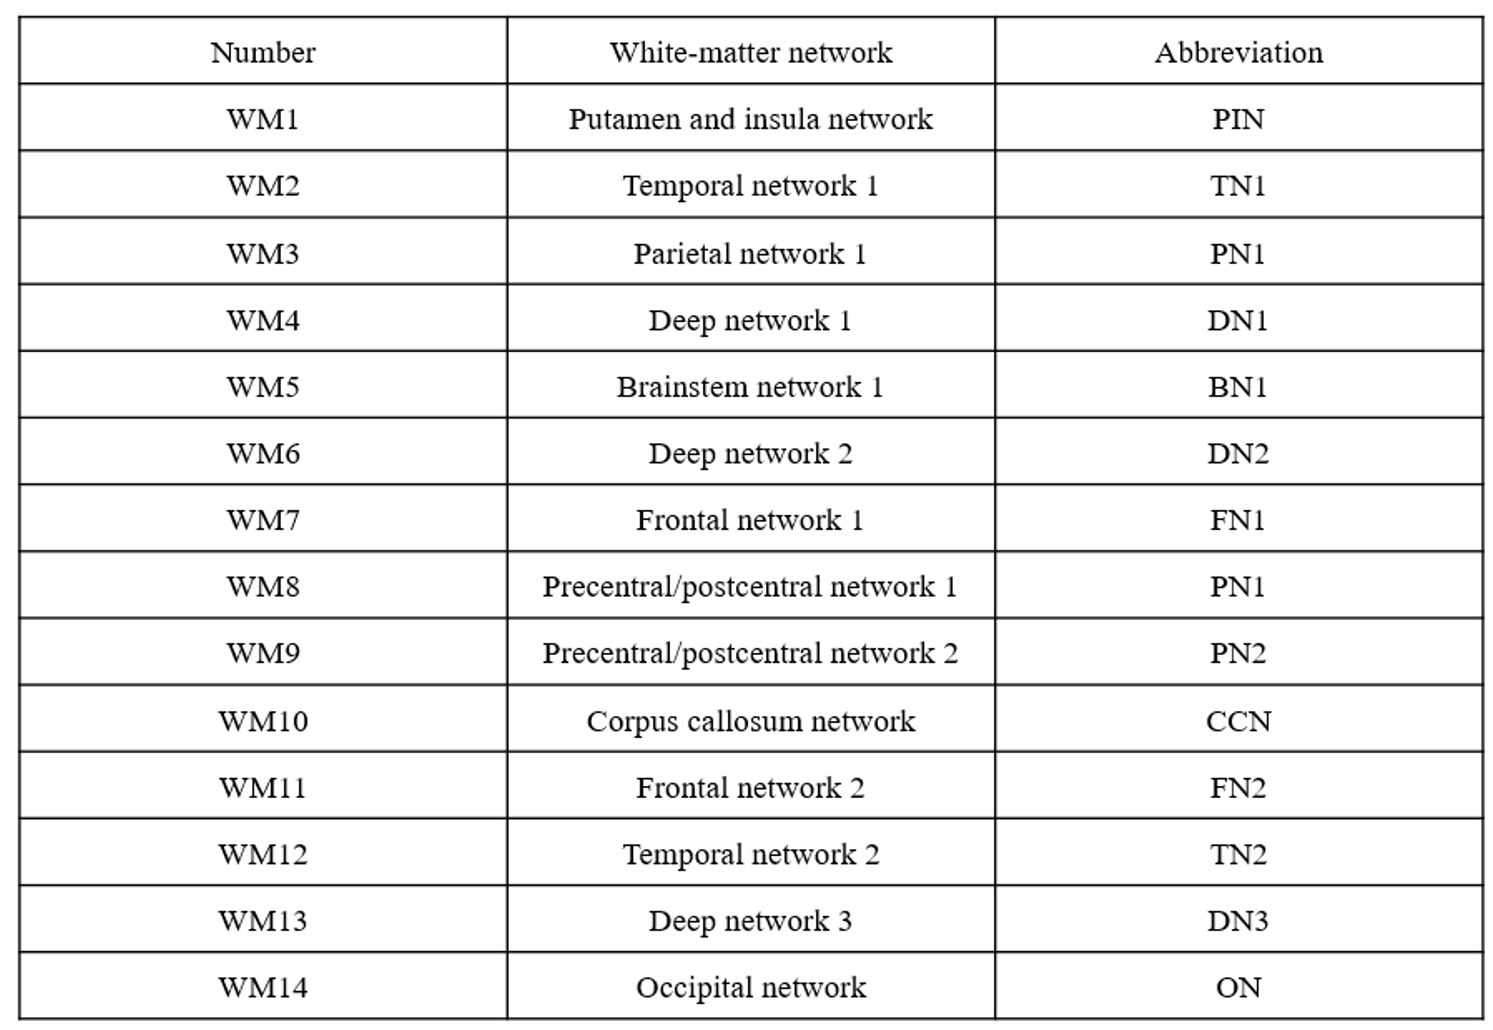
The calculation of Dice coefficient indicated that the K = 14 was the highest number with a high stability, as shown in Fig 1. (Dice coefficient > 0.85). The naming of 14 white- matter network was based on the spatial location (Fig 2). The detailed information of each white-matter network was illustrated in Table 1. The FC of WM1-WM12, WM1-WM14, WM2-WM11, WM11-WM12 and WM11-WM14 showed significant decrease in 2 patient groups, compared to HC group. A decreasing trend (not significant) was also found between LID and noLID group. FC between WM2 and WM11 in LID group showed a significantly positive correlation with MMSE, while a negative relation between FC and MMSE was found in noLID group.Conclusion
Patients with PD exhibit significant decrease of functional connectivity in specific white-matter networks, when comparing HC and PD group. When compared with noLID group, LID group showed a lower FC. FC within white-matter network showed different correlative result in LID and noLID group. The result showed that decreased FC between white-matter networks and their influence on clinical performance may indicated the appearance of PD and symptom of LID.Acknowledgements
No acknowledgement found.References
Peer, M., Nitzan, M., Bick, A. S., Levin, N., & Arzy, S. (2017). Evidence for functional networks within the human brain's white matter. Journal of Neuroscience, 37(27), 6394-6407.Figures
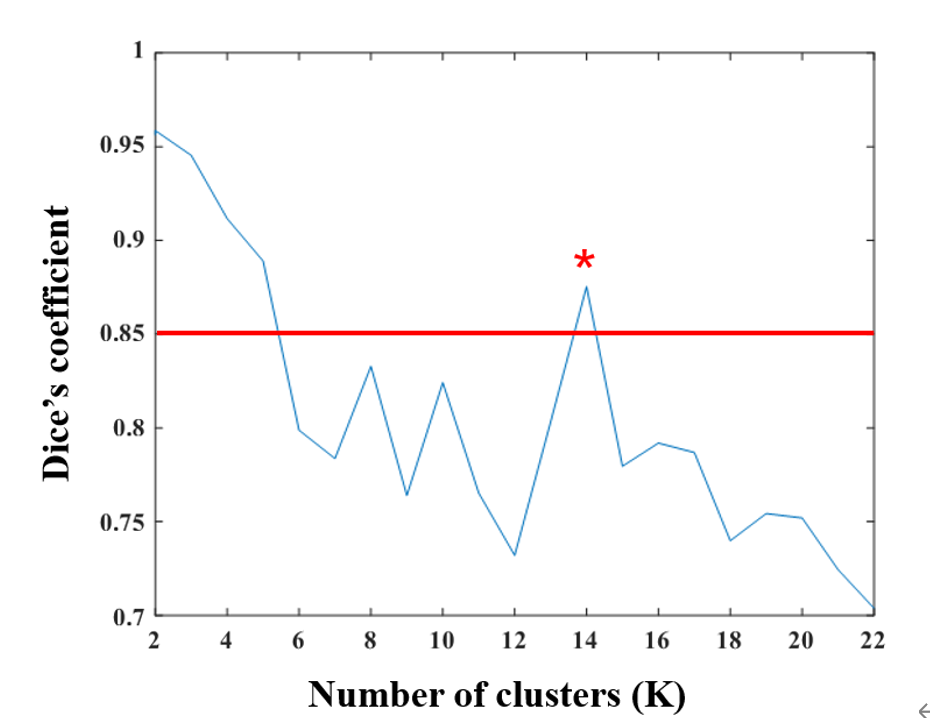
Fig 1. Calculation of clustering stability for each number of clusters (from 2 to 22)