4347
Simultaneous Dual-Band Saturation for Reduced FOV Neuromelanin Imaging at 7T1Siemens Medical Solutions USA, Inc., Jacksonville, FL, United States, 2Radiology Department, Mayo Clinic in Florida, Jacksonville, FL, United States
Synopsis
Keywords: Parkinson's Disease, Parkinson's Disease, 7T; Neuromelanin imaging; reduced FOV
Motivation: In neuromelanin (NM) imaging at 7T, placing bilateral sagittal saturation bands near the midbrain can mitigate ghosting artifacts and provide equivalent MT contrast compared to traditional MT pulses.
Goal(s): To present the feasibility of a proposed simultaneous dual-band saturation scheme to provide MT contrast in NM imaging at 7T.
Approach: Simultaneous dual-band saturation pulse was designed for the proposed simultaneous saturation scheme. Its performance in providing MT contrast was compared to the conventional sequential scheme for 3D GRE- and PETRA-based in-vivo NM imaging.
Results: The proposed simultaneous dual-band saturation schemes yielded favorable contrast between the NM-rich SNpc and the surrounding tissues.
Impact: The proposed simultaneous dual-band saturation scheme can provide symmetric saturation and MT effects in high-resolution rFOV NM imaging at 7T. The proposed scheme may also work for efficient out-of-volume suppression for MRS and blood suppression in certain MR applications.
Introduction
Recent studies from our team have shown that placing bilateral sagittal saturation bands near the midbrain can mitigate ghosting artifacts induced by field variation and blood flow pulsation in neuromelanin (NM) imaging at 7T. The resulting reduced-field-of-view can also enable higher resolution NM imaging. However, the vendor provided saturation bands are played sequentially, resulting in unsymmetric MT and saturation effects for each band. To achieve equivalent saturation and to maximize MT effects, we developed a simultaneous saturation scheme with a simultaneous dual-band saturation pulse[1-3]. In this work, we present the feasibility of the proposed simultaneous dual-band saturation scheme and compare its MT effect to the conventional sequential scheme for 3D GRE- and PETRA-based NM imaging at 7T.Methods
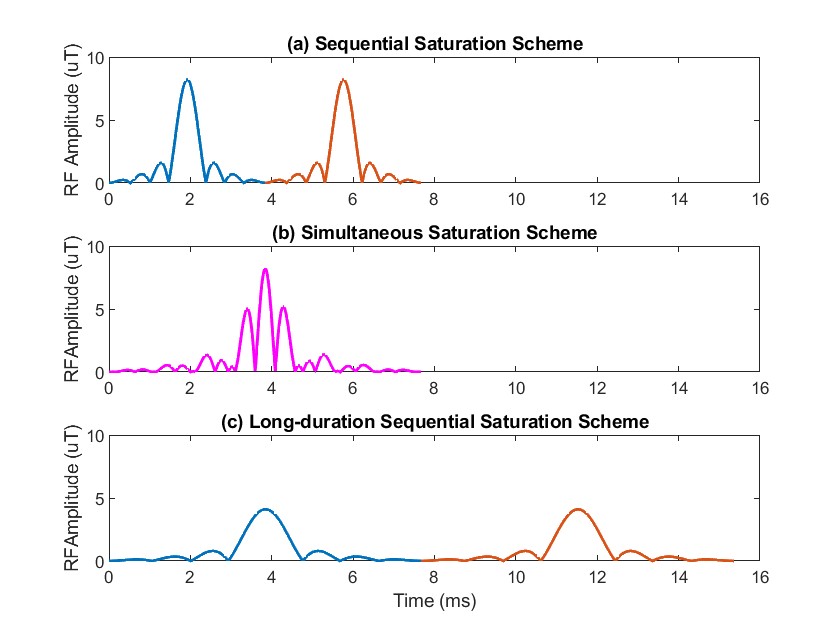
Pulse design for saturation schemesIn the conventional sequential saturation scheme, two vendor-defined single-band 90° saturation pulses with BW=2kHz and duration=3.84ms were played sequentially (Figure 1a), with identical amplitude waveforms but different frequency modulation according to their band locations.
In the proposed simultaneous saturation scheme, a dual-band saturation pulse was designed by arithmetically summing the two single-band pulses used in the sequential scheme. The duration of this summed dual-band saturation pulse was then doubled, and its amplitude was reduced by half accordingly. The final design was shown in Figure 1b. The doubled pulse length had two purposes: one was to match the total saturation duration needed by the original sequential scheme; the other was to reduce the pulse's peak amplitude and power to match the original single-band pulses in the sequential scheme. Most importantly, the SAR of the simultaneous dual-band scheme was reduced by half comparing to the conventional sequential scheme. Since doubling of the pulse duration also reduces the bandwidth of the dual-band pulse by half, the frequency offset of the dual-band pulses in the simultaneous scheme was also halved compared to the sequential scheme for identical sat-band locations. For fair comparison, another sequential scheme was implemented with single-band saturation pulses whose durations were doubled to get the same offset frequency as the simultaneous dual-band pulse. This scheme was termed “long-sequential scheme” for its doubled pulse duration and shown in Figure 1c.
In vivo scan
In compliance with local institutional regulations, volunteer scans were performed on the investigational pTx side of a 7T MAGNETOM Terra (Siemens Healthcare, Erlangen, Germany) equipped with an investigational Nova 8Tx/32Rx head coil (Nova Medical Inc., Wilmington, MA, USA) under TrueForm B1 shimming mode. NM imaging with bilateral sagittal saturation bands was performed both with GRE- and PETRA-based sequences, and with sequential, simultaneous, and long-sequential saturation schemes. The reduced FOV 3D GRE sequence had: FOV=80×80mm2, slice thickness=1.5mm, TR/TE=82/2.79ms, FA=15°, matrix=192×192, interpolated resolution= 0.2×0.2mm2, iPAT factor=3(PE), 56 slices with slab selective excitation. The PETRA sequence had: FOV= 218×218×218mm3, TR/TE=8/0.07ms, FA=6°, resolution= 0.3×0.3×0.3mm3, radial views=44000. For both sequences, the FOV center was placed at the level of the substantia nigra pars compacta (SNpc). The bilateral sagittal saturation bands were 70 mm thick and placed 70 mm to the midline. Both the bandwidth and frequency offset of the saturation pulses were 2 kHz for the conventional sequential scheme, and 1k Hz for the simultaneous and long-sequential schemes. For all scans, a third 80 mm axial saturation band was placed 60mm below the SNpc to suppress the incoming arterial blood signal. For each scan, the relative contrast was calculated as (SSNpc-SCP)/ SSNpc, where SSNpc and SCP were the mean signal intensity in ROIs on the SNpc and the cerebellar peduncle (CP), respectively.
Results
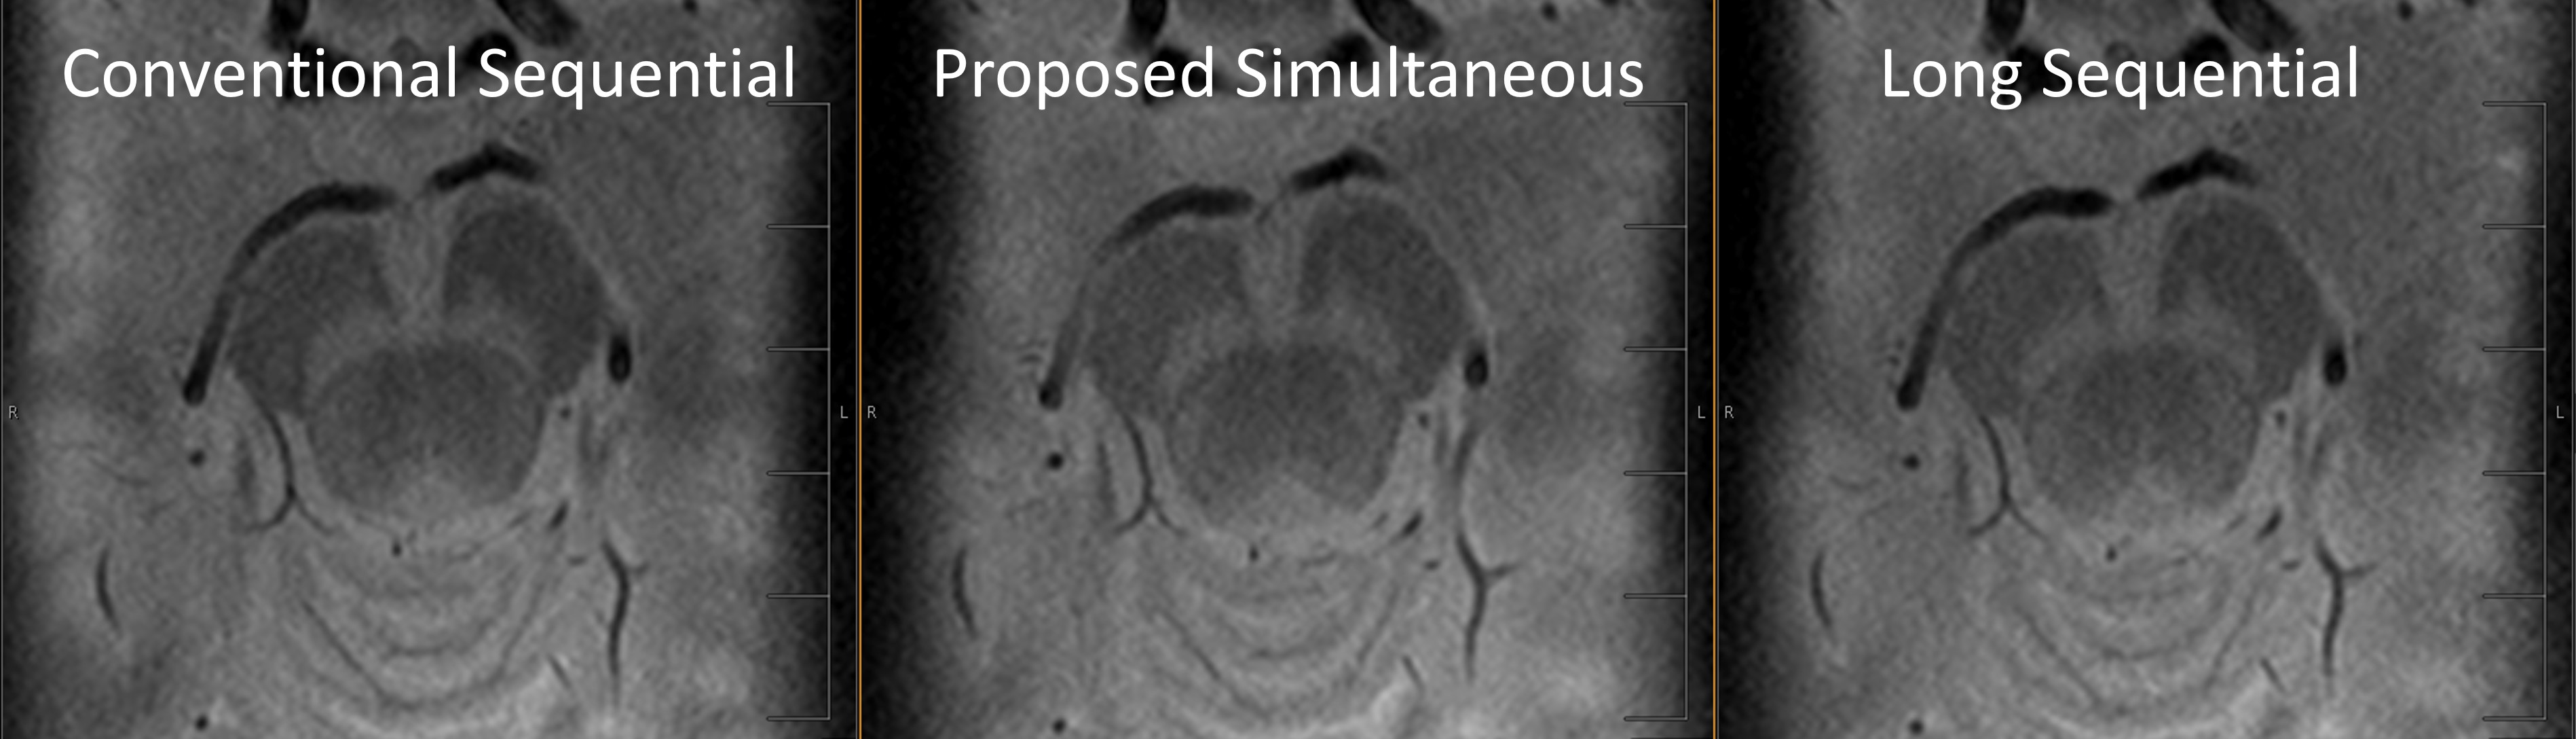
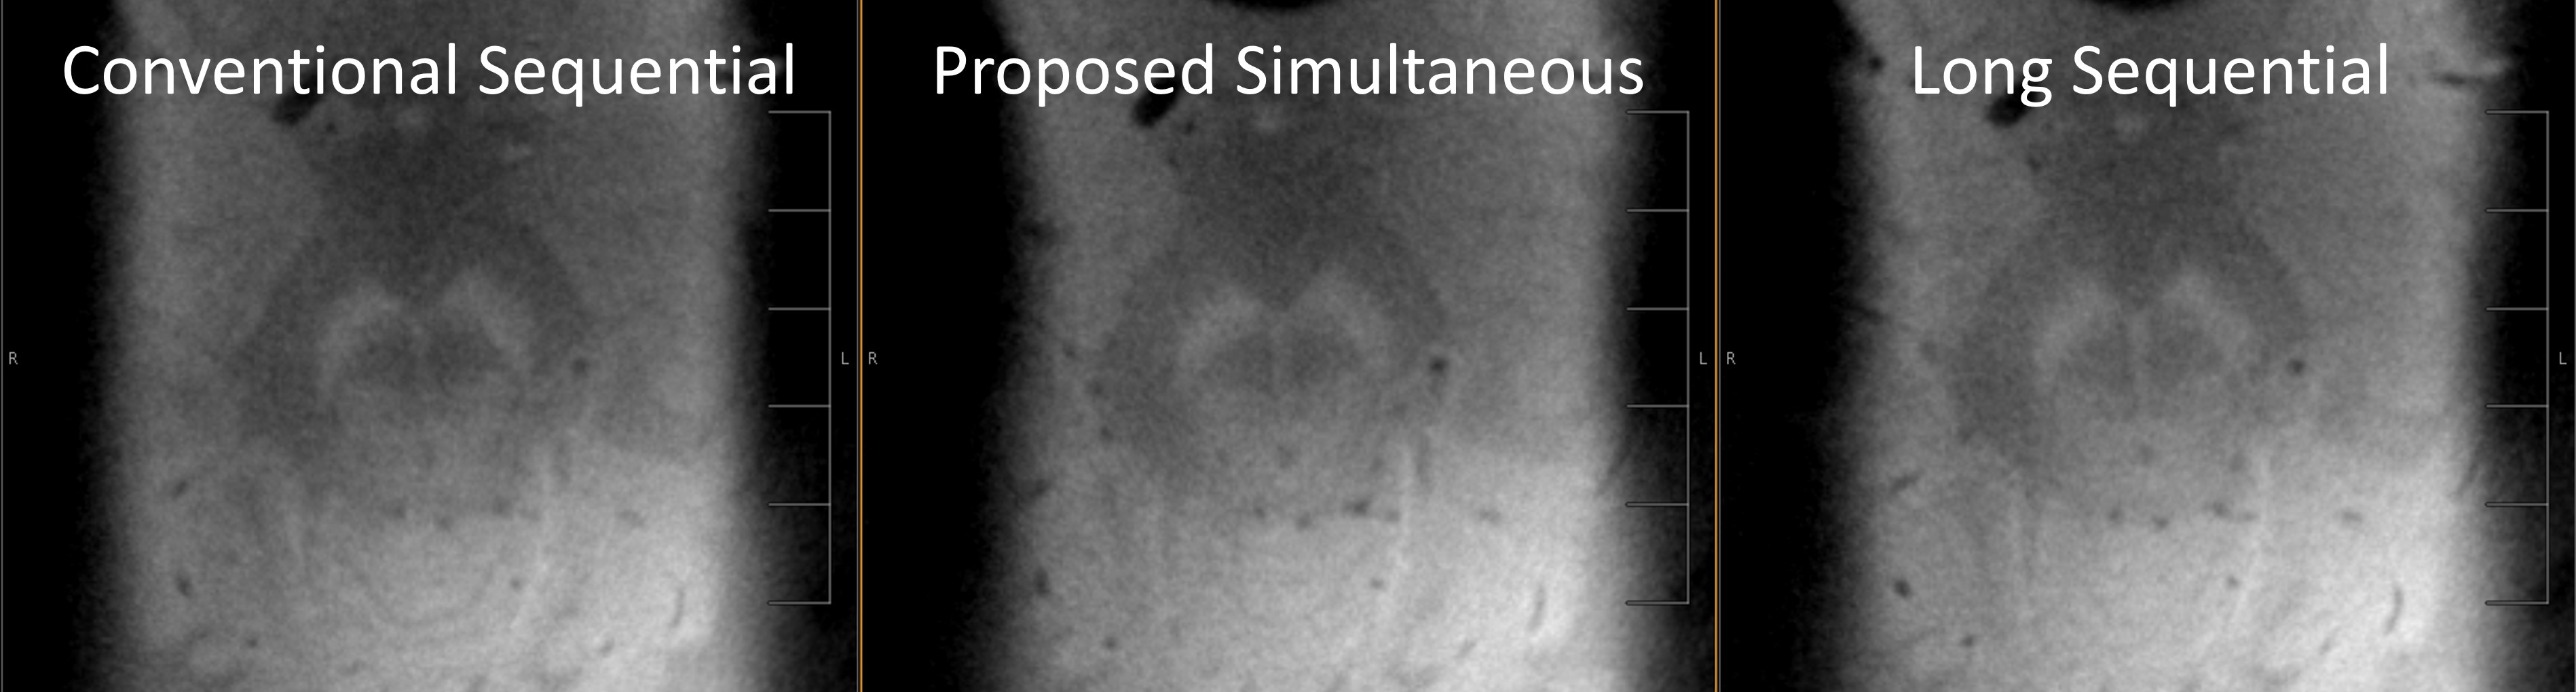
All three saturation schemes yielded favorable contrast between the NM-rich SNpc and the surrounding tissues. Figure 2 presents a comparison between images acquired using the 3D GRE sequence with the three saturation schemes: sequential (left), simultaneous (middle), and long-sequential (right). The relative contrast between SNpc and CP was 26.4%, 21.1%, and 21.3%, respectively. Figure 3 presents a comparison between images acquired using the PETRA sequence with the three pulse schemes: sequential (left), simultaneous (middle), and long-sequential (right). The relative contrast between SNpc and CP was 15.5%, 12.8%, and 13.4%, respectively.Discussion and Conclusion
This study demonstrates the feasibility of simultaneous dual-band saturation for NM imaging at 7T. The NM contrasts are comparable between the conventional, simultaneous, and long-sequential schemes. In addition, the reduced SAR from the simultaneous dual-band pulse allows reduced scan time for both GRE and PETRA. Further optimization is needed for the dual-band saturation pulse to maximize the MT effects for NM imaging at 7T. The proposed simultaneous dual-band saturation scheme may also work for efficient out-of-volume suppression for MRS and simultaneous arterial and venous blood suppression in certain MR applications.Acknowledgements
No acknowledgement found.References
1. Larkman, David J., et al. "Use of multicoil arrays for separation of signal from multiple slices simultaneously excited." Journal of Magnetic Resonance Imaging: An Official Journal of the International Society for Magnetic Resonance in Medicine 13.2 (2001): 313-317.
2. Moeller, Steen, et al. "Multiband multislice GE‐EPI at 7 tesla, with 16‐fold acceleration using partial parallel imaging with application to high spatial and temporal whole‐brain fMRI." Magnetic resonance in medicine 63.5 (2010): 1144-1153.
3. Feinberg, David A., and Kawin Setsompop. "Ultra-fast MRI of the human brain with simultaneous multi-slice imaging." Journal of magnetic resonance 229 (2013): 90-100.
Figures