4345
Increase in Cerebral Oxygen Extraction Fraction in Early Parkinson’s Patients1Health Science and Technology, UNIST, Ulsan, Korea, Republic of, 2Department of Biomedical Engineering, UNIST, Ulsan, Korea, Republic of, 3Department of Biomedical Engineering, University at Buffalo, The State University of New York, Buffalo, NY, United States, 4Department of Radiology, Athinoula A. Martinos Center for Biomedical Imaging, Charlestown, MA, United States
Synopsis
Keywords: Parkinson's Disease, Parkinson's Disease
Motivation: Parkinson's disease is the fastest growing neurological disorder. However, comorbidities of the disease complicates its diagnosis and creates need for the discovery more biomarkers to help with diagnosis.
Goal(s): Our aim is to noninvasively measure the cerebral oxygen extraction fraction which is an important metric for cerebral oxygen metabolism and see if it can be utilized as a biomarker for early Parkinson's Disease.
Approach: MRI scans from early Parkinson's patients and healthy controls were obtained. Oxygen extraction fraction (OEF) maps for subjects were generated and two groups' oxygen metabolism was compared.
Results: An overall increase in cerebral OEF was observed for Parkinson's patients.
Impact: This study will potentially help with the diagnosis of early Parkinson's by providing another quantifiable biomarker. Additionally, difference in oxygen metabolism can help to understand Parkinson's disease better.
Introduction
Parkinson’s disease is the fastest growing neurological disorder with the number of patients doubling between 1990 and 2015 to over 6 million. This number is projected to double to 12 million by 2040.1 This evidently results in a large socioeconomic burden, in the US economic burden of Parkinson’s Disease is estimated as $51.9 Billion, more than tripling from the 2010 burden of $14.4 Billion, and estimated to be $79 Billion by 2037.2 Pathologically, Parkinson’s disease is defined by the accumulation of α-synuclein in Lewy bodies and Lewy neurites.3 However, the presence of comorbidities complicates the diagnostic process, and up to 15% percent of people with the disease are diagnosed incorrectly.4 One of the early biomarkers of Parkinson’s disease is the abnormalities in cerebral metabolic rates.5, 6 Metrics of cerebral oxygen metabolism such as cerebral metabolic rate of oxygen (CMRO2) or oxygen extraction fraction (OEF) are traditionally measured using positron emission tomography. Here, we use a noninvasive method of measuring OEF based on recent research7 to find early biomarkers of Parkinson’s disease.Method
50 Parkinson’s patients (PD) (Age = 61.4 ± 4.2 (mean ± std), 23 Females, H-Y stage (2.08 ± 0.46), UPDRS motor (19.7 ± 6.9), MMSE (27.9 ±1.97)) and 30 healthy controls (HC) (Age = 56.4 10.9 (mean std), 15 Females) were included in the study. Subjects underwent MRI scanning at a 3-T scanner, a multi-echo gradient echo (mGRE) sequence was performed with the following parameters: image size = 192x192, slice number = 60, resolution = 1x1x2 mm, space between slices = 2.2mm, flip angle = 60°, TEs = 3.1, 8.0, 13.5, 19.0, 24.4, 30.0 ms, TR = 2.03 sec. OEF maps were generated using QQ CCTV method7. This method combines the quantitative blood oxygen level dependent (qBOLD) based OEF estimations8 with susceptibility based OEF estimations9 by using L2 regularization. Quantitative susceptibility maps for each subject were generated in native space using MEDI+0 algorithm which performs field-to-susceptibility inversion by using morphological information as prior and takes CSF susceptibility as zero reference. Then QQ CCTV method was applied which includes cluster analysis of time evolution (CAT) method which creates clusters based on signal characteristics and tissue type of voxels. Averaging clusters increases signal-to-noise ratio and combats noise sensitivity. Finally, total variation regularization is applied to help alleviate the propagation of measurement noise into the parameter map.7 The first echo magnitude image (TE = 3.1ms) was registered to MNI template using SPM12 software. Linear and non-linear transformation was performed, and the resulting transformation was applied to QSM and OEF maps for whole-brain and ROI analyses.Result
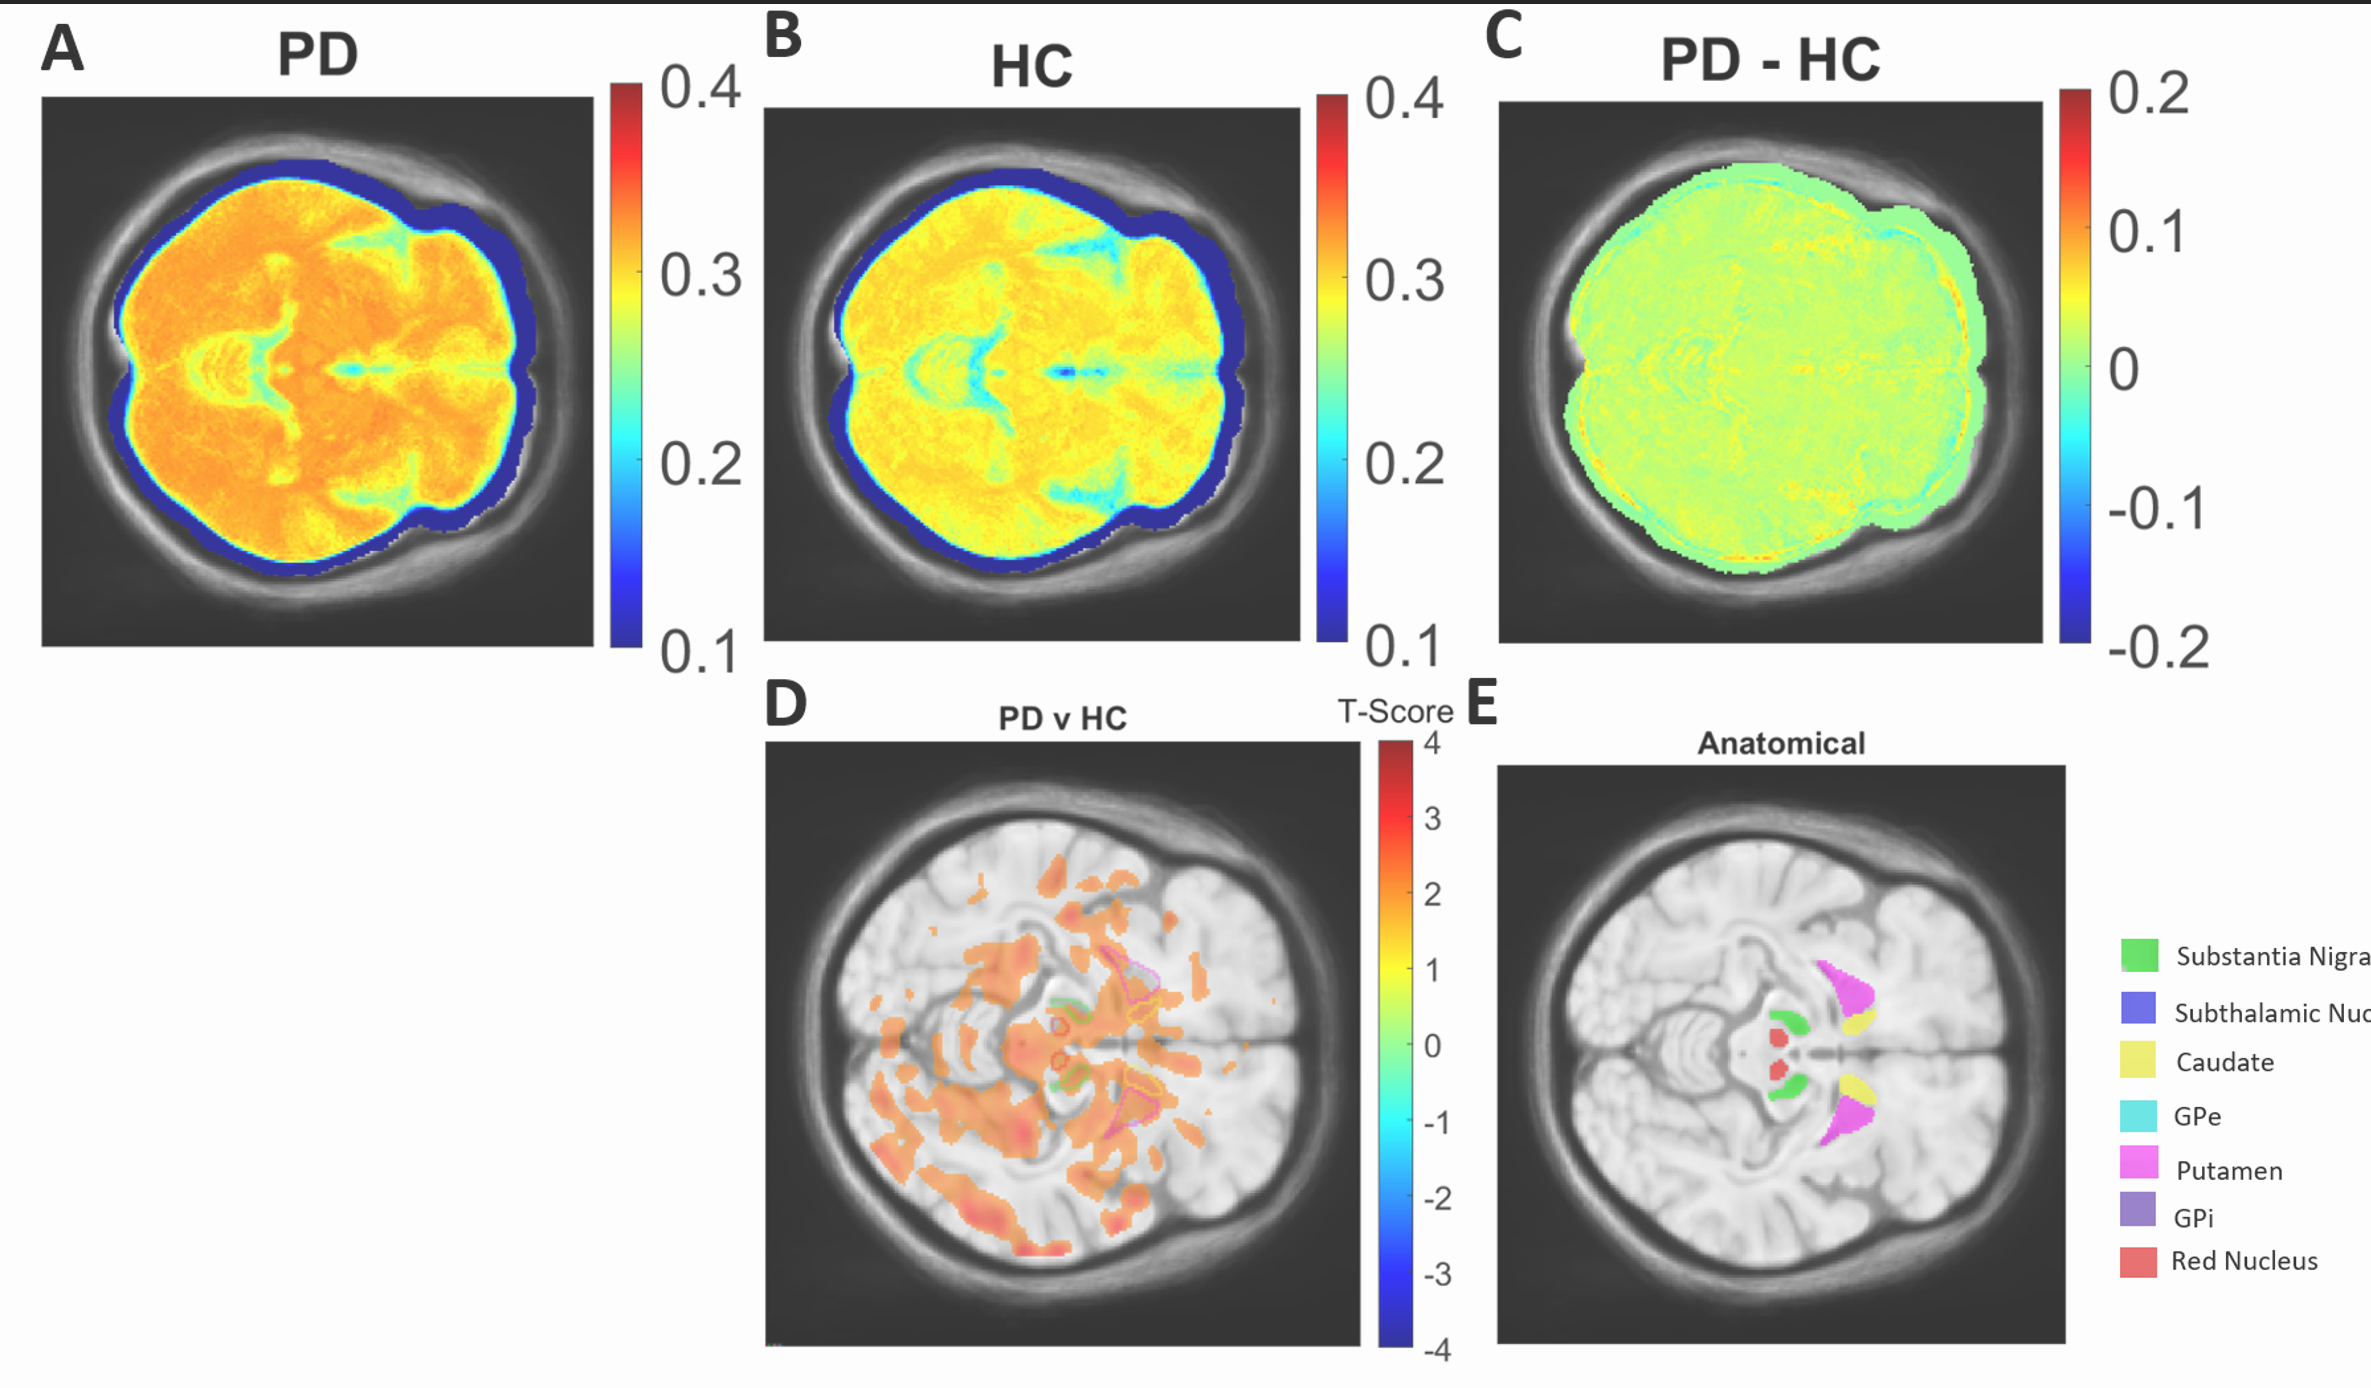
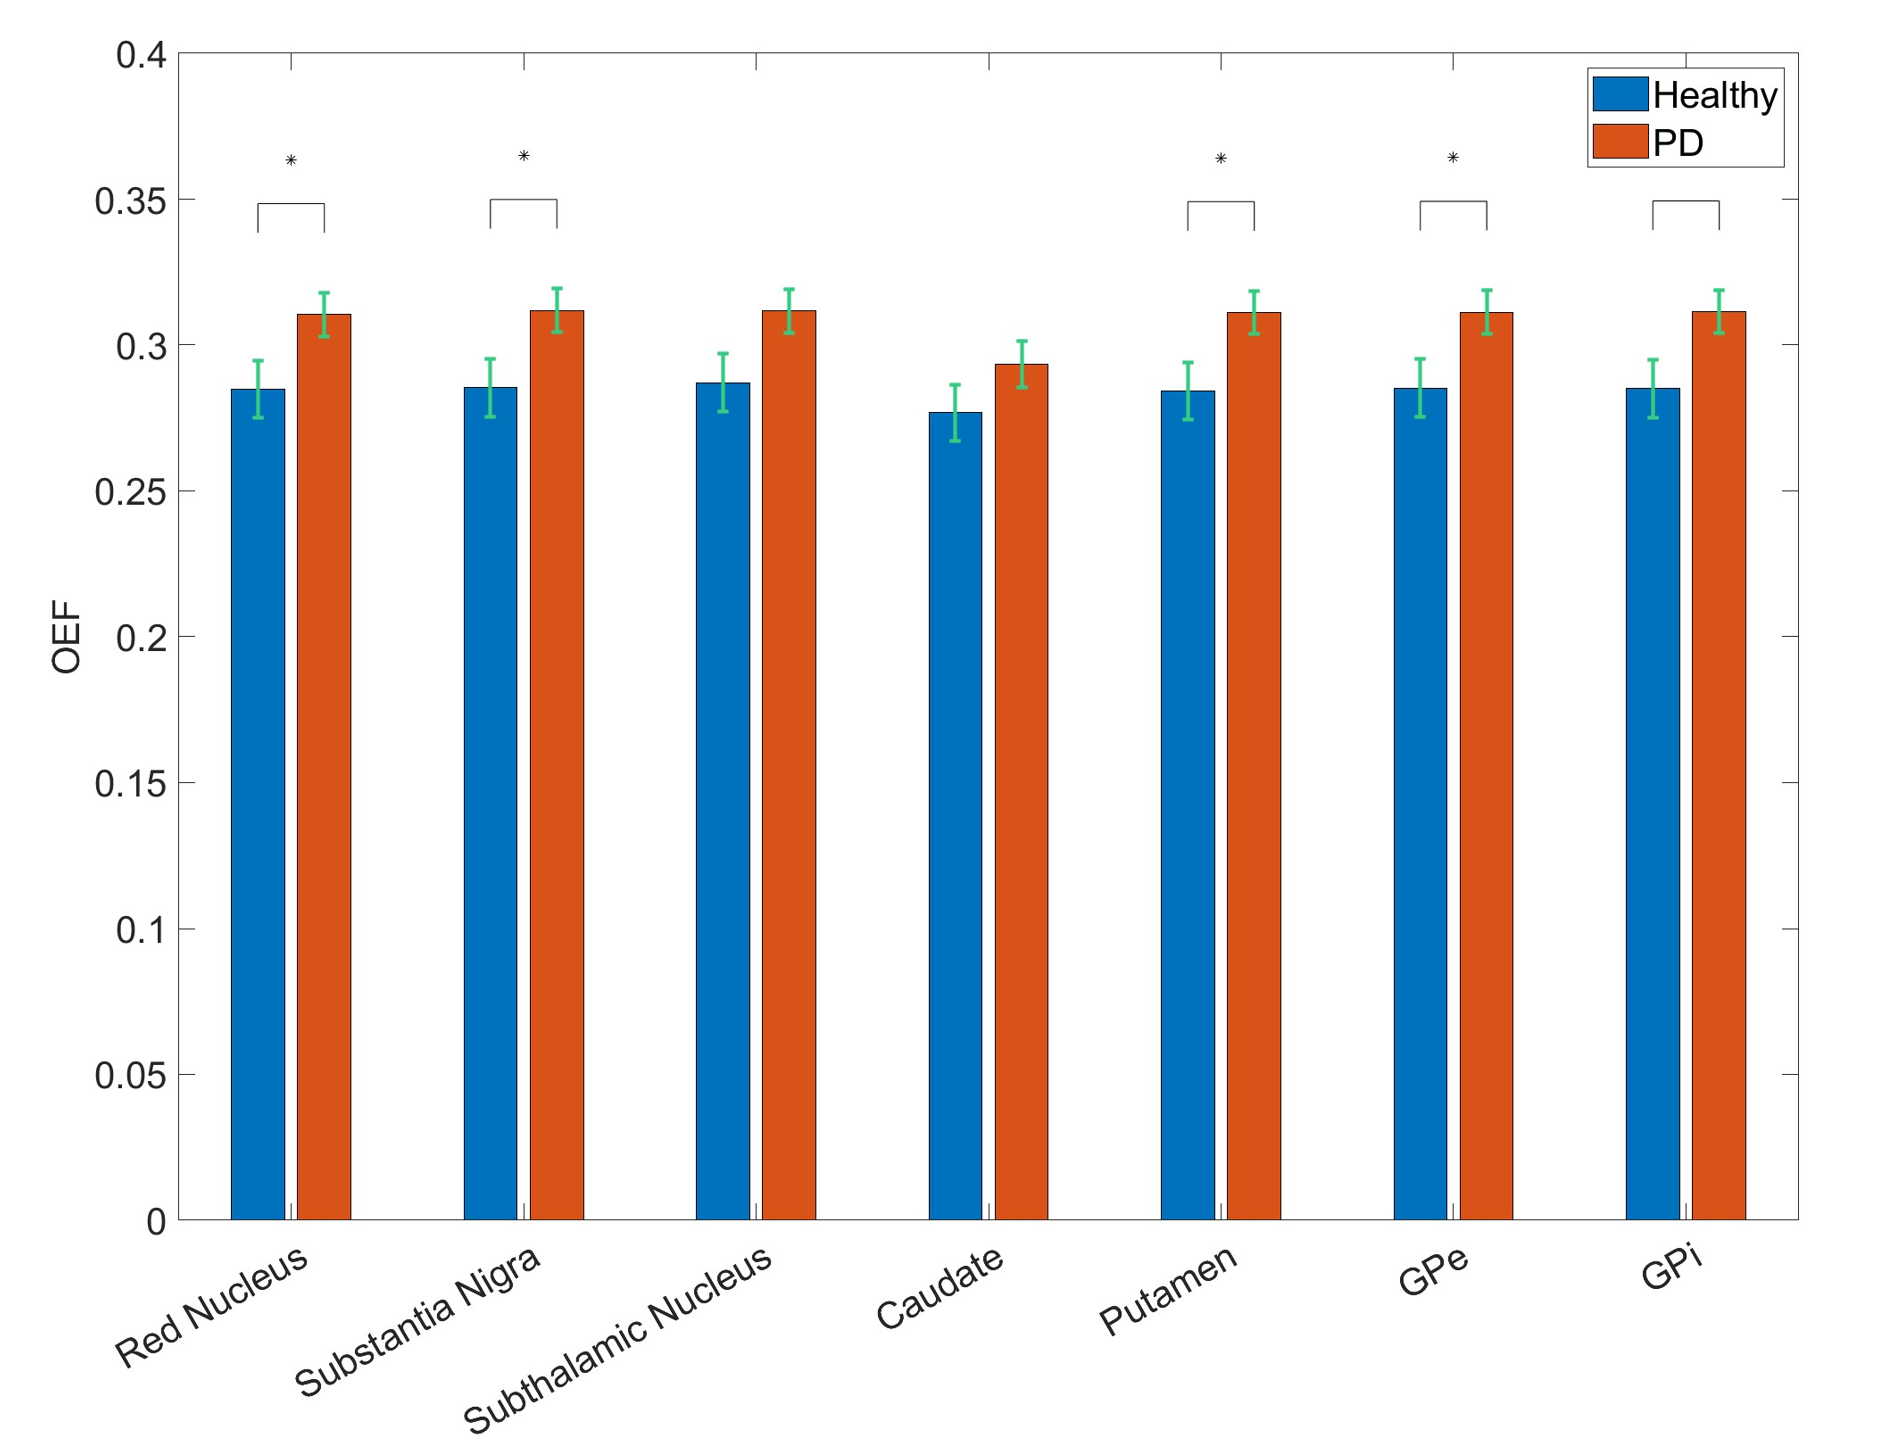
Based on visual inspection of group averaged OEF maps and the whole-brain analysis, a significant increase in overall OEF was observed in Parkinson’s patients compared to healthy controls.(Figure 1) This significant increase was also observed in ROI analyses of basal ganglia regions, OEF was significantly larger for Parkinson’s patients in Red Nucleus (HC = 0.285clip_image006.png"> 0.0074, t(78) = -2.15, p = 0.034). (Figure 2)Discussion
In this study, we have found that early-stage Parkinson’s patients have higher OEF values throughout different brain regions, including basal ganglia regions. The lack of specificity in the OEF increase may be attributed to the uniform nature of OEF10 or to the fact that Parkinson’s disease can be considered diffuse brain disease involving both cortical and subcortical structures11. Higher OEF in Parkinson’s patients may indicate an inefficiency in cellular respiration due to dysfunction of mitochondrial oxidative metabolism12.Acknowledgements
This work was supported by the National Research Foundation of Korea (NRF) grant (NRF-2018R1A6A1A03025810).References
1. Dorsey E, Sherer T, Okun MS, Bloem BR. The emerging evidence of the Parkinson pandemic. Journal of Parkinson's disease. 2018;8(s1):S3-S8.
2. Yang W, Hamilton JL, Kopil C, et al. Current and projected future economic burden of Parkinson’s disease in the US. npj Parkinson's Disease. 2020;6(1):15.
3. Bloem BR, Okun MS, Klein C. Parkinson's disease. The Lancet. 2021;397(10291):2284-2303.
4. Beach TG, Adler CH. Importance of low diagnostic Accuracy for early Parkinson's disease. Mov Disord. 2018;33(10):1551-1554.
5. Wu P, Wang J, Peng S, et al. Metabolic brain network in the Chinese patients with Parkinson's disease based on 18F-FDG PET imaging. Parkinsonism & related disorders. 2013;19(6):622-627.
6. Wolfson LI, Leenders KL, Brown LL, Jones T. Alterations of regional cerebral blood flow and oxygen metabolism in Parkinson's disease. Neurology. 1985;35(10):1399-1399.
7. Cho J, Spincemaille P, Nguyen TD, et al. Temporal clustering, tissue composition, and total variation for mapping oxygen extraction fraction using QSM and quantitative BOLD. Magnetic Resonance in Medicine. 2021;86(5):2635-2646.
8. Wang X, Sukstanskii AL, Yablonskiy DA. Optimization strategies for evaluation of brain hemodynamic parameters with qBOLD technique. Magnetic resonance in medicine. 2013;69(4):1034-1043.
9. Zhang J, Liu T, Gupta A, et al. Quantitative mapping of cerebral metabolic rate of oxygen (CMRO2) using quantitative susceptibility mapping (QSM). Magnetic resonance in medicine. 2015;74(4):945-952.
10. Hyder F, Herman P, Bailey CJ, et al. Uniform distributions of glucose oxidation and oxygen extraction in gray matter of normal human brain: no evidence of regional differences of aerobic glycolysis. Journal of Cerebral Blood Flow & Metabolism. 2016;36(5):903-916.
11. Braak H, Del Tredici K, Rüb U, et al. Staging of brain pathology related to sporadic Parkinson’s disease. Neurobiology of aging. 2003;24(2):197-211.
12. Powers WJ, Videen TO, Markham J, et al. Cerebral mitochondrial metabolism in early Parkinson's disease. Journal of Cerebral Blood Flow & Metabolism. 2008;28(10):1754-1760.
Figures