4339
A semi-data-driven cellular microstructural model considering cell size distribution in diffusion MRI1Center for Nano and Micro Mechanics, Department of Engineering Mechanics, Tsinghua University, Beijing, China, 2Center for Biomedical Imaging Research, Department of Biomedical Engineering, School of Medicine, Tsinghua University, Beijing, China, 3Department of Biomedical Engineering, Vanderbilt University, Nashville, TN, United States, 4Department of Radiology and Radiological Sciences, Vanderbilt University Medical Center, Nashville, TN, United States, 5Institute of Imaging Science, Vanderbilt University Medical Center, Nashville, TN, United States, 6Department of Physics and Astronomy, Vanderbilt University, Nashville, TN, United States
Synopsis
Keywords: Signal Modeling, Microstructure, quantitative microstructure imaging, signal modeling
Motivation: Incorporating the impact of cell size distribution is challenging in current dMRI-based microstructural imaging. All relevant models fail to provide an analytical signal expression, but instead replace the intracellular signal with the sum of signal terms corresponding to different cell diameters. Although this is intuitive, subsequent equations are usually ill-conditioned and hard to resolve.
Goal(s): To derive the analytical expression for dMRI signals and rebuild a cellular microstructural model.
Approach: We performed theoretical modelling based on simulated signals and validations on numerical simulations and in-vitro cell experiments.
Results: A semi-data-driven cellular microstructural model is proposed and it outperforms the published method.
Impact: This work provides the first analytical expression for dMRI signals while incorporating cell size distribution. The proposed microstructural model can extract not only accurate mean cell size, but also distribution information, which provides an additional biomarker for tumor monitoring.
Introduction
Diffusion MRI provides a non-invasive approach to probe microstructural information by utilizing the dependence of diffusion on different time scales1,2. The dMRI-based microstructural imaging has promoted in-vivo biological tissue studies3 and disease diagnosis4. Most methods defined one “mean” microstructural size (e.g. cell diameter d) to characterize the intra-voxel geometric feature, including VERDICT5 and IMPLUSED3,6. However, there are numerous cells in each voxel with “mm” resolution, and modeling with only a “mean” size will lose the actual cell size distribution, which may be a potential biomarker in clinical applications7.Some methods try to incorporate cell size distribution into biophysical models. They fail to provide analytical expressions for dMRI signals, and instead replace the intracellular signal $$$S_{i n}$$$ with the sum of signal terms corresponding to different diameters7-10:
$$S_{i n}=\sum_{i=1}^N \rho_{v w}\left(d_i\right) \exp \left(-b \cdot A D C_r\left(d_i\right)\right) \Delta d\tag{1}$$
where $$$\rho_{v w}(d)$$$ is the unknown volume-weighted cell size distribution function. This strategy is intuitive and its computational accuracy depends on the discretization degree of the range of d value. Typically, the number of discrete segments is greater than the number of dMRI acquisitions. Then the equations are ill-conditioned and additional constraints have to be introduced, but this in turn leads to additional bias7,9.
In this work, we obtain the analytical signal expression, and then a semi-data-driven cellular microstructural model is proposed to simultaneously estimate the mean $$$\bar{d}$$$ and variance $$$\sigma^2$$$ of cell size distribution. The validations on numerical simulations and in-vitro cell experiments demonstrate the accuracy and feasibility of this method.
Theory
We first defined a dimensionless parameter $$$K=A D C_r^* / A D C_r$$$, which is the ratio of the revised intracellular apparent diffusion coefficient when considering cell size distribution $$$A D C_r^*$$$ and the original $$$A D C_r$$$. We assumed that the cell size distribution obeys a Gamma function. For a given acquisition sequence, three dimensionless variables related to K were extracted based on dimensional analysis:$$\alpha=b \cdot A D C_r ; \beta=\frac{A D C_r}{D_{i n}} ; \gamma=\frac{\sigma}{\bar{d}}\tag{2}$$
Then we simulated $$$S_{i n}$$$ under different sets of variables ($$$\alpha, \beta, \gamma$$$) by numerical calculations, and further calculated $$$A D C_r^*$$$ and K. We found an approximately linear relationship between K and $$$\alpha$$$, then $$$K(\alpha, \beta, \gamma)$$$ can be expressed as:
$$K(\alpha, \beta, \gamma)=1+f(\beta, \gamma) \cdot \alpha+g(\beta, \gamma)\tag{3}$$
where $$$f(\beta, \gamma)$$$ and $$$g(\beta, \gamma)$$$ are auxiliary functions, which can be obtained by binary polynomial fitting. Then we have:
$$S_{i n}=\exp \left(-(1+g(\beta, \gamma)) \cdot b \cdot A D C_r-f(\beta, \gamma) b^2 A D C_r^2\right)\tag{4}$$
where a quadratic term on b-value like “kurtosis‘’-term appears. For extracellular signal $$$S_{e x}$$$, the impact of cell size distribution is assumed to be negligible, the overall signals are obtained by the two-compartment model:
$$S=v_{i n} S_{i n}+\left(1-v_{i n}\right) S_{e x}\tag{5}$$
Methods
Signals generated from Eqs. (1) and (5) were used to evaluate the proposed model. The acquisition and microstructural parameters are shown in Tables 1 and 2. A set of retrospective data from in-vitro cell experiments was also used for evaluation11. We compared our method with MRI-cytometry7.All numerical fittings are implemented by “Curve Fitting Toolbox 3.8” of MATLab. For a given new sequence, we need to re-determine the auxiliary functions $$$f(\beta, \gamma)$$$ and $$$g(\beta, \gamma)$$$ based on dMRI data generated by Eq. (1). Therefore, this cellular microstructural model is considered “semi-data-driven” (SDD). Furthermore, to improve the robustness against noise, we combined the non-linear-fitting method with AMICO framework to fit the proposed model. All computations were performed in MATLab R2022a.
Results
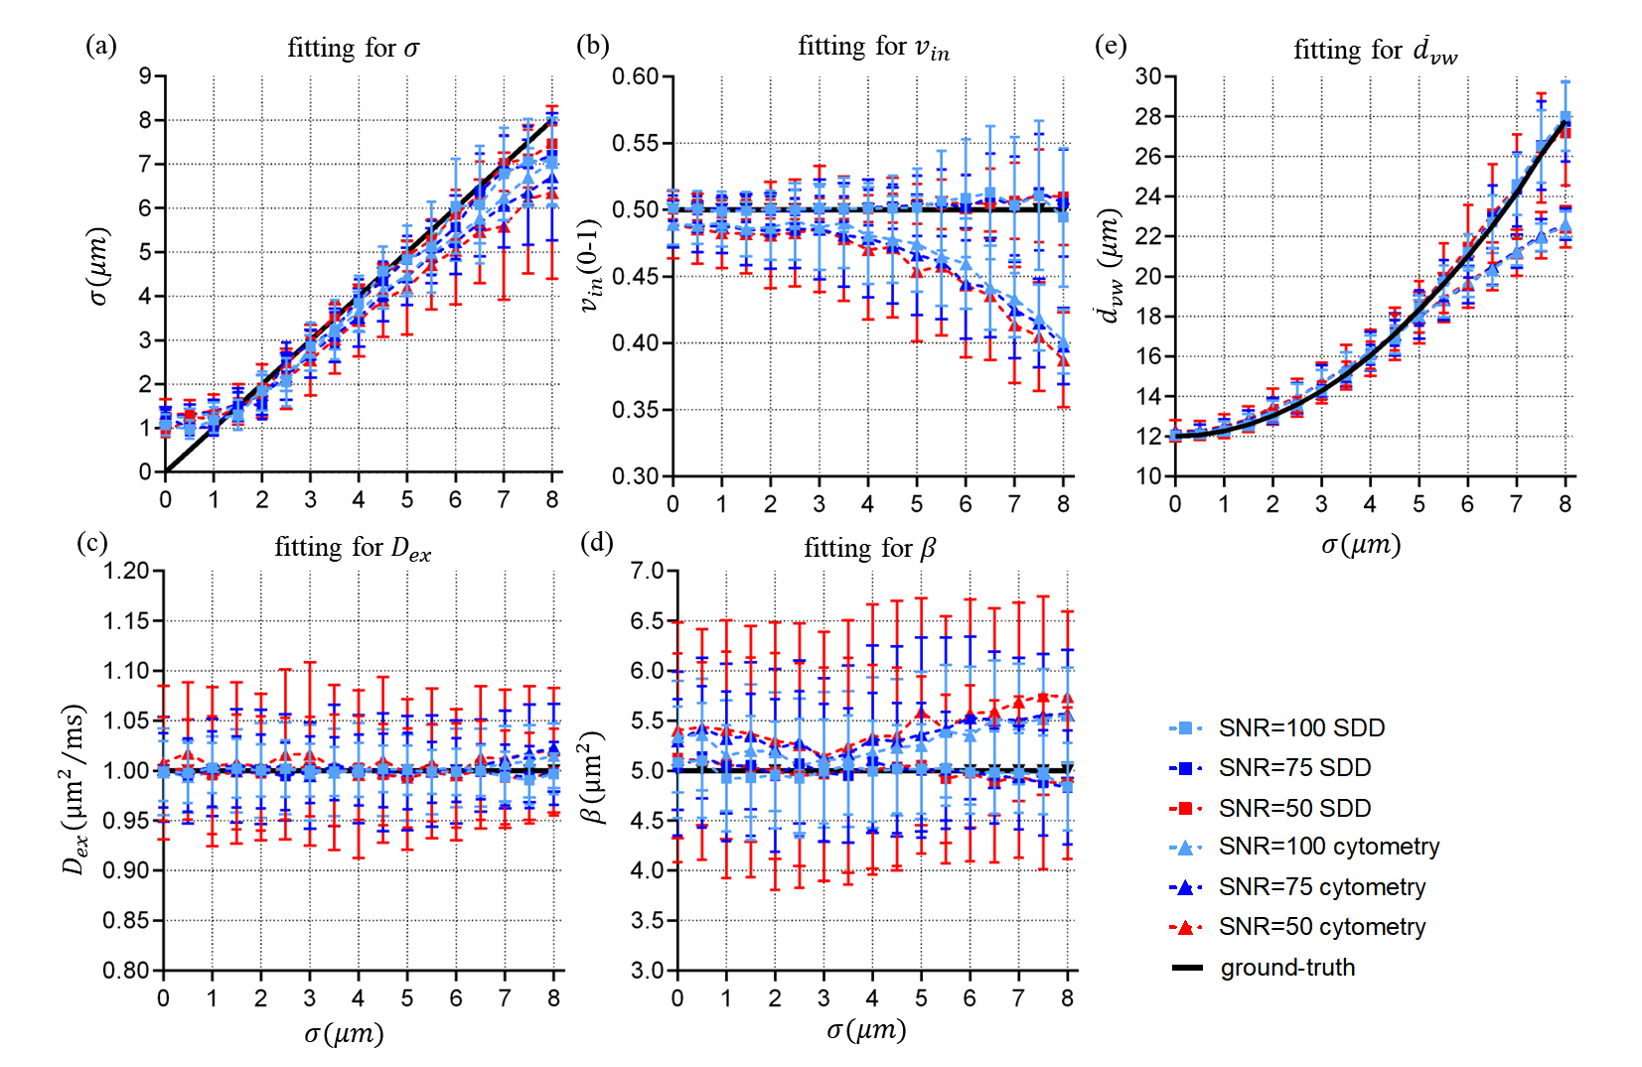
Fig. 1 shows the results of MRI-cytometry and proposed SDD model in simulations without noise. The values of $$$\bar{d}_{v w}$$$, $$$\sigma$$$, and $$$v_{i n}$$$ fitted by SDD match the ground-truths better. In constrast, MRI-cytometry underestimates $$$\bar{d}_{v w}$$$ and $$$v_{i n}$$$ for larger $$$\sigma$$$ settings and overestimates $$$\sigma$$$ for smaller $$$\sigma$$$ settings.Fig. 2 shows the impact of noise on the performances of the solvers. The robustness of MRI-cytometry and SDD is comparable, but SDD shows better accuracy.
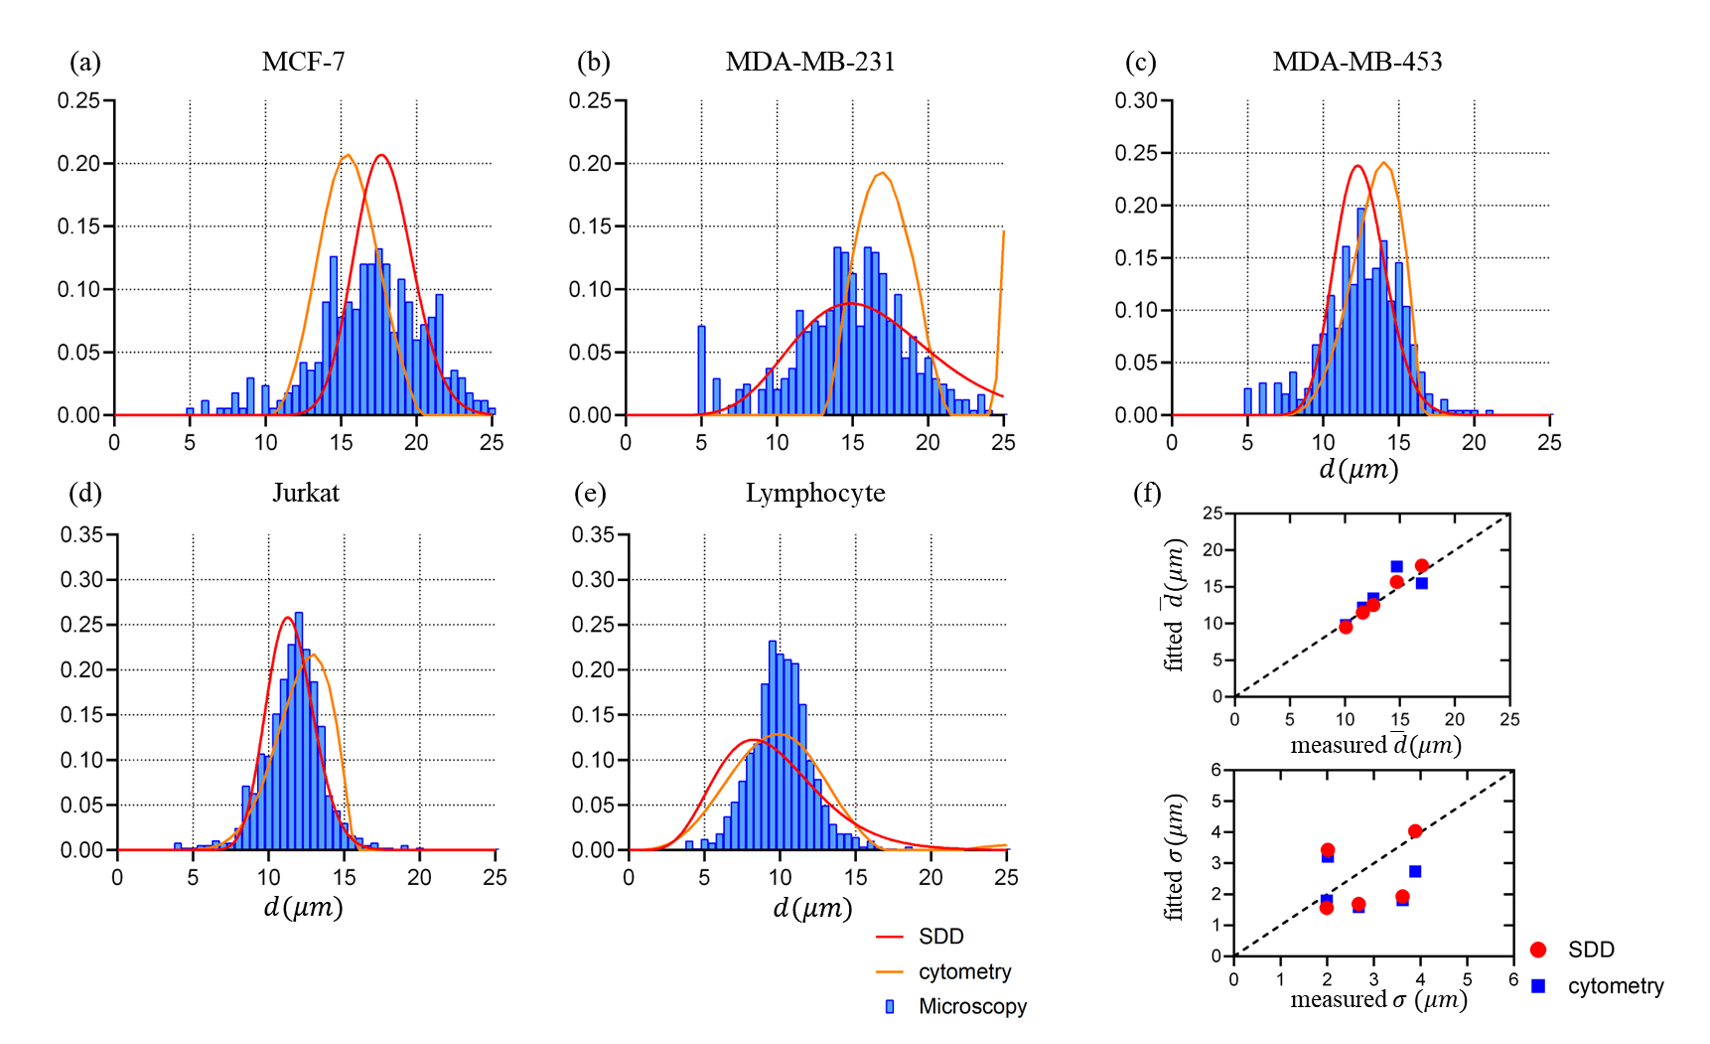
Fig. 3 demonstrates the results of in-vitro cell experiments. The distribution curves obtained by SDD are more consistent with the histological ground-truths, and the fitted $$$\bar{d}$$$ and $$$\sigma$$$ match the values measured by light-microscopy better.
Discussion and Conclusion
In this work, a new semi-data-driven cellular microstructural model was proposed to estimate intra-voxel cell size distribution and provide quantitative microstructural information. Numerical simulations and in-vitro cell experiments initially validated the accuracy and feasibility of this model. The results indicate that the proposed model may provide an additional biomarker for tumor monitoring. Further validations on cancer patients are expected to better evaluate the clinical value of this method.Acknowledgements
No acknowledgement found.References
1. Gore JC, Xu J, Colvin DC, Yankeelov TE, Parsons EC, Does MD. Characterization of tissue structure at varying length scales using temporal diffusion spectroscopy. Nmr Biomed 2010;23(7):745-756.
2. Novikov DS, Fieremans E, Jespersen SN, Kiselev VG. Quantifying brain microstructure with diffusion MRI: Theory and parameter estimation. Nmr Biomed 2019;32:e3998.
3. Jiang X, Li H, Xie J, Zhao P, Gore JC, Xu J. Quantification of cell size using temporal diffusion spectroscopy. Magn Reson Med 2016;75(3):1076-1085.
4. Xu J, Jiang X, Li H, Arlinghaus LR, Gore JC. Magnetic resonance imaging of mean cell size in human breast tumors. Magn Reson Med 2019;83(6):2002-2014.
5. Panagiotaki E, Walker-Samuel S, Siow B, et al. Noninvasive quantification of solid tumor microstructure using VERDICT MRI. Cancer Research 2014;74(7):1902.
6. Jiang X, Li H, Xie J, et al. In vivo imaging of cancer cell size and cellularity using temporal diffusion spectroscopy. Magn Reson Med 2016.
7. Xu J, Jiang X, Devan SP, et al. MRI-cytometry: Mapping nonparametric cell size distributions using diffusion MRI. Magn Reson Med 2021;85(2):748-761.
8. Assaf Y, Blumenfeld-Katzir T, Yovel Y, Basser PJ. Axcaliber: A method for measuring axon diameter distribution from diffusion MRI. Magn Reson Med 2008;59(6):1347-1354.
9. Benjamini D, Komlosh ME, Holtzclaw LA, Nevo U, Basser PJ. White matter microstructure from nonparametric axon diameter distribution mapping. Neuroimage 2016;135:333-344.
10. Shemesh N, Álvarez GA, Frydman L. Size Distribution Imaging by Non-Uniform Oscillating-Gradient Spin Echo (NOGSE) MRI. PLoS One 2015;10(7):e0133201.
11. Li H, Jiang X, Xie J, Gore JC, Xu J. Impact of transcytolemmal water exchange on estimates of tissue microstructural properties derived from diffusion MRI. Magn Reson Med 2017;77(6):2239-2249.
Figures
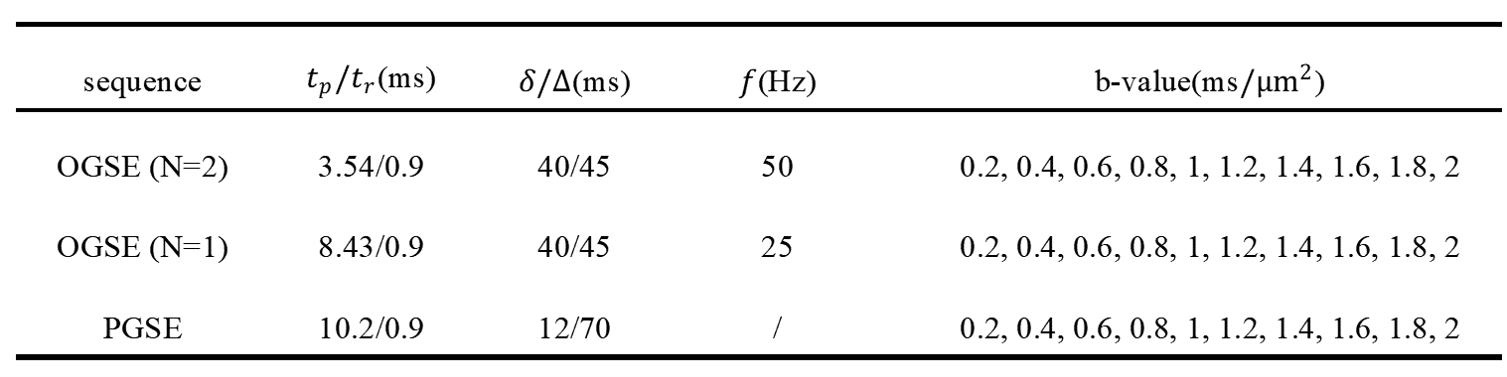

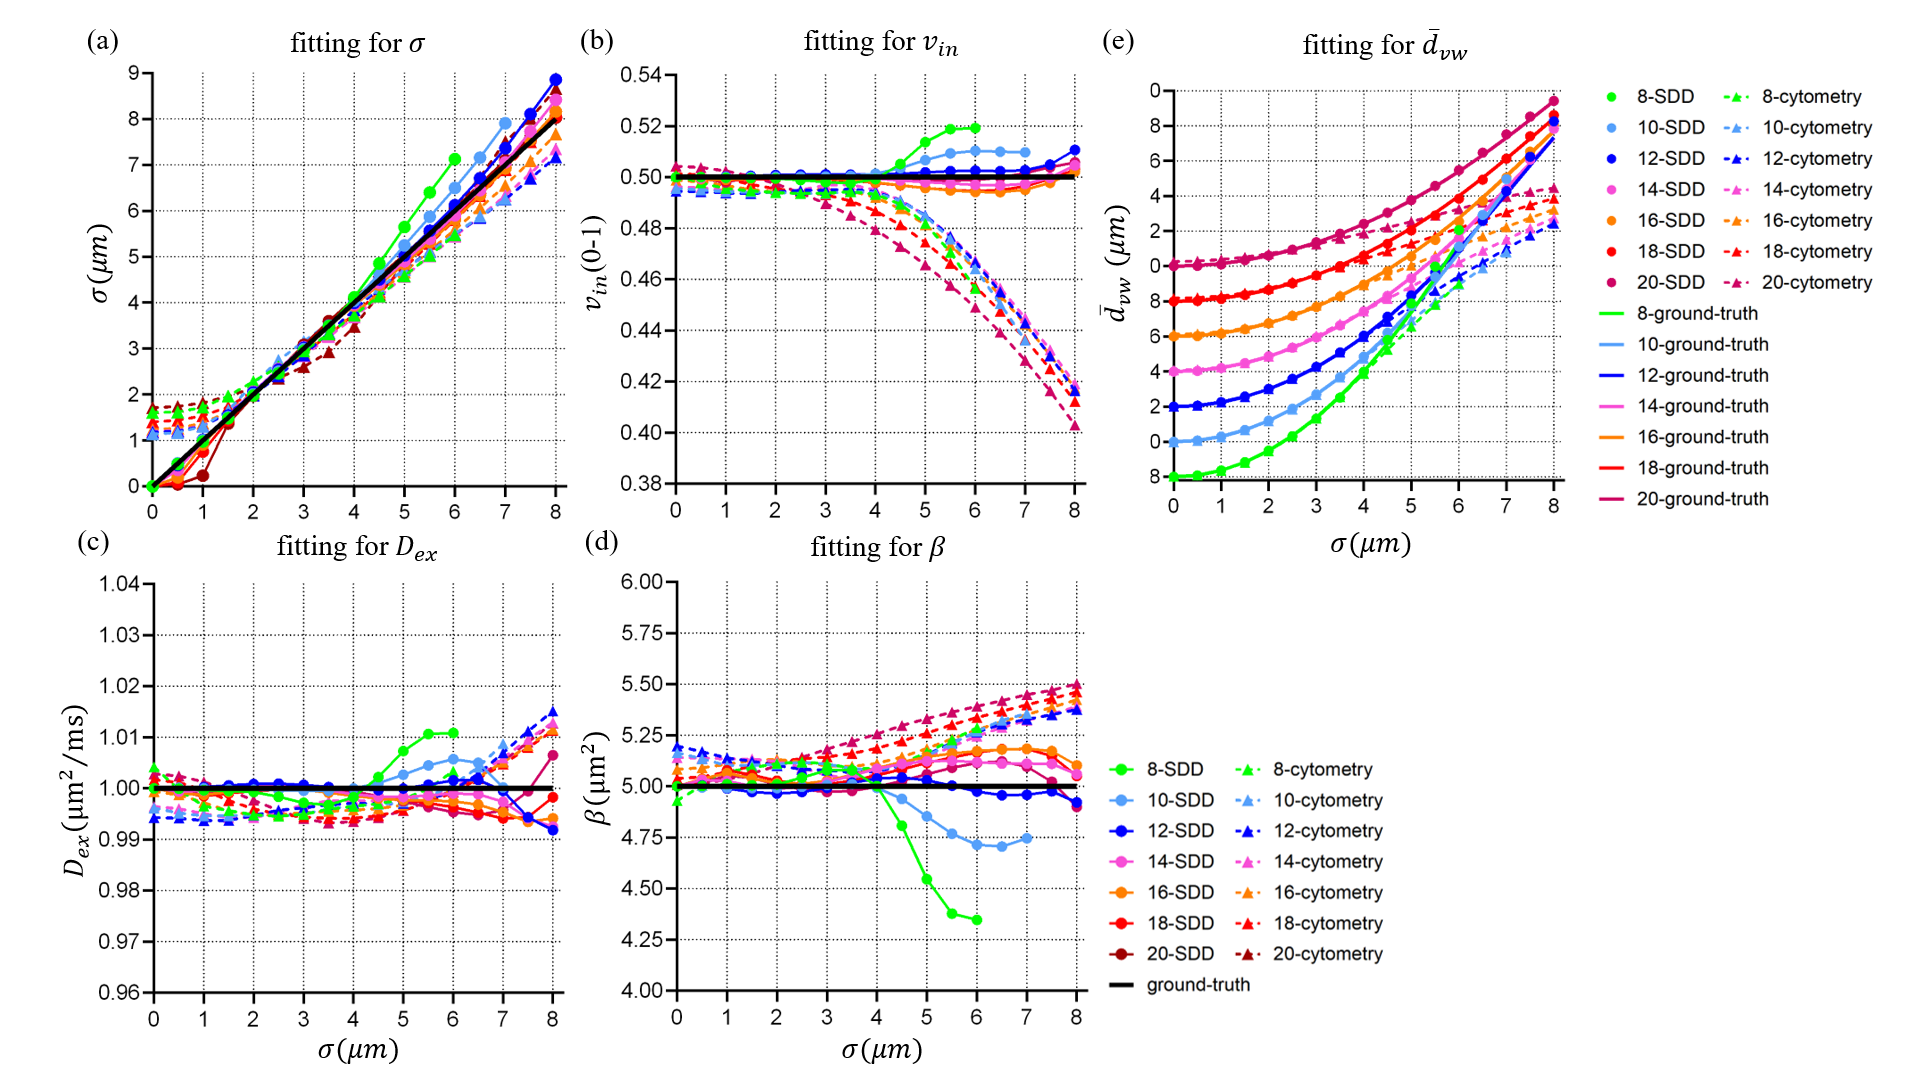
Fig.1 The fitted results of MRI-cytometry and the proposed SDD model in simulations without noise. Note that the $$$\bar{d}$$$ value is the mean diameter of the number distribution function for cell size and the $$$\bar{d}_{v w}$$$ value is the corresponding volume-weighted mean diameter of the cell size distribution, which can be fitted directly by the solvers. For a fixed $$$\bar{d}$$$, $$$\bar{d}_{v w}$$$ will increase with a larger σ. The numbers in the legend indicate the $$$\bar{d}$$$ values set in the simulation.