4338
Decoding Deep Gray Matter Susceptibility: Variance from the reference region, not dipole inversion artifacts, dominates reproducibility1Buffalo Neuroimaging Analysis Center, Department of Neurology at the Jacobs School of Medicine and Biomedical Sciences, University at Buffalo, The State University of New York, Buffalo, NY, United States, 2Jacobs Multiple Sclerosis Center, Department of Neurology, Jacobs School of Medicine and Biomedical Sciences, University at Buffalo, The State University of New York, Buffalo, NY, United States, 3Department of Computer Science and Automation, Technische Universitat Ilmenau, Ilmenau, Germany, 4Center for Biomedical Imaging, Clinical and Translational Science Institute, University at Buffalo, The State University of New York, Buffalo, NY, United States
Synopsis
Keywords: Quantitative Imaging, Susceptibility, QSM, Reproducibility, Inversion algorithms, Background Field Removal, Reference region
Motivation: Quantitative Susceptibility Mapping (QSM), an MRI technique used to investigate iron, myelin and calcium in neurology research, necessitates referencing susceptibility values, but the effect of this referencing step on the study outcome is not well understood.
Goal(s): To disentangle the impact of reference region and inversion algorithm on scan-rescan susceptibility variation.
Approach: Three brain reference regions and twenty-one inversion algorithms were studied on DGM susceptibility reproducibility using 5 subjects (4 scan-rescan each).
Results: The choice of the reference region had a more significant impact on reproducibility than the choice of the inversion algorithms. Whole brain and white matter referenced findings were highly reproducible.
Impact: The choice of the reference region affects statistical power and can lead to the masking of significant group differences due to increased variation.
Introduction
Quantitative Susceptibility Mapping (QSM), a vital MRI technique, quantifies tissue magnetic susceptibility1,2, aiding in iron3, myelin4, and calcium5 concentration assessment. Crucial for studying deep gray matter (DGM) iron levels, it’s a potential neurodegenerative disease and aging biomarker.6-8QSM inherently requires referencing susceptibility values to an internal point.9-11 Several different reference regions have been used in the literature and there is an ongoing debate regarding what region should be used.10,11 Although there is consensus that the choice of the region can theoretically affect statistical power and introduce bias10, no study has rigorously and empirically investigated the effect of referencing on group-level study outcomes.
In this present study, we assessed the influence of three commonly used brain reference regions on the reproducibility of DGM susceptibility measurements. Furthermore, we quantified the importance of the reference region choice for scan-rescan reproducibility relative to the choice of the inversion algorithm.
Methods
Subjects and data acquisition: We enrolled and consented five healthy subjects. Participants were scanned with an axial-oblique 3D GRE sequence (512x192x68 matrix, 256x192x128mm3, TE/TR=22ms/40ms, BW=13.89kHz, flip=12°) at 3T (GE Signa Excite HDx; multi-channel head-neck coil). We scanned each subject four times with full repositioning, scanner recalibrations, and manual repositioning of the oblique imaging slab (real-world setting).QSM reconstruction: Based on the outcome of recent in-vivo benchmarking studies14,39, we applied RESHARP12 to the unwrapped phase (best-path13). We applied 21 different inversion algorithms15-32 (provided by the original authors) to the background corrected field maps. For deep-learning (DL) methods, background corrected field maps were rotated (axial), resampled (isotropic), and susceptibility map were transformed back to the original subject space.
Image analysis and referencing: DGM regions were segmented with an in-house developed bi-modal QSM-T1w atlas technique.33 For each ROI, we calculated the average susceptibility and referenced it to each of three reference regions, yielding three referenced susceptibility values per region, subject, and inversion algorithm. Based on their frequent use in the literature10,34-38, we used bilateral ventricles (CSF), white matter (WM), and the whole brain.
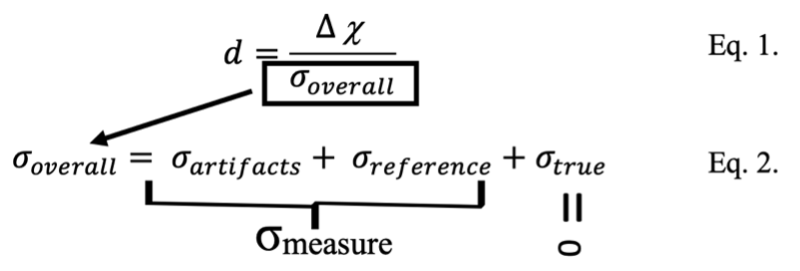
Statistical analysis: The relevant statistical quantity that describes the strengths of an observation in a cohort-based study is the effect size (Fig. 1, Eq. 1). To achieve a high effect size, the susceptibility difference must be high (determined by the biology) and the variation caused by the measurement process, σmeasure = σROI,artifacts + σreference, low (Fig. 1, Eq. 2). We quantified the effect of inversion and referencing on σmeasure, by estimating σmeasure as the scan-rescan reproducibility, as described previously.40
Results
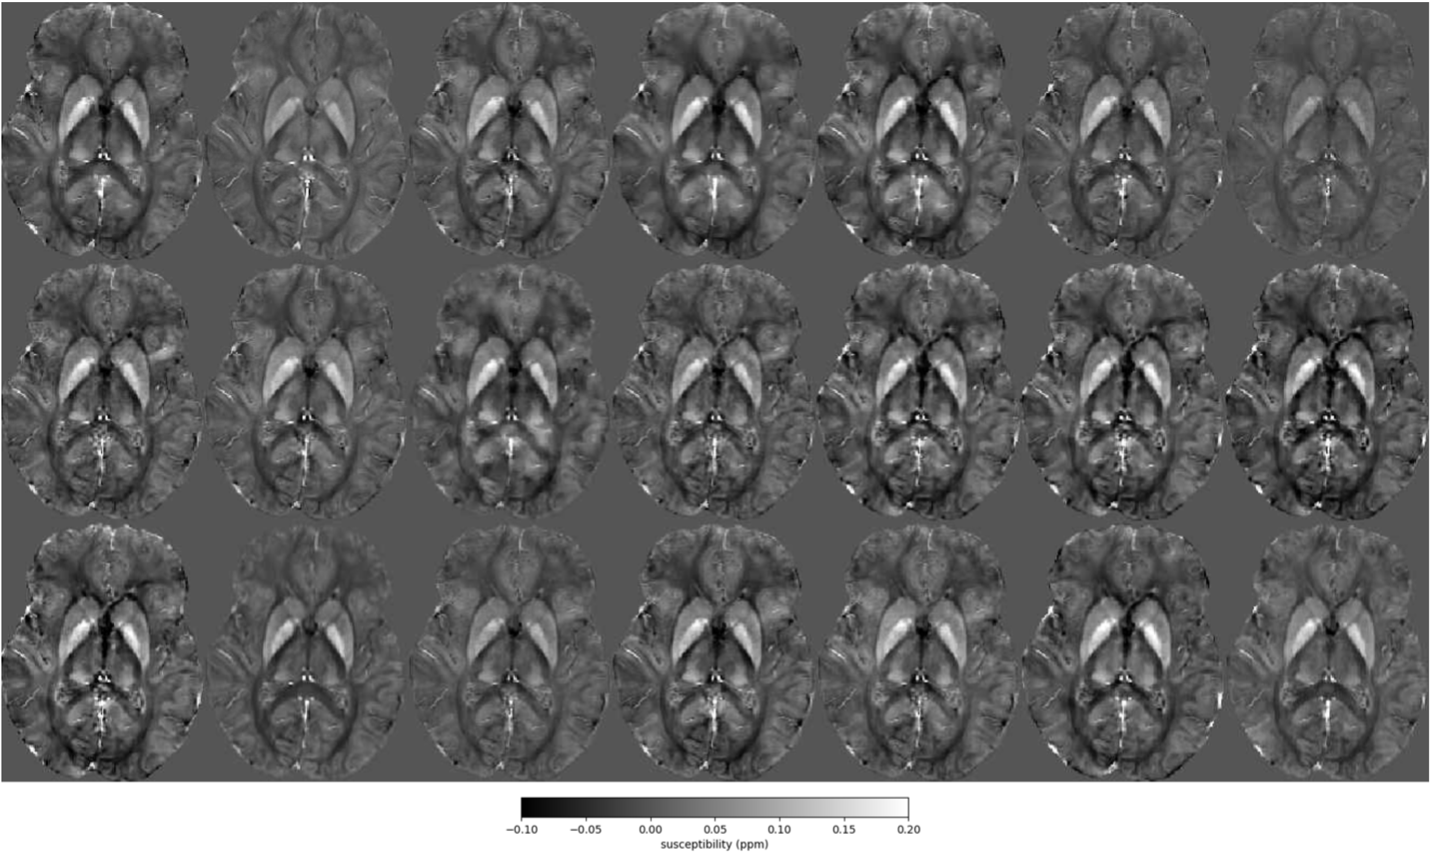
Participants: The average age of the subjects was 25±1 years and the female:male ratio was 1:4.Susceptibility underestimation: To eliminate the effect of underestimation1,20 by some algorithms (Fig. 2) on subsequent analyses, we normalized the reproducibility metric by dividing it with the average susceptibility of all DGM combined.
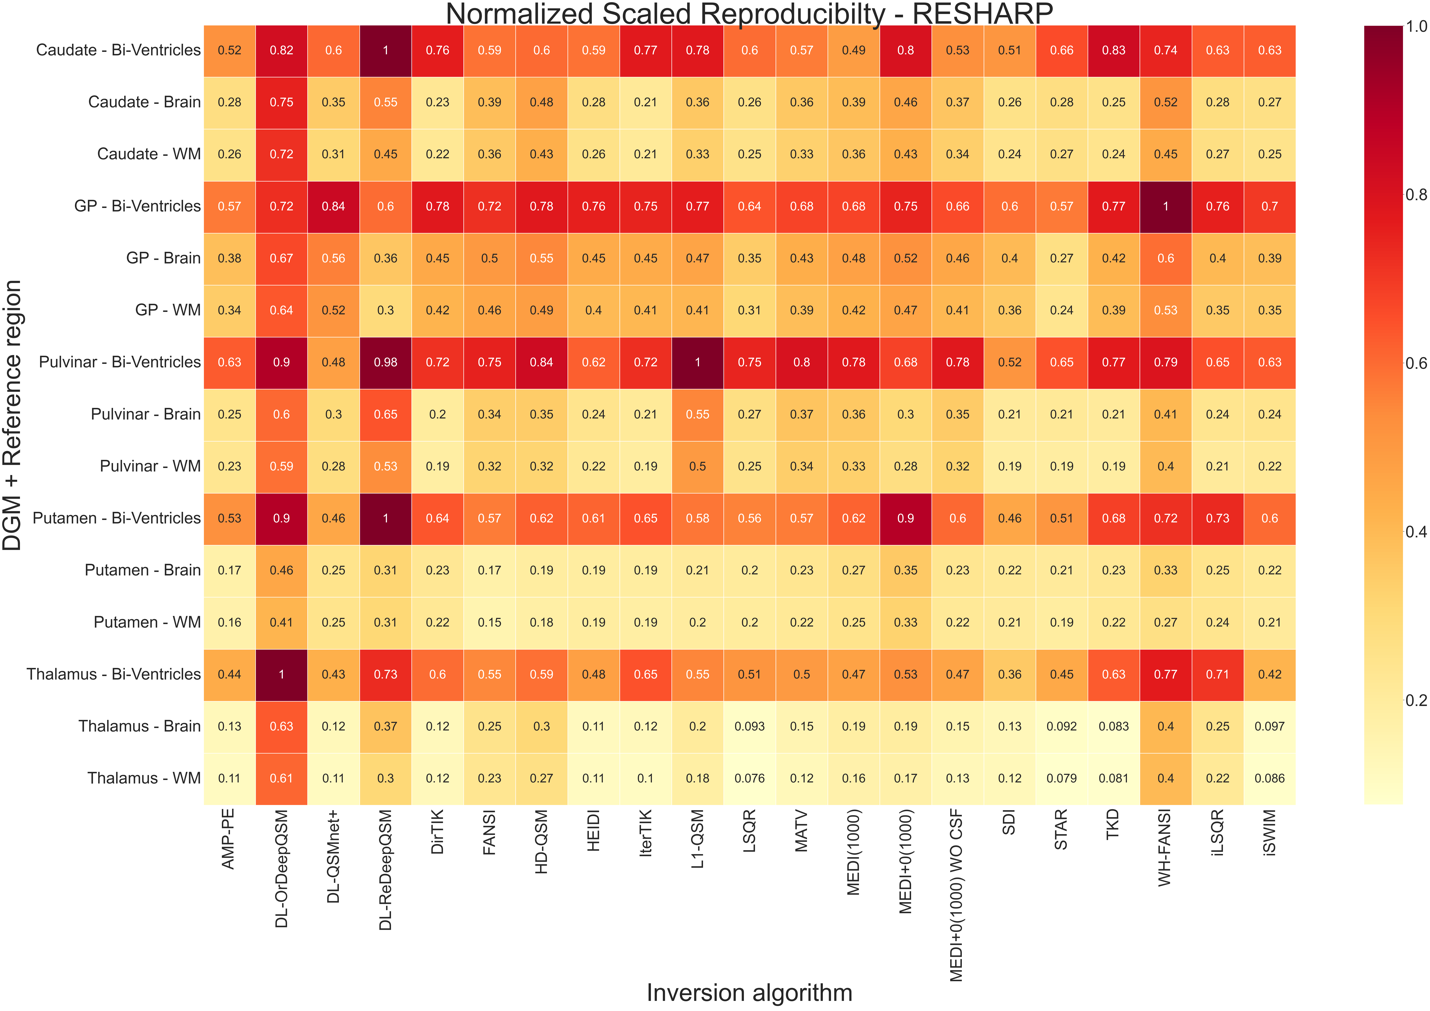
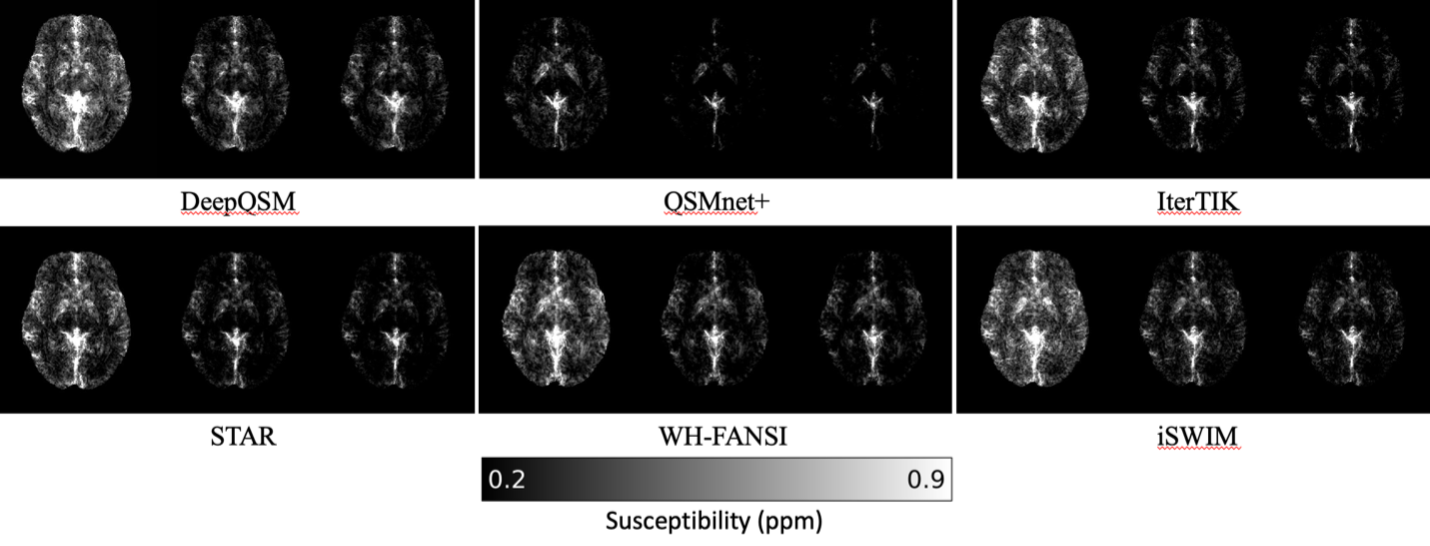
Reproducibility: Figure 3 illustrates regional reproducibility metrics, showing approximately 50% lower reproducibility with CSF referencing compared to WM or whole brain. WM and whole brain referencing exhibited comparable reproducibility for each DGM region, except for within the GP (slightly lower). SDI and AMP-PE were the only algorithms to consistently perform better in each DGM region, with each reference region. DeepQSM and WH-FANSI demonstrated the lowest reproducibility across all ROIs and reference regions. Fig. 5 provides a pixel-wise overview of the effect of reference region and inversion algorithm on reproducibility.
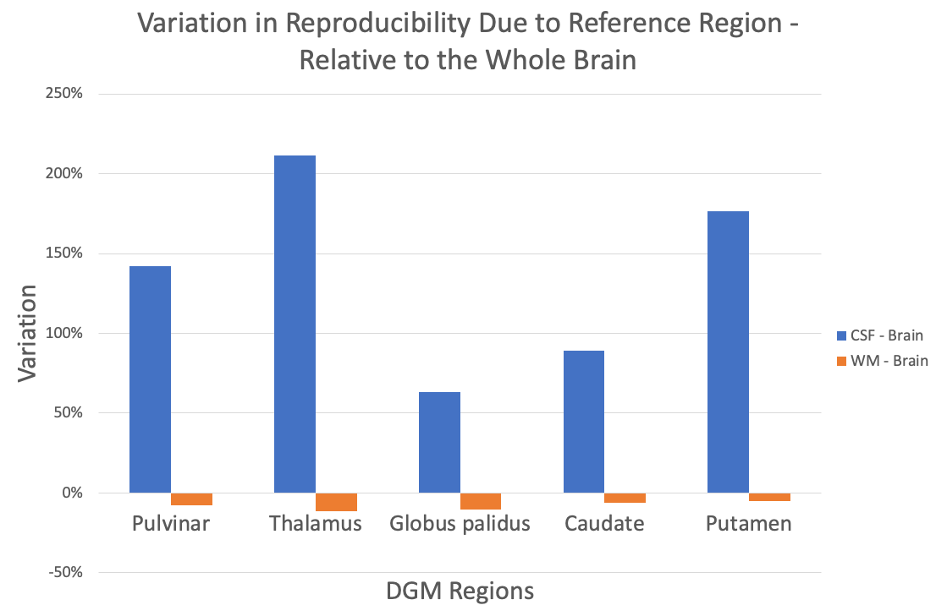
Effect of changing the reference region: Figure 4 summarizes the median (across inversion algorithms) effect of changing the reference region from whole brain to CSF or WM. Variation increased by 63-211% in GP and thalamus, respectively, when CSF was used instead of whole brain and decreased by 5-11% in putamen and thalamus, respectively, when WM was used.
Discussion
Our analysis disentangled the impact of reference region selection and inversion algorithm on scan-rescan variation. The choice of the reference region had a substantial impact on the reproducibility.Whole brain and WM references exhibited significantly higher reproducibility than CSF across all algorithms (Fig. 4), including MEDI with CSF referencing. A plausible explanation for the finding is the higher voxel count, averaging out localized variations from reconstruction artifacts.10 CSF's poor performance might also be attributed to localized artifacts from non-susceptibility effects.32 Overall, our results provide critical evidence to support the recent consensus recommendations of using the largest reference region (higher voxel count), preferably the whole brain10 to avoid bias in patient cohorts.
Conclusion
Propagated variation from the reference region, not variance due to reconstruction artifacts, dominates reproducibility of QSM in the DGM. Larger reference regions, specifically whole brain and WM exhibited superior QSM reproducibility in the DGM compared to smaller regions.Acknowledgements
We are grateful to Dr. Carlos Milovic (Pontificia Universidad Católica de Valparaíso) for his advice on the implementation and parameter optimization of FANSI and WH-FANSI and Pascal Spincemaille (Cornell-Weill Medical College) for his valuable advice on the PDF implementation for single-echo data. Research reported in this publication was supported by the National Institute of Neurological Disorders And Stroke of the National Institutes of Health under Award Number R01NS114227 and the National Center for Advancing Translational Sciences of the National Institutes of Health under Award Number UL1TR001412. The content is solely the responsibility of the authors and does not necessarily represent the official views of the National Institutes of Health. The German Federal Ministry of Education and Research (BMBF) grant AVATAR (16KISA024, funded by the European Union - NextGenerationEU), the German Academic Exchange Service (DAAD PPP 57599925), and an ISMRM Research Exchange Grant awarded to T.J.References
[1] Wang, Y. & Liu, T. Quantitative susceptibility mapping (QSM): Decoding MRI data for a tissue magnetic biomarker. Magn Reson Med 73, 82–101 (2015).
[2] Schweser, F., Deistung, A. & Reichenbach, J. R. Foundations of MRI phase imaging and processing for Quantitative Susceptibility Mapping (QSM). Z Med Phys 26, 6–34 (2016).
[3] Langkammer, C. et al. Quantitative susceptibility mapping (QSM) as a means to measure brain iron? A post mortem validation study. NeuroImage 62, 1593–1599 (2012).
[4] Deh, K. et al. Magnetic susceptibility increases as diamagnetic molecules breakdown: Myelin digestion during multiple sclerosis lesion formation contributes to increase on QSM: Myelin Breakdown in MS Lesion Formation. J. Magn. Reson. Imaging 48, 1281–1287 (2018).
[5] Schweser, F., Deistung, A., Lehr, B. W. & Reichenbach, J. R. Differentiation Between Diamagnetic and Paramagnetic Cerebral Lesions Based on Magnetic Susceptibility Mapping. Med Phys 37, 5165–5178 (2010).
[6] Eskreis-Winkler, S. et al. The clinical utility of QSM: disease diagnosis, medical management, and surgical planning. NMR Biomed. 30, e3668 (2017).
[7] Wang, Y. et al. Clinical quantitative susceptibility mapping (QSM): Biometal imaging and its emerging roles in patient care. J. Magn. Reson. Imaging 46, 951–971 (2017).
[8] Ravanfar, P. et al. Systematic Review: Quantitative Susceptibility Mapping (QSM) of Brain Iron Profile in Neurodegenerative Diseases. Front. Neurosci. 15, 618435 (2021).
[9] Schweser F, Deistung A, Reichenbach JR. Foundations of MRI phase imaging and processing for Quantitative Susceptibility Mapping (QSM). Z Med Phys. 2016 Mar;26(1):6-34. doi: 10.1016/j.zemedi.2015.10.002. Epub 2015 Dec 15. PMID: 26702760.
[10] QSM Consensus Organization Committee; Bilgic B, Costagli M, Chan KS, Duyn J, Langkammer C, Lee J, Li X, Liu C, Marques JP, Milovic C, Robinson S, Schweser F, Shmueli K, Spincemaille P, Straub S, van Zijl P, Wang Y; ISMRM Electro-Magnetic Tissue Properties Study Group. Recommended Implementation of Quantitative Susceptibility Mapping for Clinical Research in The Brain: A Consensus of the ISMRM Electro-Magnetic Tissue Properties Study Group. ArXiv [Preprint]. 2023 Jul 5:arXiv:2307.02306v1. PMID: 37461418; PMCID: PMC10350101.
[11] Straub S, Schneider TM, Emmerich J, Freitag MT, Ziener CH, Schlemmer HP, Ladd ME, Laun FB. Suitable reference tissues for quantitative susceptibility mapping of the brain. Magn Reson Med. 2017 Jul;78(1):204-214. doi: 10.1002/mrm.26369. Epub 2016 Aug 16. PMID: 27529579.
[12] Sun H, Wilman AH. Background field removal using spherical mean value filtering and Tikhonov regularization. Magn Reson Med. 2014 Mar;71(3):1151-7. doi: 10.1002/mrm.24765. PMID: 23666788.
[13] Hussein S. Abdul-Rahman, Munther A. Gdeisat, David R. Burton, Michael J. Lalor, Francis Lilley, and Christopher J. Moore, "Fast and robust three-dimensional best path phase unwrapping algorithm," Appl. Opt. 46, 6623-6635 (2007)
[14] Milovic, C., Fuchs, P., Arsenov, O., Kiersnowski, O, C., Murdoch, R., Muralidharan, L., Nassar, J., and Shmueli, K. Exhaustive Comparison of QSM Background Field Removal and Masking using a Realistic Numerical Head Phantom. ISMRM 2023 (4178)
[15] Huang, S., Lah, J, J., Allen, J, W., Qiu, D. Robust Quantitative Susceptibility Mapping via Approximate Message Passing with Parameter Estimation. arXiv preprint. arXiv:2207.14709, 2022. https://arxiv.org/abs/2207.14709.
[16] Bollmann S, Rasmussen KGB, Kristensen M, Blendal RG, Østergaard LR, Plocharski M, O'Brien K, Langkammer C, Janke A, Barth M. DeepQSM - using deep learning to solve the dipole inversion for quantitative susceptibility mapping. Neuroimage. 2019 Jul 15;195:373-383. doi: 10.1016/j.neuroimage.2019.03.060. Epub 2019 Mar 29. PMID: 30935908.
[17] Karsa, A et al. (2019). High Repeatability of Quantitative Susceptibility Mapping (QSM) in the Head and Neck With a View to Detecting Hypoxic Cancer Sites, In Proceedings of the 27th Annual Meeting of the ISMRM, Montreal, p. 4939
[18] Milovic, C., Bilgic, B., Zhao, B., Acosta-Cabronero, J., Tejos, C., 2018. Fast nonlinear susceptibility inversion with variational regularization. Magnetic resonance in medicine 80, 814–821.
[19] Lambert M, Tejos C, Langkammer C, Milovic C. Hybrid data fidelity term approach for quantitative susceptibility mapping. Magn Reson Med. 2022 Aug;88(2):962-972. doi: 10.1002/mrm.29218. Epub 2022 Apr 18. PMID: 35435267; PMCID: PMC9324845.
[20] Schweser F, Sommer K, Deistung A, Reichenbach JR. Quantitative susceptibility mapping for investigating subtle susceptibility variations in the human brain. Neuroimage. 2012 Sep;62(3):2083-100. doi: 10.1016/j.neuroimage.2012.05.067. Epub 2012 Jun 1. PMID: 22659482.
[21] Li, W., Wu, B., Liu, C., 2011. Quantitative susceptibility mapping of human brain reflects spatial variation in tissue composition. Neuroimage 55, 1645–1656.
[22] Tang J, Liu S, Neelavalli J, Cheng YC, Buch S, Haacke EM. Improving susceptibility mapping using a threshold-based K-space/image domain iterative reconstruction approach. Magn Reson Med. 2013 May;69(5):1396-407. doi: 10.1002/mrm.24384. Epub 2012 Jun 26. PMID: 22736331; PMCID: PMC3482302.
[23] Milovic C, Lambert M, Langkammer C, Bredies K, Irarrazaval P, Tejos C. Streaking artifact suppression of quantitative susceptibility mapping reconstructions via L1-norm data fidelity optimization (L1-QSM). Magn Reson Med. 2022 Jan;87(1):457-473. doi: 10.1002/mrm.28957. Epub 2021 Aug 4. PMID: 34350634.
[24] Guo L, Mei Y, Guan J, Tan X, Xu Y, Chen W, Feng Q, Feng Y. Morphology-adaptive total variation for the reconstruction of quantitative susceptibility map from the magnetic resonance imaging phase. PLoS One. 2018 May 8;13(5):e0196922. doi: 10.1371/journal.pone.0196922. PMID: 29738526; PMCID: PMC5940224.
[25] LLiu, J., Liu, T., Rochefort, L. de, Ledoux, J., Khalidov, I., Chen, W., Tsiouris, A.J., Wisnieff, C., Spincemaille, P., Prince, M.R., Wang, Y., 2012. Morphology enabled dipole inversion for quantitative susceptibility mapping using structural consistency between the magnitude image and the susceptibility map. Neuroimage 59, 2560–2568.
[26] Liu, Z., Spincemaille, P., Yao, Y., Zhang, Y., Wang, Y., 2018. MEDI+0: Morphology enabled dipole inversion with automatic uniform cerebrospinal fluid zero reference for quantitative susceptibility mapping. Magnetic resonance in medicine 79, 2795–2803.
[27] Jung, W., Yoon, J., Ji, S., Choi, J, S., Kim, J, M., Nam, Y., Kim, E, Y., Lee, J. Exploring linearity of deep neural network trained QSM: QSMnet+. NeuroImage, Volume 211, 2020. 116619. ISSN 1053-8119, https://doi.org/10.1016/j.neuroimage.2020.116619.
[28] Schweser, F et al. (2013). Toward online reconstruction of quantitative susceptibility maps: superfast dipole inversion, Magnetic Resonance in Medicine vol 69 issue 6, 1581-1593.
[29] Wei, H., Dibb, R., Zhou, Y., Sun, Y., Xu, J., Wang, N., Liu, C., 2015. Streaking artifact reduction for quantitative susceptibility mapping of sources with large dynamic range. NMR in biomedicine 28, 1294–1303.
[30] Wharton, S., Schäfer, A., Bowtell, R., 2010. Susceptibility mapping in the human brain using threshold-based k-space division. Magnetic resonance in medicine 63, 1292–1304.
[31] Milovic, C., Bilgic, B., Zhao, B., Langkammer, C., Tejos, C., Cabronero, J.A., 2019. Weak-harmonic regularization for quantitative susceptibility mapping. Magnetic resonance in medicine 81, 1399–1411.
[32] Jochmann, T., Jakimovski, D., Küchler, N., Zivadinov, R., Haueisen, J., Schweser, F.Quantitative mapping of susceptibility and non-susceptibility frequency with DEEPOLE QUASAR. ISMRM 2021.
[33] Hanspach, J. et al. Methods for the computation of templates from quantitative magnetic susceptibility maps (QSM): Toward improved atlas- and voxel-based analyses (VBA). J Magn Reson Imaging 46, 1474–1484 (2017).
[34] Lotfipour AK, Wharton S, Schwarz ST, Gontu V, Schafer A, Peters AM, Bowtell RW, Auer DP, Gowland PA, Bajaj NP. High resolution magnetic susceptibility mapping of the substantia nigra in Parkinson's disease. J Magn Reson Imaging 2012; 35: 48–55.
[35] Deistung A, Schäfer A, Schweser F, Biedermann U, Turner R, Reichenbach JR. Toward in vivo histology: a comparison of quantitative susceptibility mapping (QSM) with magnitude-, phase-, and R*2-imaging at ultra-high magnetic field strength. Neuroimage 2013; 65: 299–314.
[36] Reichenbach JR, Schweser F, Serres B, Deistung A. Quantitative susceptibility mapping: concepts and applications. Clin Neuroradiol 2015; 25(Suppl 2): 225–230.
[37] Li W, Wu B, Liu CL. Quantitative susceptibility mapping of human brain reflects spatial variation in tissue composition. Neuroimage 2011; 55: 1645–1656.
[38] Lim IA, Faria AV, Li X, Hsu JT, Airan RD, Mori S, van Zijl PC. Human brain atlas for automated region of interest selection in quantitative susceptibility mapping application to determine iron content in deep gray matter structures. Neuroimage 2013; 82: 449–469.
[39] Salman, F. Ramesh, A., Jochmann, T., Prayer, M., Bergsland, N., Dwyer, M. G., Jakimovski, D., Zivadinov, R., Schweser, F. Decoding Sensitivity of Quantitative Susceptibility Mapping: Influence of Background Field Removal and Inversion Algorithms. ISMRM 2024
[40] Salman, F. Ramesh, A., Jochmann, T., Prayer, M., Bergsland, N., Dwyer, M. G., Jakimovski, D., Zivadinov, R., Schweser, F. Systematic assessment of published QSM inversion algorithms for detecting longitudinal changes in brain susceptibility. ISMRM 2023.
Figures