4337
Comparison of different simulation approaches to predict signal evolutions and quantitative values in diffusion-sensitized MR Fingerprinting1Siemens Healthcare GmbH, Erlangen, Germany, 2Friedrich-Alexander University Erlangen-Nuremberg, Erlangen, Germany, 3Siemens Healthcare GmbH, Rome, Italy
Synopsis
Keywords: Quantitative Imaging, MR Fingerprinting
Motivation: For quantitative methods like MRF an accurate yet fast simulation of signal evolutions is essential. For fast simulations, ignoring time-evolutions of RF-pulses or actual diffusion directions are common practice even though these can affect the resulting fingerprints.
Goal(s): We investigate some of these simplifications and their influence on the resulting signal evolutions and quantitative values.
Approach: For this we simulate and analyze some possible impacts separately and compare the resulting signal evolutions and quantitative values.
Results: In conclusion, while ignoring diffusion directions has negligible impact on the results, assuming instantaneous RF-pulses or ignoring B1-field variances leads to significant differences in the results.
Impact: Simplifications like ignoring B1-inhomogeneities, slice profile or time-evolution of RF-pulses lead to significant differences in simulated fingerprints. On the other hand, ignoring the diffusion directions in case of Gaussian diffusion has negligible influence on the signal evolution and quantitative values.
Introduction
An essential part of the quantification in MR Fingerprinting (MRF), is the accurate simulation of the fingerprints [1]. Simulations considering every physiological process, while realistic, are not feasible due to their complexity and resulting computation time. This becomes particularly important when including diffusion as this requires acquisitions with multiple encoding directions and requires consideration of tissue variability. Therefore, it is common practice to ignore specific impact factors. But this can lead to inadequate magnetization predictions and result in incorrect quantification. An understanding of the impact of used simplifications on the quantitative results is therefore important. In this study, we investigated the impact of 1) time-resolved vs instantaneous RF-pulse, 2) consideration of B1-field influences, and 3) inclusion of diffusion direction, and their impact on both simulated signal evolutions and quantitative results.Methods
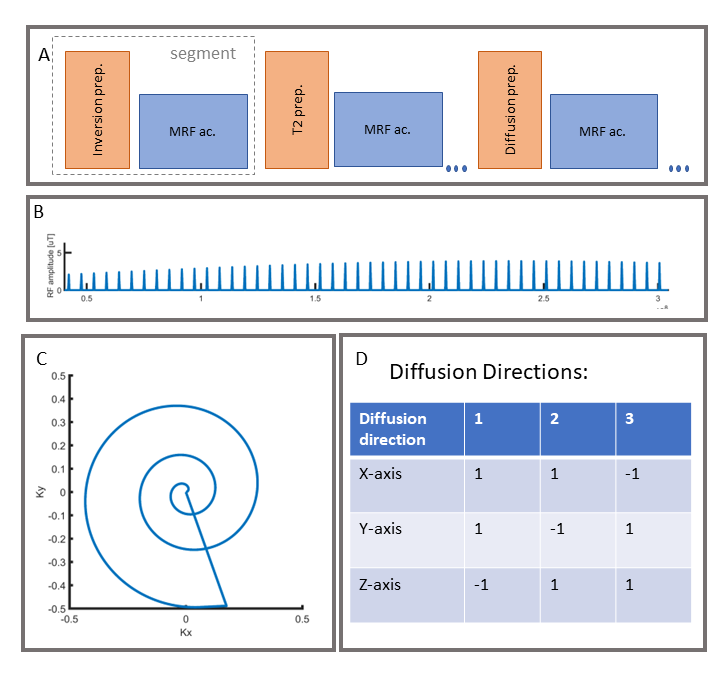
All simulations are based on a multi-dimensional (md-) MRF sequence [2], containing diffusion encoding along three orthogonal directions (Figure 1). Different development environments were used (C++, MATLAB, python) but as all simulations are based on Bloch formalism, the influence of the environments is considered negligible.The sequence was simulated using more complex or simple models, and the resulting fingerprints were compared considering possible implications for quantitative analysis based on those. Often models were applied to partial sequences to single out specific effects.
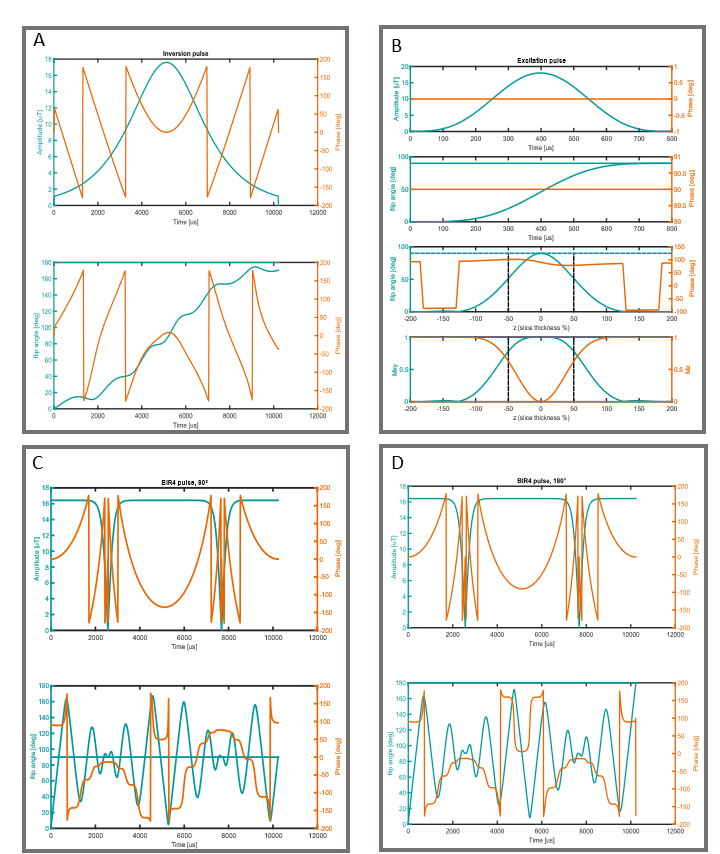
The simplest way to simulate RF-pulses is by calculating and applying the rotation matrix corresponding to the nominal flip angle, which was done in one used models. A more precise method considers that the RF-pulse manipulates magnetization over a certain time frame and should consequently calculate and apply time-resolved relaxation effects. Those actual time dependencies are shown presented in Figure 2.
In addition, the way the magnetization gets affected by a RF-pulse also depends on the spatial position along the excitation axis. This slice profile of RF-pulses is known to influence quantitative results [4] and is shown in Figure 2B) for the excitation pulse.
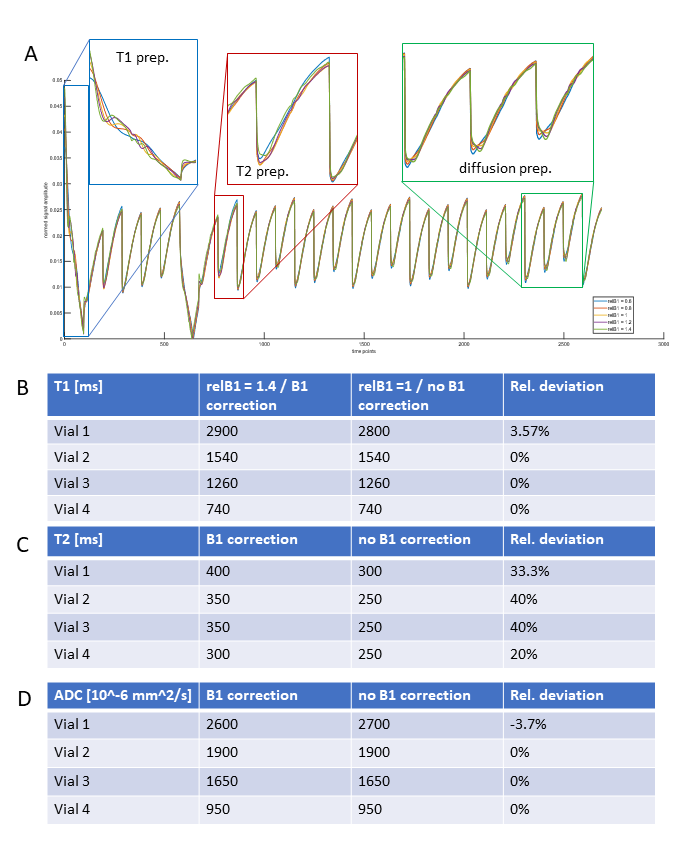
Additionally, the B1-field may vary across the excited region, which modulates the effect of the RF-pulse on the signal evolution. Simulations both excluding and including this effect were analyzed with a relative B1-range from 60% to 140% (10% step) , T1 range from 100 to 2000ms (40ms steps) and 2000 to 3000ms (100ms steps), T2 range from 10 to 200ms (4ms steps), 200 to 1000ms (25ms steps) and ADC from 0 to $$$3000*10^{-6} mm^2/s$$$ ($$$50*10^{-6} mm^2/s$$$ steps).
Diffusion was integrated using exponential attenuation [8]: $$S=S_0*exp(-b*D) $$
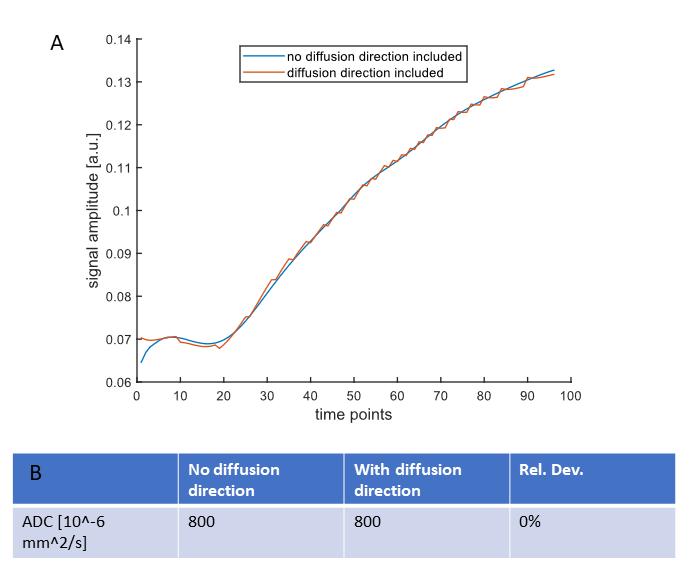
with attenuated signal intensity $$$S$$$, original signal intensity $$$S_0$$$, b-value $$$b$$$, and diffusion coefficient $$$D$$$. This assumes isotropic Gaussian diffusion while in biological tissue, the encoding direction should also be considered. We simulate modes using the simple approach and the more accurate description with encoding directions. The tissue parameters used for these dictionary simulations were T1 values from 500 to 2000ms (50ms steps), T2 values from 10 to 200ms (10ms steps), and diffusion values from 0 to $$$2000*10^{-6} mm^2/s$$$ ($$$50*10^{-6} mm^2/s$$$ steps).
The quantitative results were generated using dictionary pattern matching [2].
Results
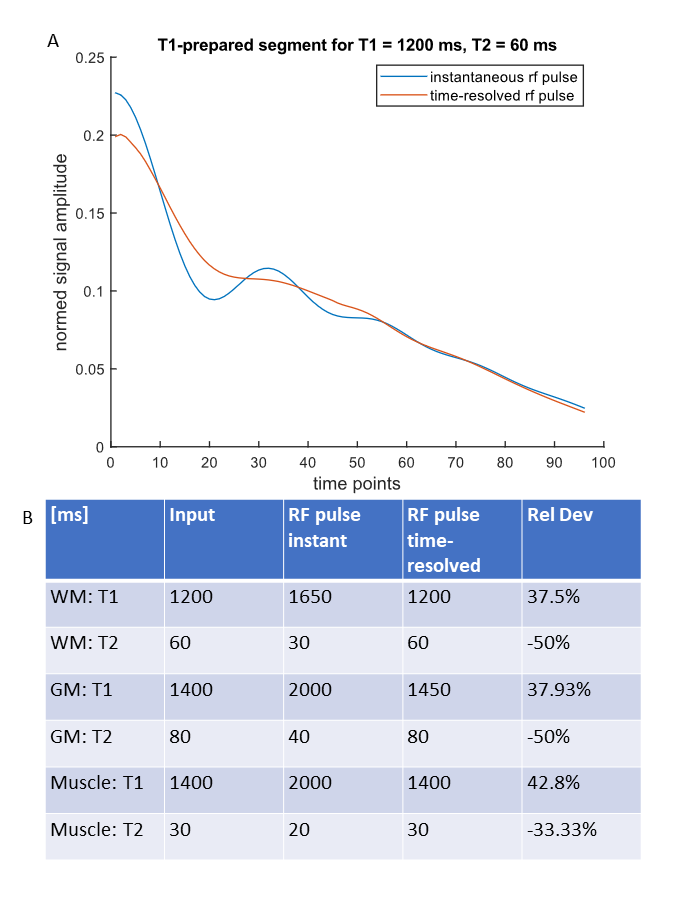
The inclusion of the time-evolution and the slice profile of the RF-pulse lead to obvious changes in the resulting fingerprint for an MRF acquisition (Figure 3), mostly regarding the amplitude of signal oscillation within the FISP read-out train. These differences yield different matches for T1 and T2 with deviations of 43% (T1) and up to 50% (T2) in the T1-prepared segment (without diffusion sensitizing). The inclusion of B1-variance leads to significant changes of the signal evolution (Figure 4), as again the effect of the RF-pulse on the magnetization gets modulated. This manifests as amplitude changes as well as different signal oscillations. While T1 and ADC values show negligible deviations, T2 decreases for an increased B1-field by up to 40%. The inclusion of the diffusion directions has no influence on the signal evolution or the resulting ADC values (Figure 5).Discussion and Conclusion
Inclusion of temporal and spatial resolution of RF-pulses has a substantial impact on the quantitative values estimated by MRF. As we tried to separate different effects by analyzing sub-sections, it is possible that the actual impact gets smaller when looking at the complete sequence. The inclusion of B1-inhomogeneities also significantly changes the resulting quantitative values. Thus, while it may be convenient to ignore those aspects, they should at least be kept in mind as causes for possible deviations in the results. Compared to that, the difference between including or ignoring the diffusion encoding directions has minimal influence on the results and can be ignored for isotropic diffusion. For anisotropic or more complex diffusion processes this requires anew assessment.Acknowledgements
No acknowledgement found.References
[1] Ma D, Gulani V, Seiberlich N, et al. „Magnetic resonance fingerprinting” Nature. 2013;495:187-192
[2] Afzali M, et al. MR “Fingerprinting with b-Tensor Encoding for Simultaneous Quantification of Relaxation and Diffusion in a Single Scan” MRM 88.5 (2022): 2043-2057
[3] Majewski Kurt: “Rotation Relaxation Spliting for Optimizing RF Excitation Pulses with T1 and T2 Relaxations in MRI”, JMR 288 (2018): 43-57
[4] Ma Dan, et al. “Slice Profile and B1 Corrections in 2D Magnetic Resonance Fingerprinting (MRF)” MRM 2017, 78(5): 1781-1789
[5] Mori S, Barker p b, “Diffusion magnetic resonance imaging: Its principle and applications” The Anatomical Record 1999, 257(3):102-109
[6] Stanisz GJ, et al. “T1, T2 relaxation and magnetization transfer in tissue at 3T”. Magn Reson Med. 2005 Sep;54(3):507-12.
[7] Sener, R. N., “Diffusion MRI: apparent diffusion coefficient (ADC) values in the normal brain and a classification of brain disorders based on ADC values”, Computerized Medical Imaging and Graphics 2001, 25(4), 299-326
[8] Weigel, H., Hennig, J., „Diffusion Sensitivity of Turbo Spin Echo Sequence”, MRM 67 (2012), 1528-1537
Figures