4334
Characterize the Membrane Phospholipids 31P MRS Signal in Human Brain at 7T1Advanced Imaging Research Center, University of Texas Southwestern Medical Center, Dallas, TX, United States, 2Department of Radiology, University of Texas Southwestern Medical Center, Dallas, TX, United States
Synopsis
Keywords: Signal Representations, Alzheimer's Disease, Myelin, Parkinson's disease, neurodegenerative disease
Motivation: Human brain 31P-MR spectra often show a broad membrane phospholipid (MPL) signal, which has an intensity far exceeding all other sharp signals combined and a linewidth of ~ 15 ppm. Despite its spectral dominance and distortive effect on the sharp 31P peaks, this MPL signal has received little NMR characterization.
Goal(s): Measure MPL T2 relaxation time, estimate its concentration, and demonstrate MPL chemical exchange effect.
Approach: Chemical exchange was measured by inversion-recovery method, and T2 by varying the delayed time of FID-sampling.
Results: MPL has a short T2 (0.1 ms), and high concentration (1.2 M), and present with internal chemical exchange within its structure.
Impact: MPL signals can be selectively detected using 31P MRS in the human brain. High concentration of MPL in the order of 1M may provide a valuable surrogate point for studying demyelination process in neurodegenerative diseases such as multiple sclerosis (MS).
INTRODUCTION
Human brain 31P MR spectra often show a broad membrane phospholipid (MPL) signal, which has an intensity far exceeding all other sharp signals combined and a linewidth covering a wide frequency range from 0 to 15 ppm which includes PCr, PDE, Pi, and all identified and unidentified PME signals. Despite its large size and distortive effect on co-existent sharp 31P spectral peaks such as PE, PC, GPE and GPC, this broad MPL signal so far has received little characterization (1). This hampers the understanding of its composition and potential applications in early diagnosis of neurological diseases and monitoring of treatment effects. The current study aims to measure MPL T2 relaxation time, estimate its brain concentration, and demonstrate the presence of a chemical exchange effect within its structure, all unreported previously.METHODS
Brain 31P MR spectra were acquired at 7T (Philips Achieva) from 20 subjects using a pulse-acquire sequence in combination with a half-cylinder-shaped 31P/1H dual-tuned T/R coil. To measure T2, a long TR of 15 s was used, while the dead time (DT), i.e., the delayed time between the excitation pulse and the 1st FID sampling point, was varied from 0.17 ms to 1 ms in 11 steps. To reveal chemical exchange effect, the upfield part of the broad MPL signal was inverted using an adiabatic pulse followed by an inversion delay time (TI) varying from 3(5) ms to 10 s in 12(9) steps (spaced logarithmically) while the downfield part remained un-inverted for the observation of TI-dependent changes.RESULTS AND DISCUSSION
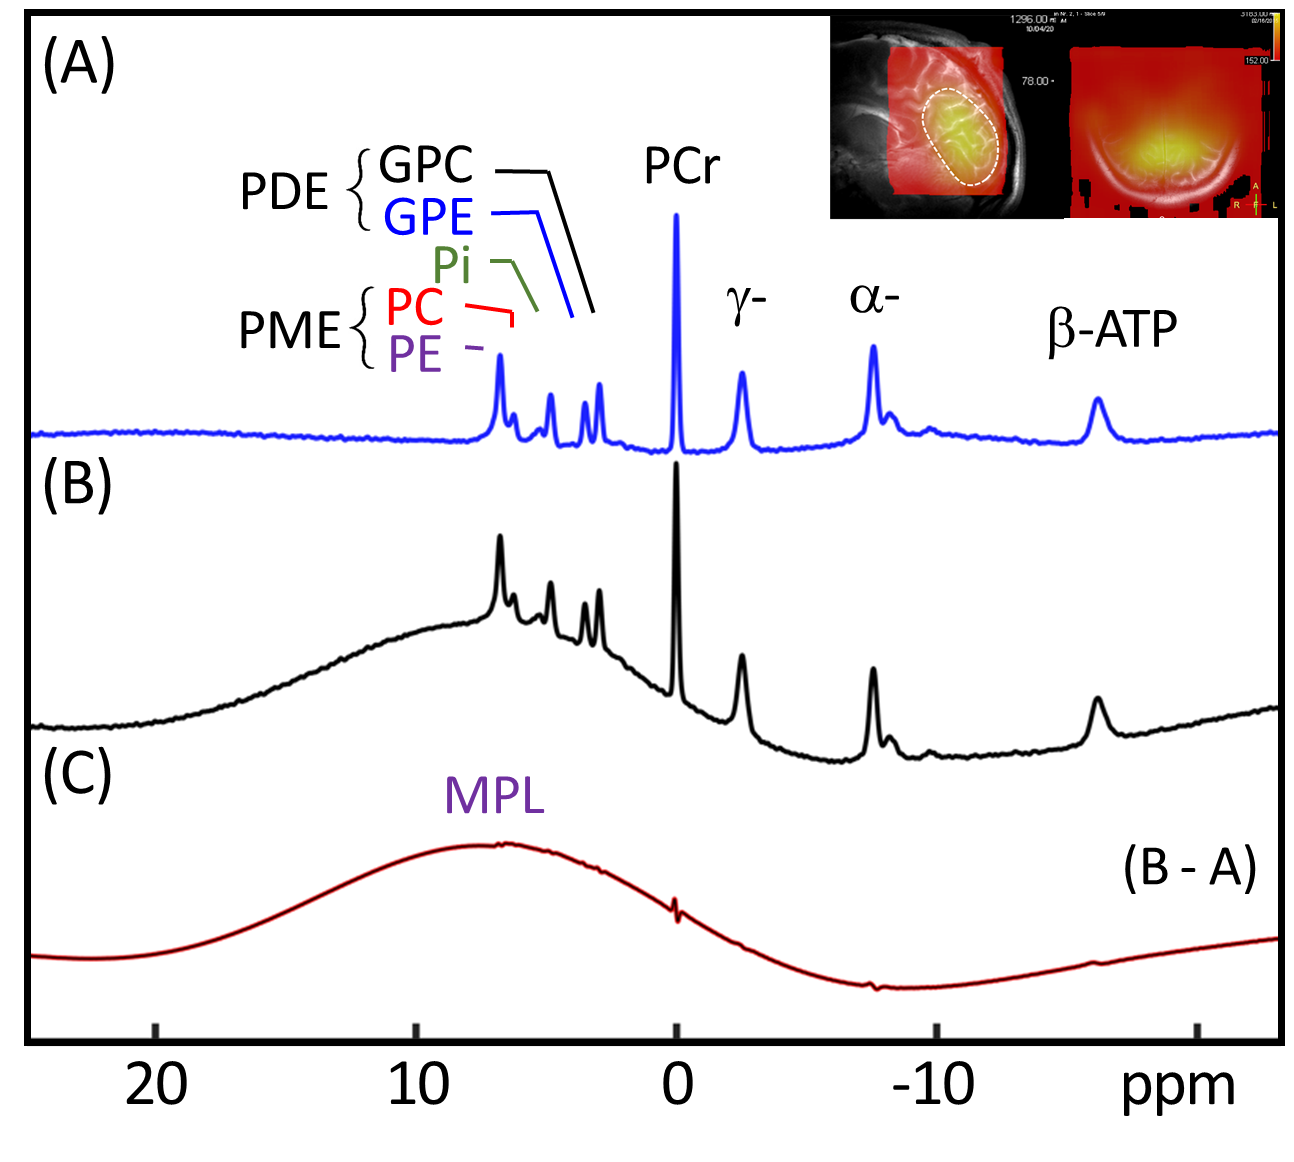
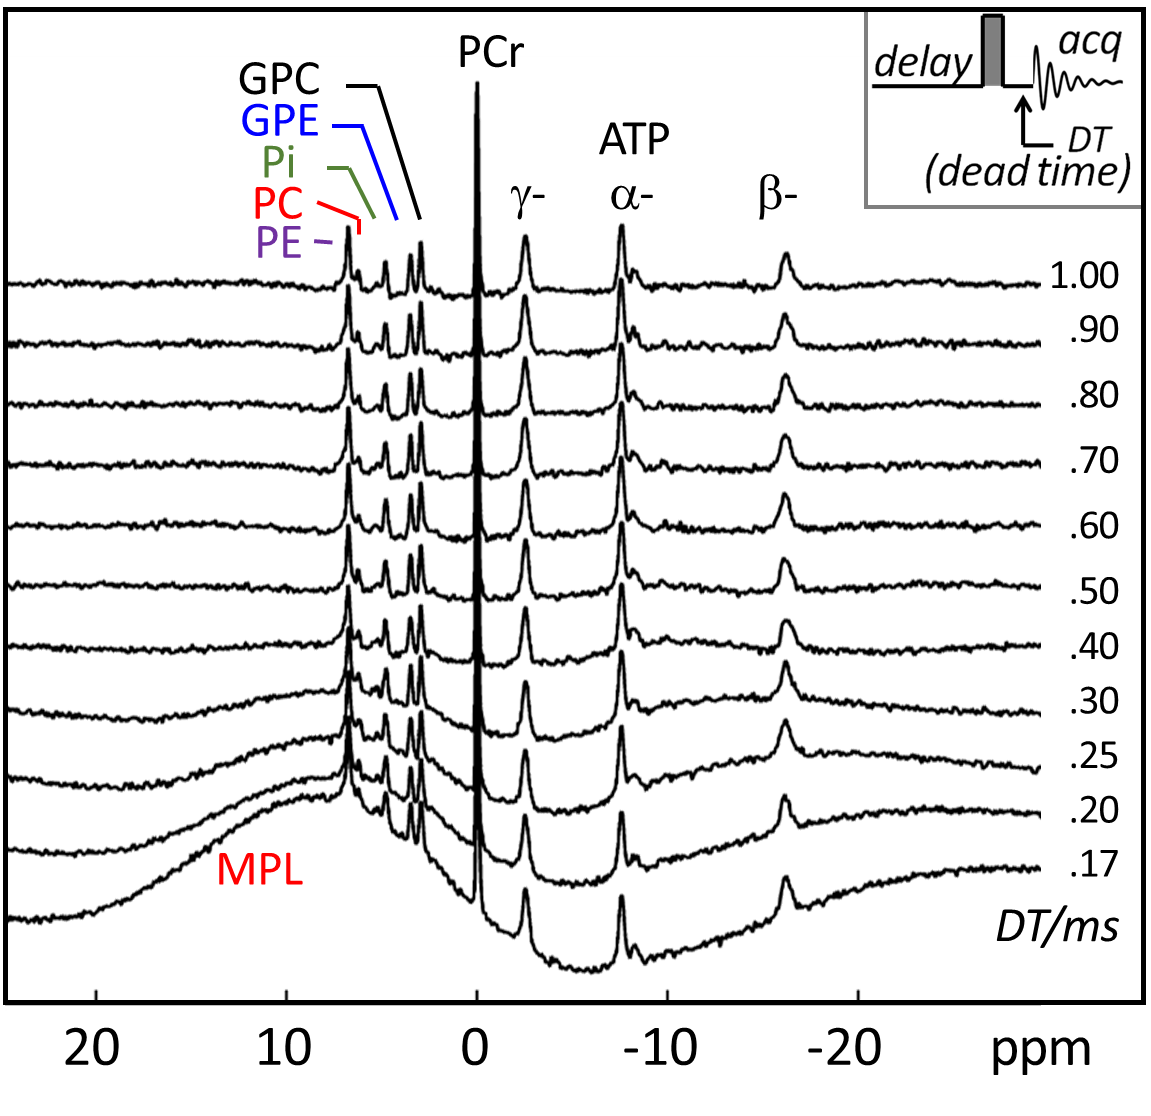
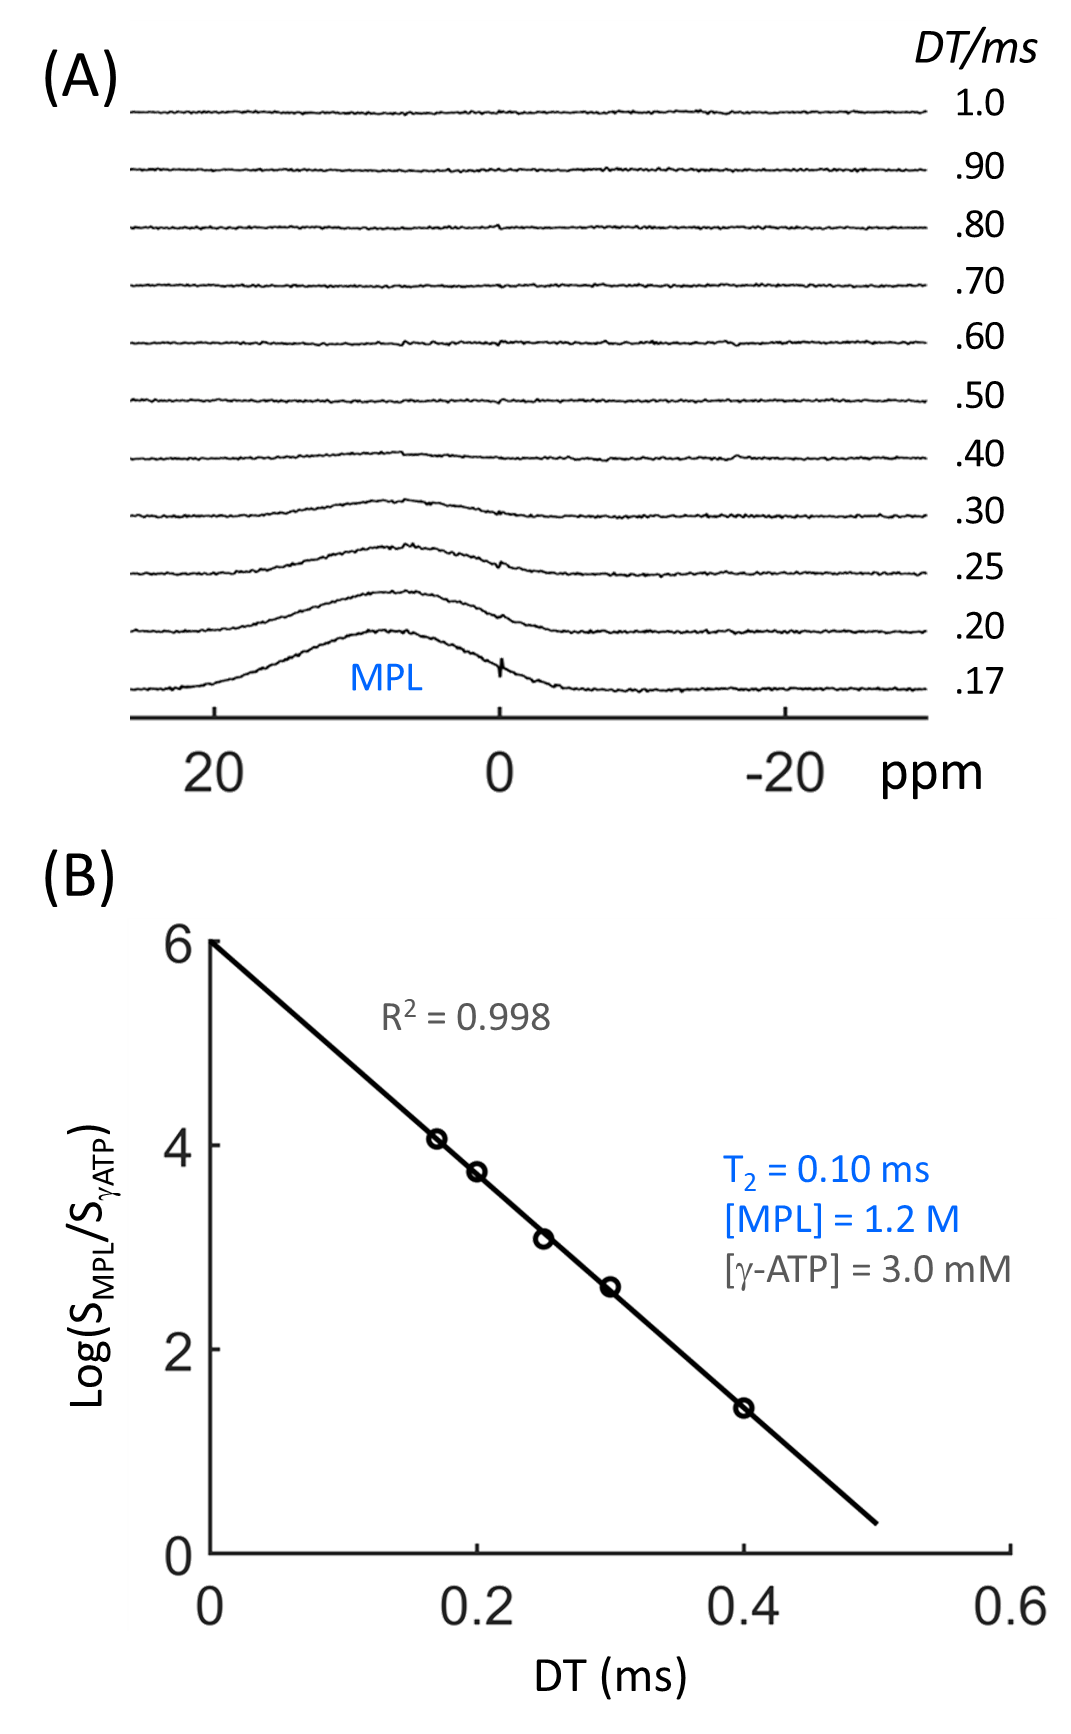
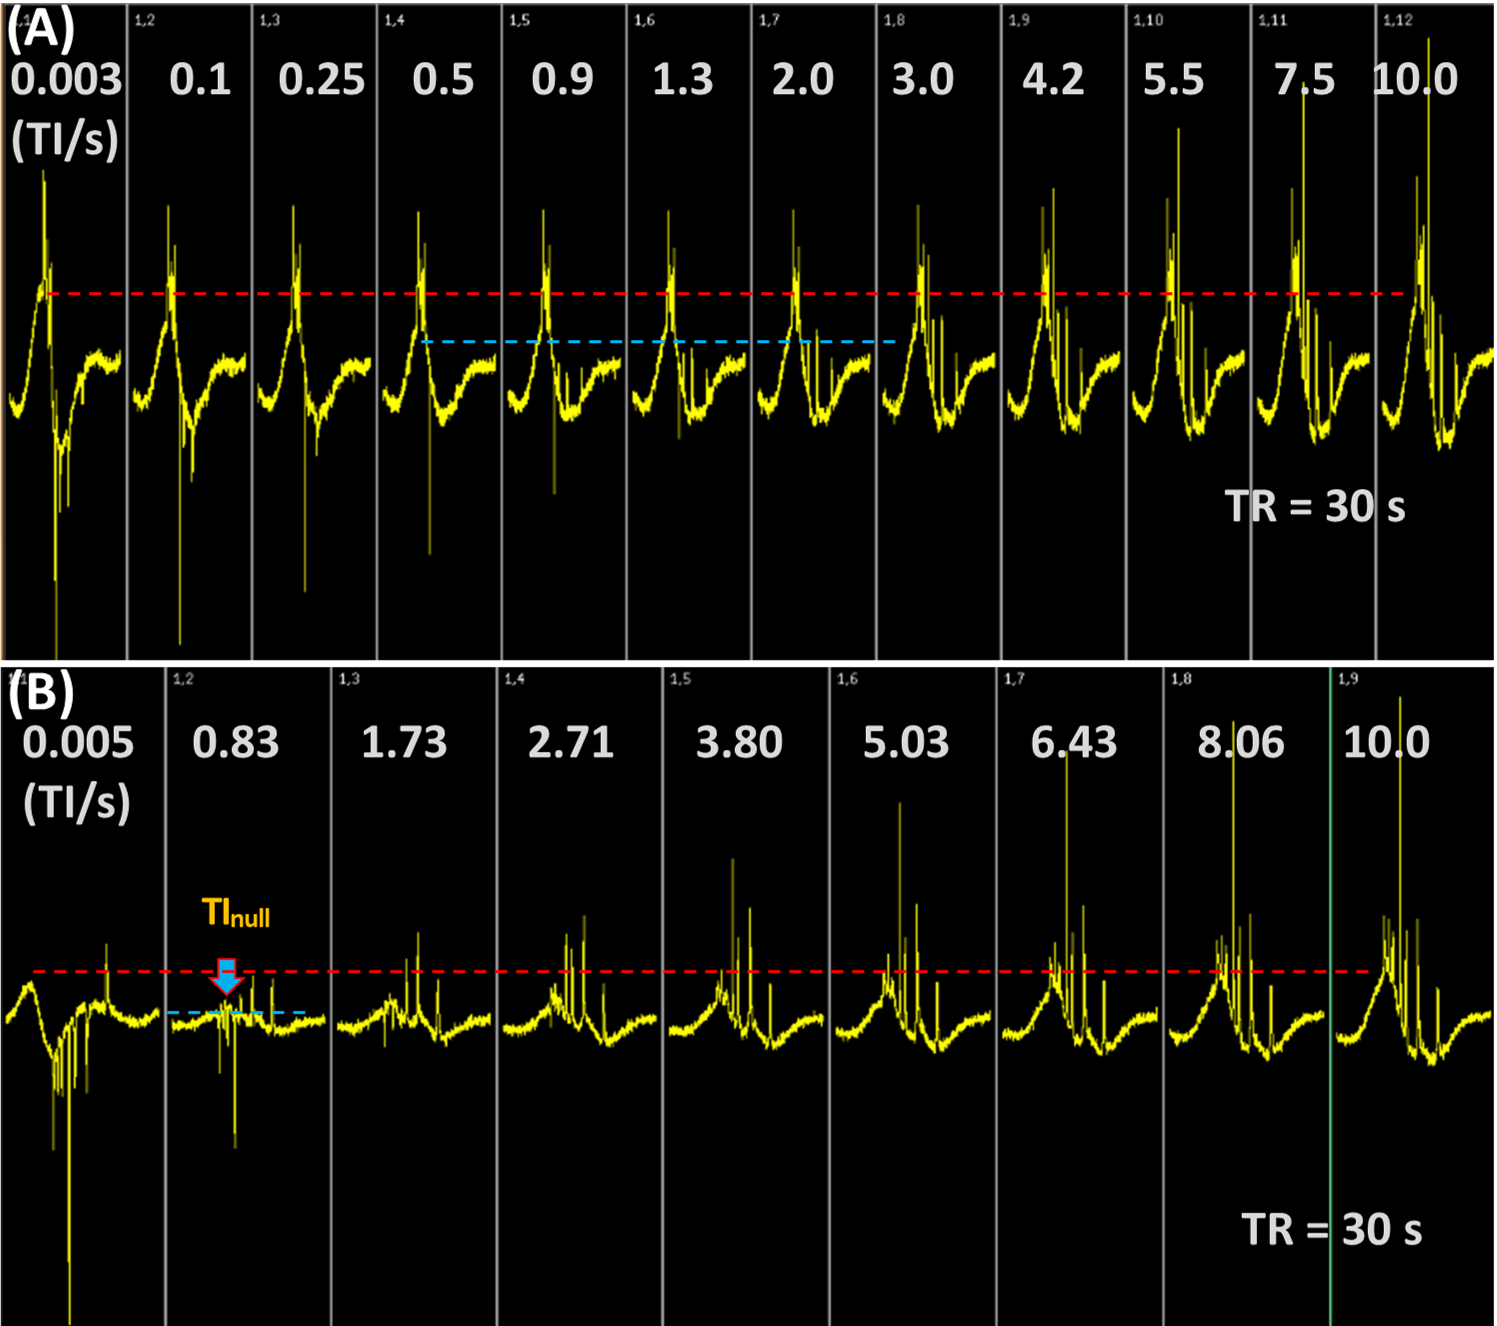
Figure 1 shows the group-averaged 31P signals acquired from the occipito-parietal region. The broad MPL signal accounts for ~85% of the total 31P signals in the spectra and can be easily extracted from mixed signals by spectral subtraction between two spectra acquired respectively at short- and long-DT. Figure 2 shows a clear contrast in DT dependence between the broad MPL signal and the sharp signals from small metabolites in the cytosol. Apparently, the MPL signal decays much faster than all those sharp 31P metabolite signals from ATP, PCr, GPC, GPE, Pi, PC and PE. The extracted MPL signals decay mono-exponentially with DT, yielding an apparent T2 relaxation time of 0.10 ms (Figure 3), which is 2~3 orders of magnitude shorter than those of sharp 31P signals (2). In reference to γ-ATP as endogenous concentration standard (at 3 mM), the estimated MPL concentration in this spectral series is 1.2 M after T2 effect correction. For the groups of subjects, MPL concentration is averaged 1.8 ± 0.7 M (ranging from 1 – 3 M).Figure 4(A) shows the exchange effect observed within the MPL signal when the half portion in the upfield is selectively inverted. The un-inverted half signal in the downfield displays an anticipated V-shaped change in intensity, characteristic of typical exchange effect (3). The MPL signal is seen first to decline as TI increases then it turns to recover toward the initial intensity after reaching to a minimum with 40% of signal reduction at TI ~ 1 s. Figure 4(B) shows that when the inverted MPL signal is increased to ~80%, the remaining un-inverted ~20% of the signal is nulled more rapidly, leveled at null point TI ~ 0.8 s. The subsequent recovery of the MPL is very slow, indicative of a long T1 in the order of 10 s.
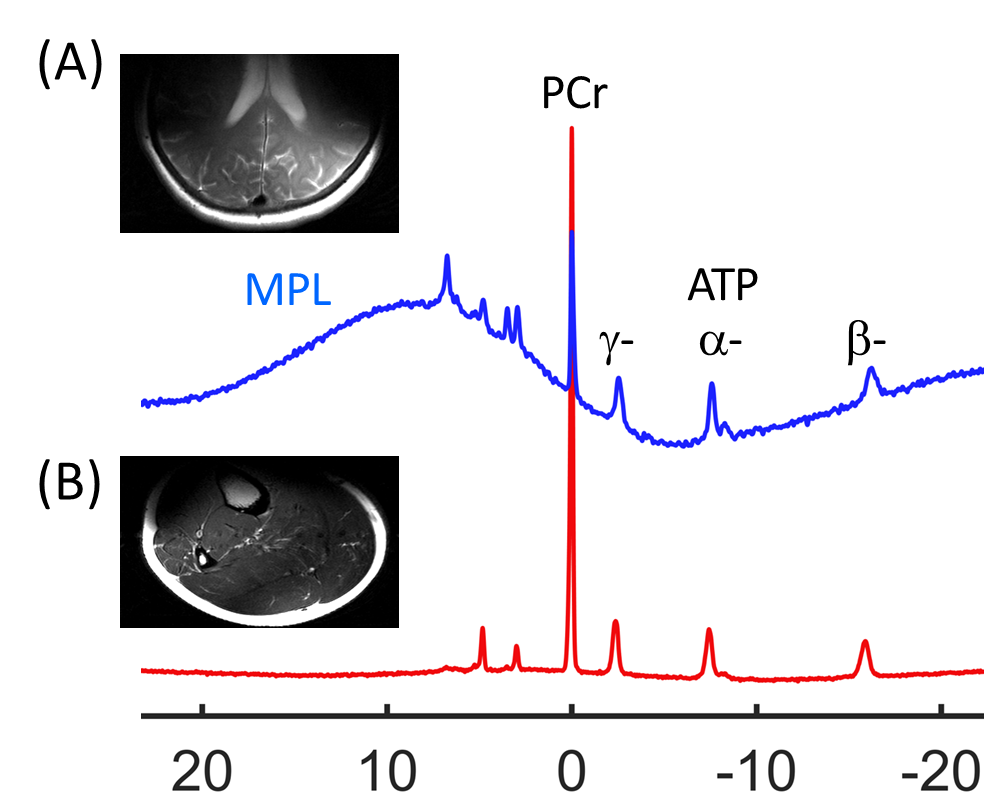
Figure 5 compares the MPL signals acquired from human brain (A) and calf muscle (B) under identical acquisition condition including detection coil and pulse sequence. Note that the broad MPL signal in the brain is 2 orders of magnitude larger than that in the muscle, suggesting that the MPL signal in the brain may be predominantly contributed from myelin, which is featured with layers of MPL sheaths wrapping around thin axons for rapid conduction of neuronal signaling.
CONCLUSION
In the present study, we demonstrated that MPL signals can be selectively detected using 31P MRS in the human brain. A high concentration of MPL in the order of 1M may provide a valuable surrogate point for studying myelin metabolism and demyelination in neurodegenerative diseases such as multiple sclerosis (MS).Acknowledgements
We thank instrumental support from the Human Imaging Core, the Advanced Imaging Research Center, at UTSW, operational assistance from Corey Mozingo, and technical support from Ivan Dimitrov.References
1. Kilby PM, Bolas NM, Radda GK. 31P-NMR study of brain phospholipid structures in vivo. Biochim Biophys Acta. 1991;1085(2):257-64. 2. Dorst J, Borbath T, Ruhm L, Henning A. Phosphorus transversal relaxation times and metabolite concentrations in the human brain at 9.4 T.NMR Biomed. 2022;35(10):e4776. 3. Ren J, Sherry AD, Malloy CR. Modular 31 P wideband inversion transfer for integrative analysis of adenosine triphosphate metabolism, T1 relaxation and molecular dynamics in skeletal muscle at 7T. Magn Reson Med. 2019;81(6):3440-3452. 4. Ren J, Yu F, Greenberg BM. ATP line splitting in association with reduced intracellular magnesium and pH: a brain 31 P MR spectroscopic imaging (MRSI) study of pediatric patients with myelin oligodendrocyte glycoprotein antibody-associated disorders (MOGADs). NMR Biomed. 2023;36(2):e4836.
Figures