4332
MRI measurements of field modulations: Extended frequency range of spin-lock preparation with off-resonance pulses1Section for Magnetic Resonance, DTU Health Tech, Technical University of Denmark, Copenhagen, Denmark, 2Danish Research Centre for Magnetic Resonance, Centre for Functional and Diagnostic Imaging and Research, Copenhagen University Hospital - Amager and Hvidovre, Copenhagen, Denmark
Synopsis
Keywords: Signal Modeling, New Signal Preparation Schemes
Motivation: Mapping current flow during temporal interference stimulation (kHz range) or the application of tumor treating fields (100 kHz - 300 kHz) can improve target localization and dose control for these techniques.
Goal(s): Explore novel encoding strategies to measure high-frequency magnetic field modulations caused by injected currents.
Approach: We use Bloch simulations to explore novel encoding strategies and phantom measurements with currents that create magnetic fields modulations for validation.
Results: We show that with off-resonance preparation pulses it is possible to be sensitive to high frequency field modulations while avoiding SAR and B1 limits, albeit with a lower sensitivity than previously suggested spin-lock methods.
Impact: This work demonstrates the possibility of measuring time-varying fields at a much greater frequency range than previously possible, which can be crucial for high-frequency brain stimulation techniques such as temporal interference stimulation and tumor treating fields.
Introduction
The measurement of time-varying magnetic fields in MRI has multiple potential applications. In magnetic resonance current density imaging (MRCDI), magnetic fields in the human brain arising from injected currents have been measured at <20 Hz frequencies by alternating the current polarity for each TR1,2. MRCDI’s main application is validating computational head models brain stimulation3. The possible frequency range for MRCDI is appropriate for this purpose. However, there are other applications where a higher frequency might be of interest, such as measurement of neuronal currents (0.05 – 500 Hz), transcranial alternating current or random noise stimulation (0.1 - 640 Hz)4, temporal interference stimulation (kHz range)5, and tumor-treating fields (100 – 300 kHz)6. Spin-lock preparation has been suggested for measuring reduced T1ρ relaxation during the presence of neuronal currents7, which can be tuned to be sensitive to a certain frequency. Other versions with increased sensitivity (assuming a similar phase of the oscillatory field within a voxel) have later been suggested8 and referred to as spin-lock oscillatory excitation. However, the maximum frequency that can be measured with spin-locking is limited by SAR and the maximum B1 amplitude. Multiphoton MRI, where excitation occurs using an off-resonance RF pulse and a secondary time-varying field along B0, has recently been demonstrated9. Here, we show that multiphoton excitation can be understood as a change in the nutation angle relative to the axis of precession being the effective field vector (Beff). The nutation caused by a secondary time-varying field also occurs during an on-resonance RF pulse. This is very similar to spin-locking with the main difference being that Beff is not parallel to the net magnetization vector. Finally, we show experimentally that the highest sensitivity to an oscillatory field is obtained when the RF pulse is on resonance and is reduced linearly with |B1| as the detuning increases for fixed |Beff|.Methods
The frequency that gives rise to the nutation away from Beff is equal to the effective precession frequency\begin{equation}
f_{z} = \sqrt{\Delta f_{rf}^2+(\gamma|\bf{B}_1|)^2} = \gamma|\bf{B}_{eff}|
\end{equation}
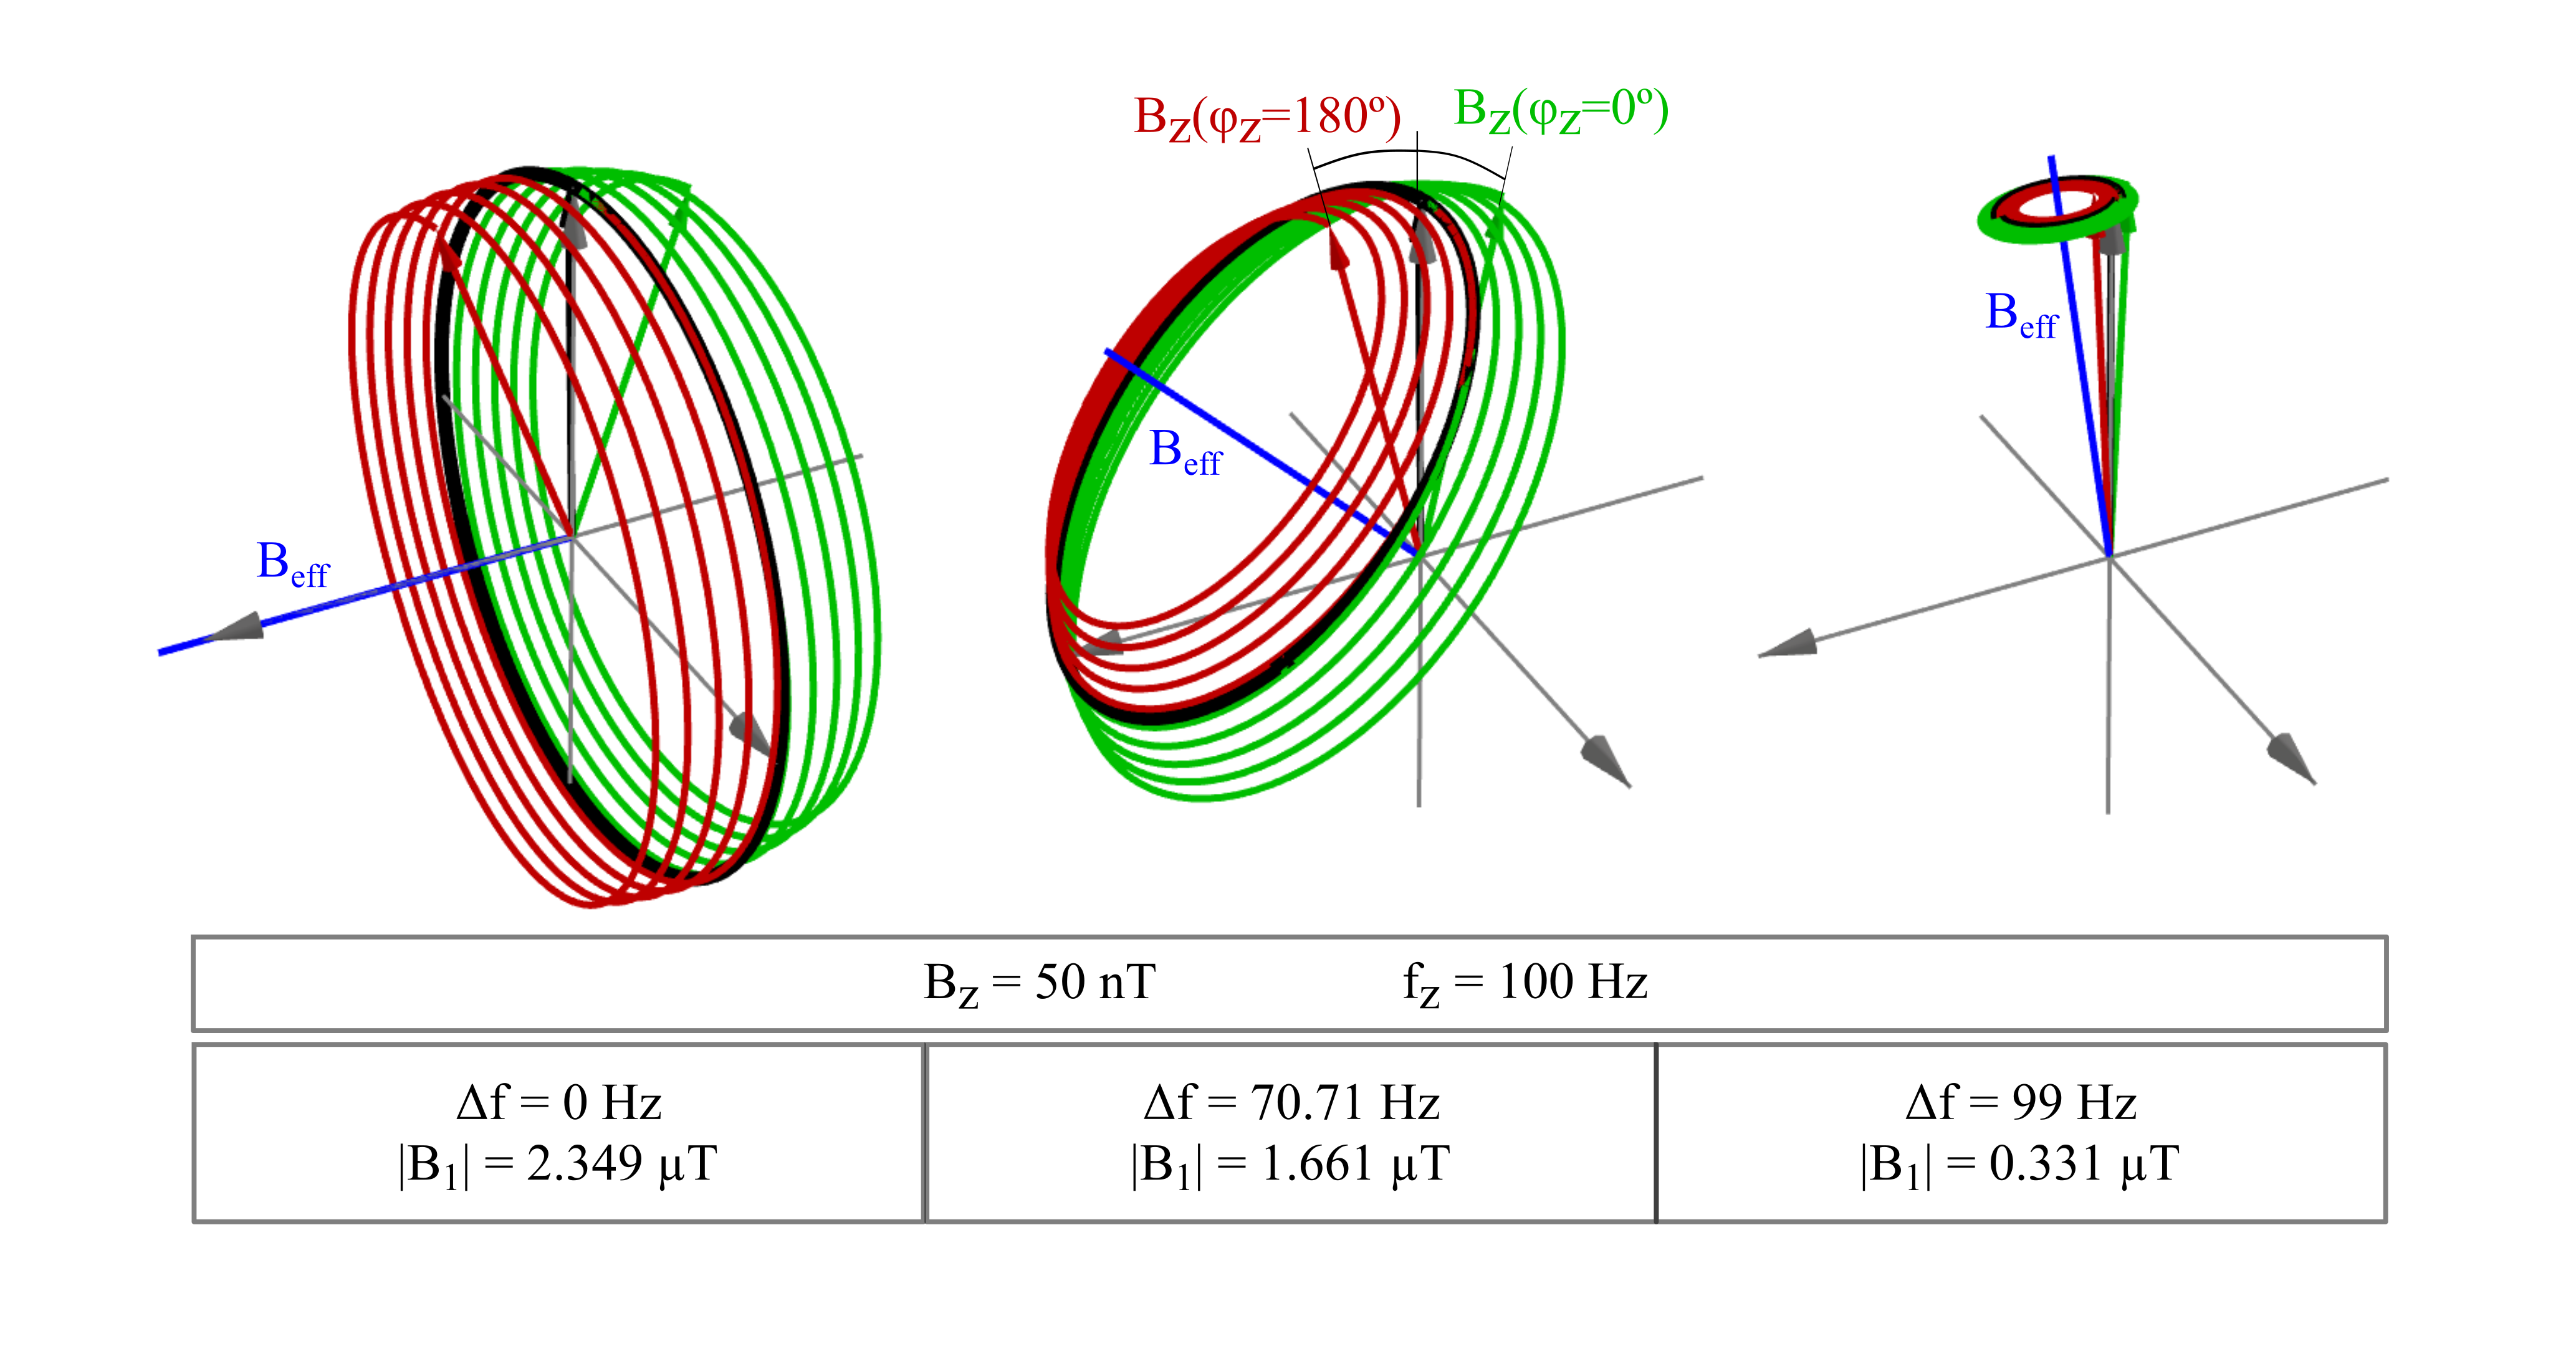
where $$$\Delta f_{rf}$$$ and $$$|\bf{B}_1|$$$ are the detuning frequency and amplitude of the preparation RF pulse and γ is the gyromagnetic ratio of protons. The same is true for spin-locking, where $$$\Delta f_{rf}$$$ is usually minimized. To visualize the nutation caused by a modulated magnetic field (Bz), we simulated the situation using KomaMRI10 for varying amplitudes and detunings of the RF preparation pulse. The modulation frequency of Bz was 100 Hz and fz was kept at 100 Hz according to Eq. 1.
The sequence diagram is depicted in Figure 1 and described in the caption. The sequence was implemented on a 3T MR scanner (MAGNETOM Prisma; Siemens Healthcare, Erlangen, Germany). In the measurements, Bz was induced from currents passing through a cable with three loops around a phantom using a current-controlled source. The current was 4 mA resulting in approximately 50 nT magnetic fields. The current waveform was created and synced with the sequence using an Arduino with a trigger input from the scanner. The phase of the current (φz) alternated between 0º and 180º for every other image, resulting in an opposite nutation angle (Figure 2). The Bz-induced difference (IBz) is calculated as the magnitude of the difference between the two complex images.
Results
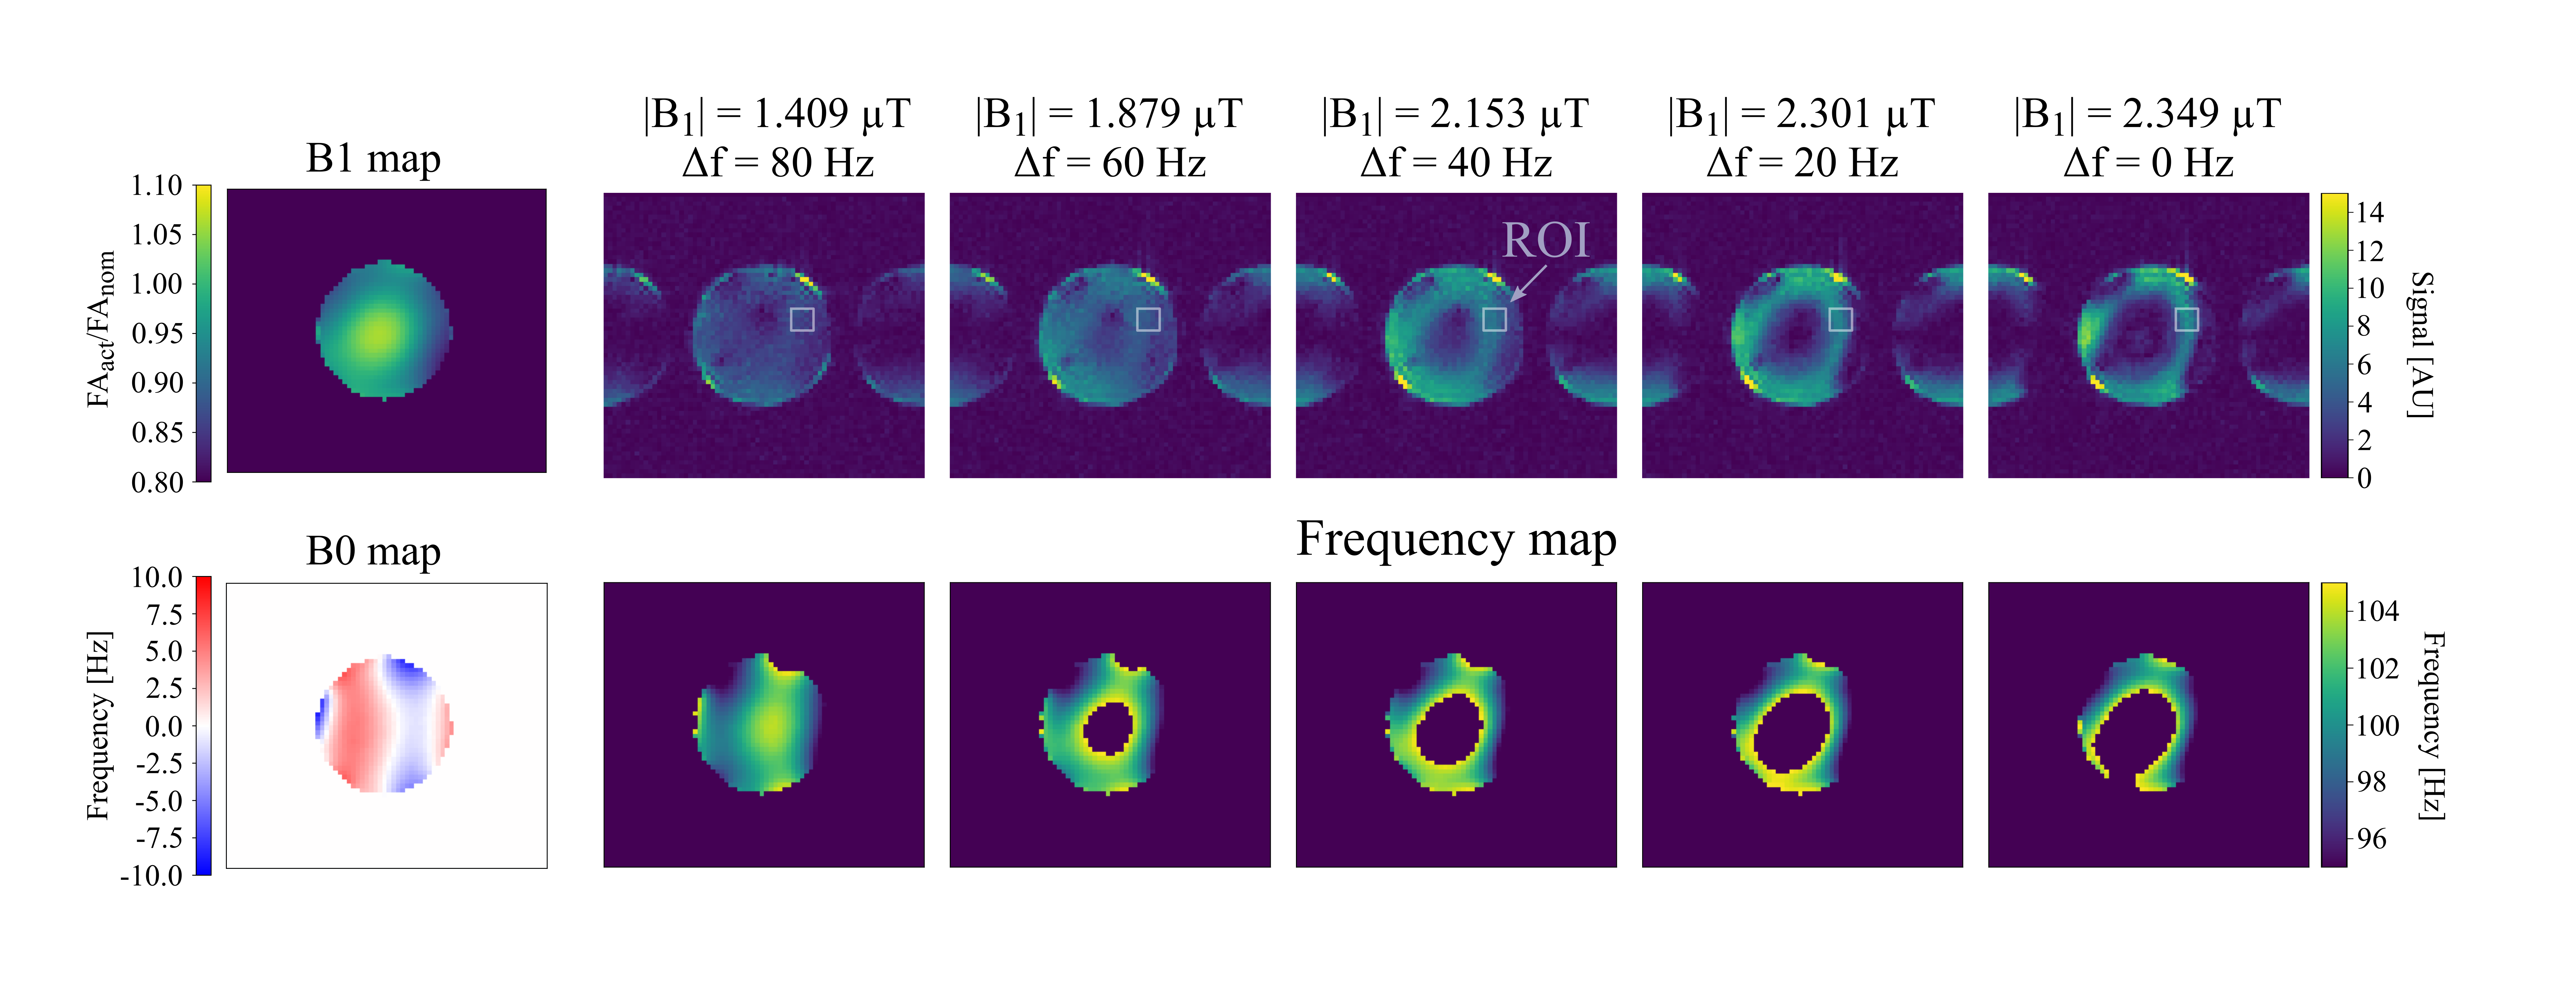
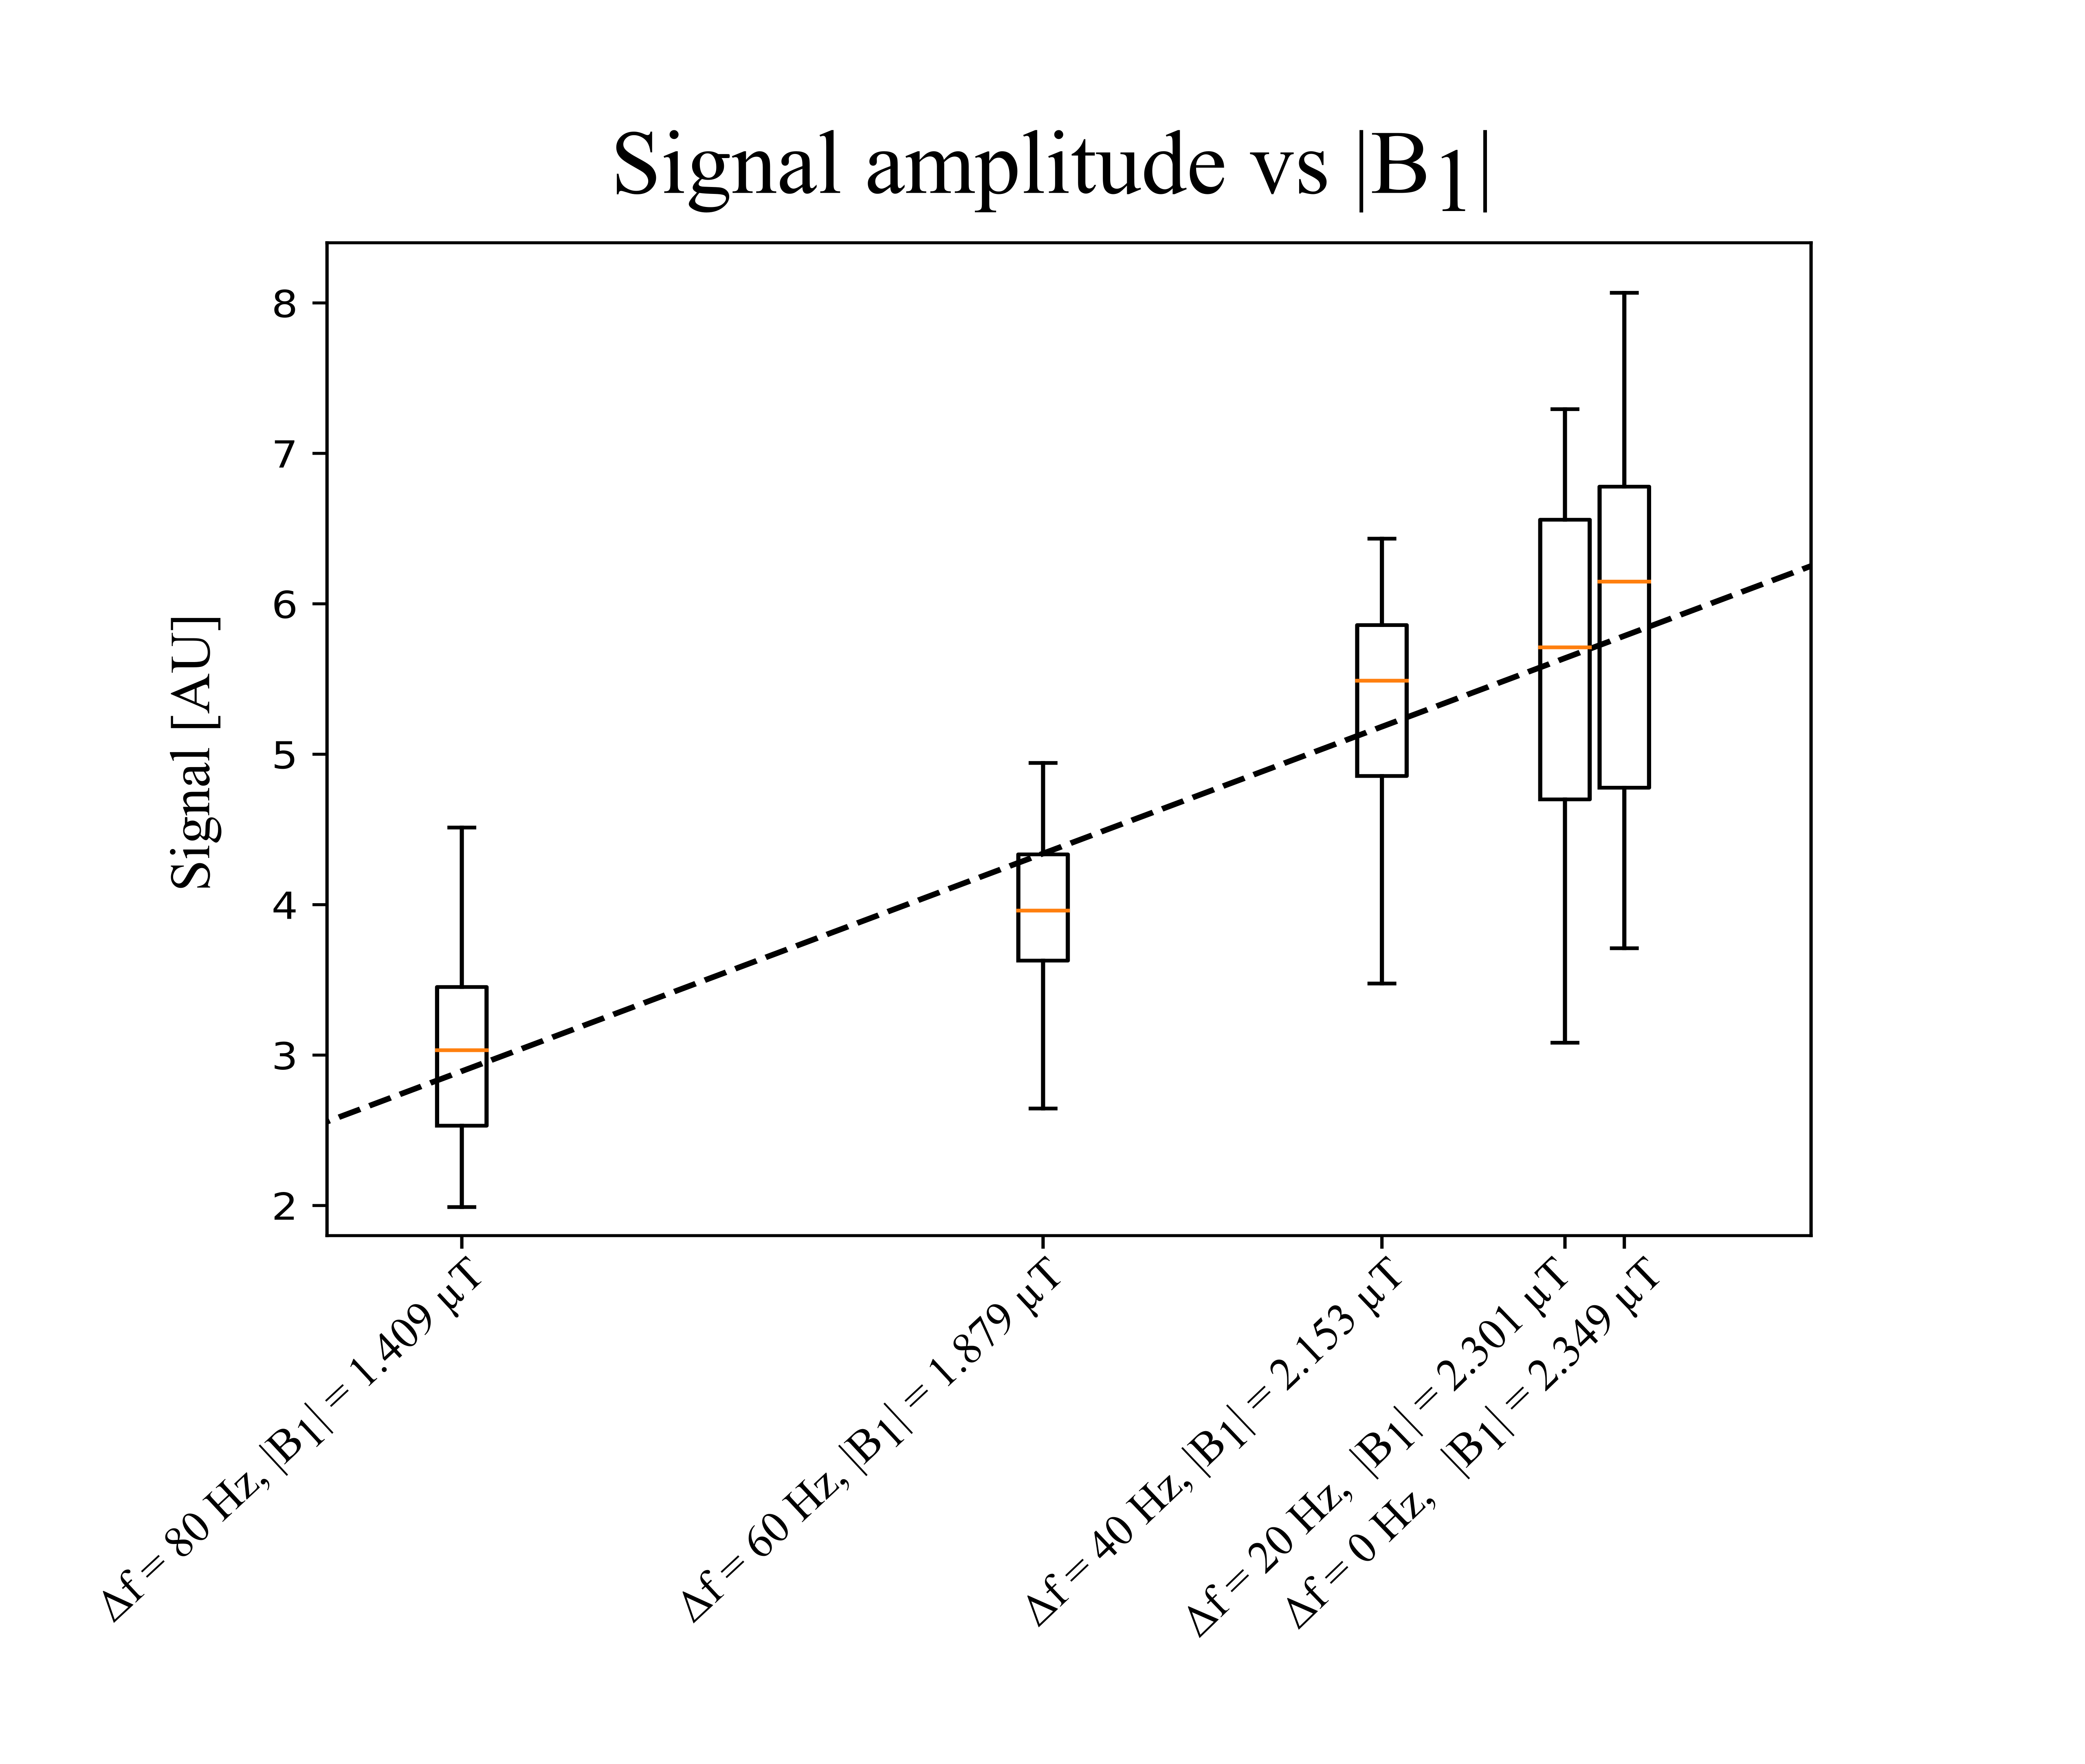
The results from the simulations are presented in Figure 2. In agreement with previous literature9 the nutation angle is proportional to |B1|. IBz images are shown in Figure 3 (top right). It is clear that IBz has the highest signal in the voxels that are most sensitive to 100 Hz ± 5Hz. Figure 4 shows the mean signal in a ROI (outlined in Figure 3) for each of the five images. A linear fit shows that the signal is approximately linearly decreasing with B1, as may be expected, but that is somewhat compromised by B0 and RF field variations across the imaged slices. Field inhomogeneities need to be addressed for quantitative measurements, e.g. by measuring with several B1 amplitudes or detunings.Discussions and conclusion
We have here shown that multiphoton excitation can be understood as a nutation away from the procession around Beff and that this nutation is also present for on-resonance conditions, which is closely related to oscillatory excitation during a spin-lock pulse. The highest sensitivity to Bz is achieved for an on-resonance condition where B1 is highest. However, if SAR or |B1| is exceeded the desired resonance frequency can still be achieved by detuning the preparation pulse following Eq. 1. This can be crucial for measuring high-frequency fields used for example in temporal interference stimulation and tumor treating fields.Acknowledgements
This study was supported by the Lundbeck Foundation (grants R313-2019-622 and R244-2017-196 to AT; R324-2019-1784 to LGH).References
1. Göksu, C. et al. Human in-vivo brain magnetic resonance current density imaging (MRCDI). Neuroimage 171, 26–39 (2018).
2. Kasinadhuni, A. K. et al. Imaging of current flow in the human head during transcranial electrical therapy. Brain Stimul 10, 764–772 (2017).
3. Eroğlu, H. H. et al. On the Reconstruction of Magnetic Resonance Current Density Images of the Human Brain: Pitfalls and Perspectives. Neuroimage 243, (2021).
4. Antal, A. & Paulus, W. Transcranial alternating current stimulation (tACS). Front Hum Neurosci 7, 1–4 (2013).
5. Fields, I. E. et al. Noninvasive Deep Brain Stimulation via Temporally Article Noninvasive Deep Brain Stimulation via Temporally Interfering Electric Fields. Cell 169, 1029-1041.e16 (2017).
6. Rominiyi, O. et al. Tumour treating fields therapy for glioblastoma: current advances and future directions. Br J Cancer 124, 697–709 (2021).
7. Witzel, T., Lin, F. H., Rosen, B. R. & Wald, L. L. Stimulus-induced Rotary Saturation (SIRS): A potential method for the detection of neuronal currents with MRI. Neuroimage 42, 1357–1365 (2008).
8. Jiang, X. et al. Detection of subnanotesla oscillatory magnetic fields using MRI. Magn Reson Med 75, 519–526 (2016).
9. Han, V. & Liu, C. Multiphoton magnetic resonance in imaging: A classical description and implementation. Magn Reson Med 84, 1184–1197 (2020).
10. Castillo-Passi, C. et al. KomaMRI.jl: An open-source framework for general MRI simulations with GPU acceleration. Magn Reson Med 90, 329–342 (2023).
Figures
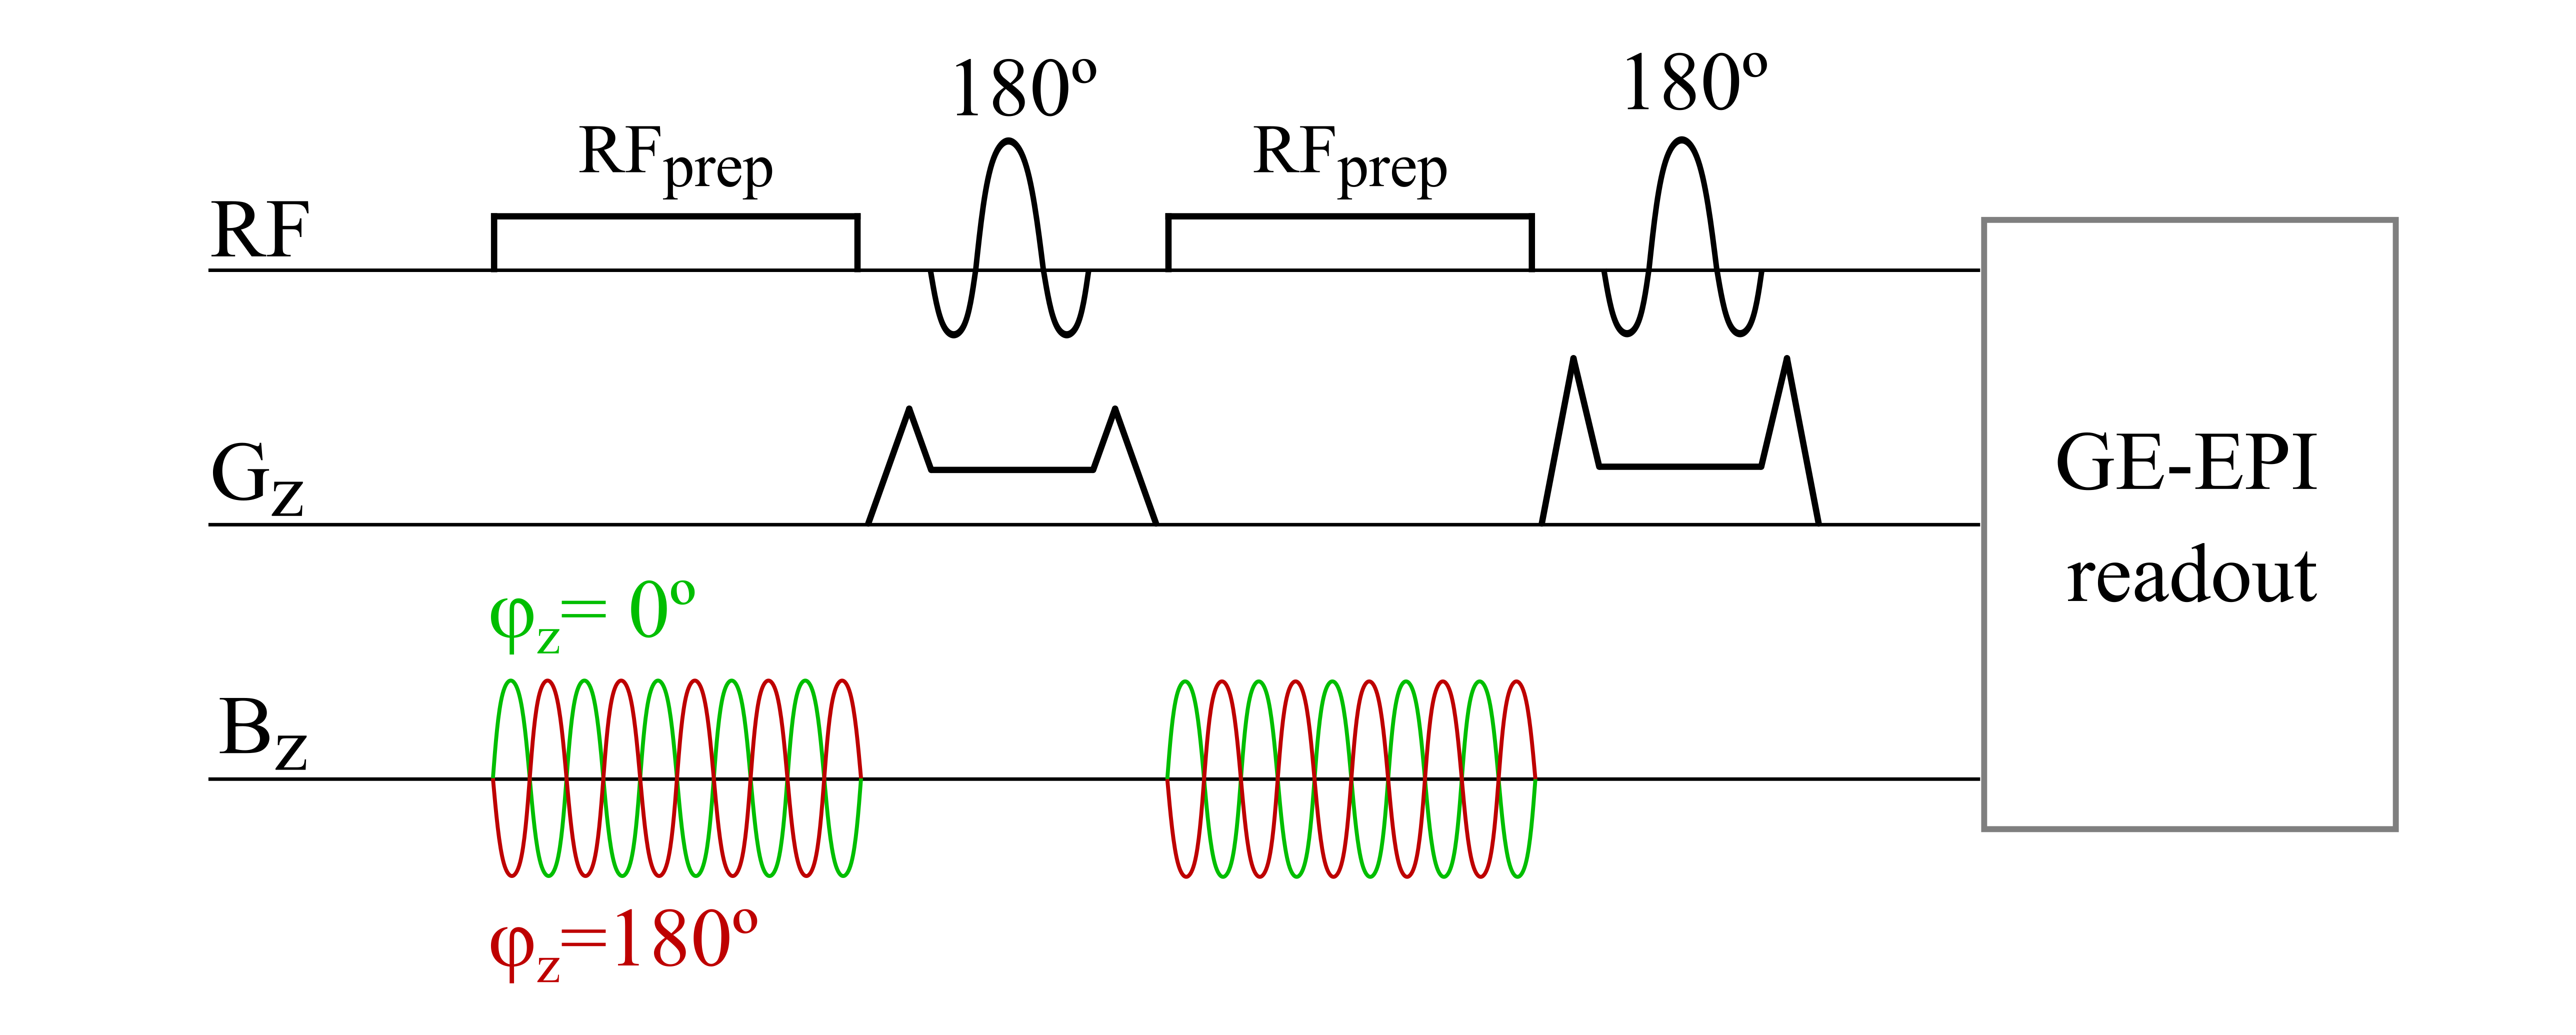
Sequence diagram used in the experiment. Encoding of the time-varying field BZ happens during the two RFprep pulses, each of duration 50 ms. The first 180º degree pulse acts as compensation for B0 and B1 field inhomogeneities (hyperecho). The phases of the RF pulses are important to ensure this refocusing. The second 180º crushes out-of-slice excitation. TR = 186 ms, TE = 169 ms, isotropic 5 mm voxels.