4331
Simultaneously T2 and T2* mapping via MOLED acquisition and deep learning for oxygen extraction fraction measurement1Department of Electronic Science, Xiamen University, Xiamen, China, 2Clinical & Technical Support, Philips Healthcare, Shenzhen, China, 3Department of Radiology, Zhongshan Hospital Fudan University Xiamen Branch, Xiamen, China, 4Department of Magnetic Resonance Imaging, the First Affiliated Hospital of Zhengzhou University, Zhengzhou, China
Synopsis
Keywords: Signal Modeling, Data Analysis, OEF
Motivation: Quantitative MRI for the measurement of oxygen extraction fraction (OEF) offers the advantage of being radiation-free. However, the quantification of T2 and T2∗ parameters still suffers from long acquisition time, especially in dynamic imaging.
Goal(s): To evaluate the applicability of ultrafast dynamic multiple overlapping-echo detachment (MOLED) imaging for OEF research.
Approach: The MOLED imaging was utilized for rapidly and synchronously mapping T2 and T2∗ to dynamically track OEF changes during both breathing and breath-holding conditions.
Results: The time envelope of mean OEF under both breathing and breath-holding is in agreement with the literature reported.
Impact: Owing to its fast and dynamic imaging capabilities, the multiple overlapping-echo detachment (MOLED) T2-T2* acquisition has shown great potential in the quantitative measurement of the brain's oxygen metabolism, which holds significant relevance in assisting the diagnosis of diseases.
Introduction
The oxygen extraction fraction (OEF) refers to the proportion of oxygen extracted from the blood supplied to tissues. Its significance extends to the diagnosis of stroke, brain injury and cognitive impairment.1,2 Positron emission tomography (PET) is the gold standard for OEF measurement and involves inherent radiation. Therefore, MRI-based methods hold significant importance. Currently, T2 and T2∗ quantification still suffer from long acquisition time, especially in dynamic imaging, which is detrimental to the dynamic tracking of OEF. Moreover, obtaining T2 and T2∗ typically requires separate acquisition of two sequences. A rapid multiple overlapping-echo detachment (MOLED) acquisition method has been developed for simultaneous T2 and T2∗ mapping.3-6 In this work, we used MOLED to quantitatively measure T2-T2∗ and dynamically track OEF under both breathing and breath-holding conditions.Methods
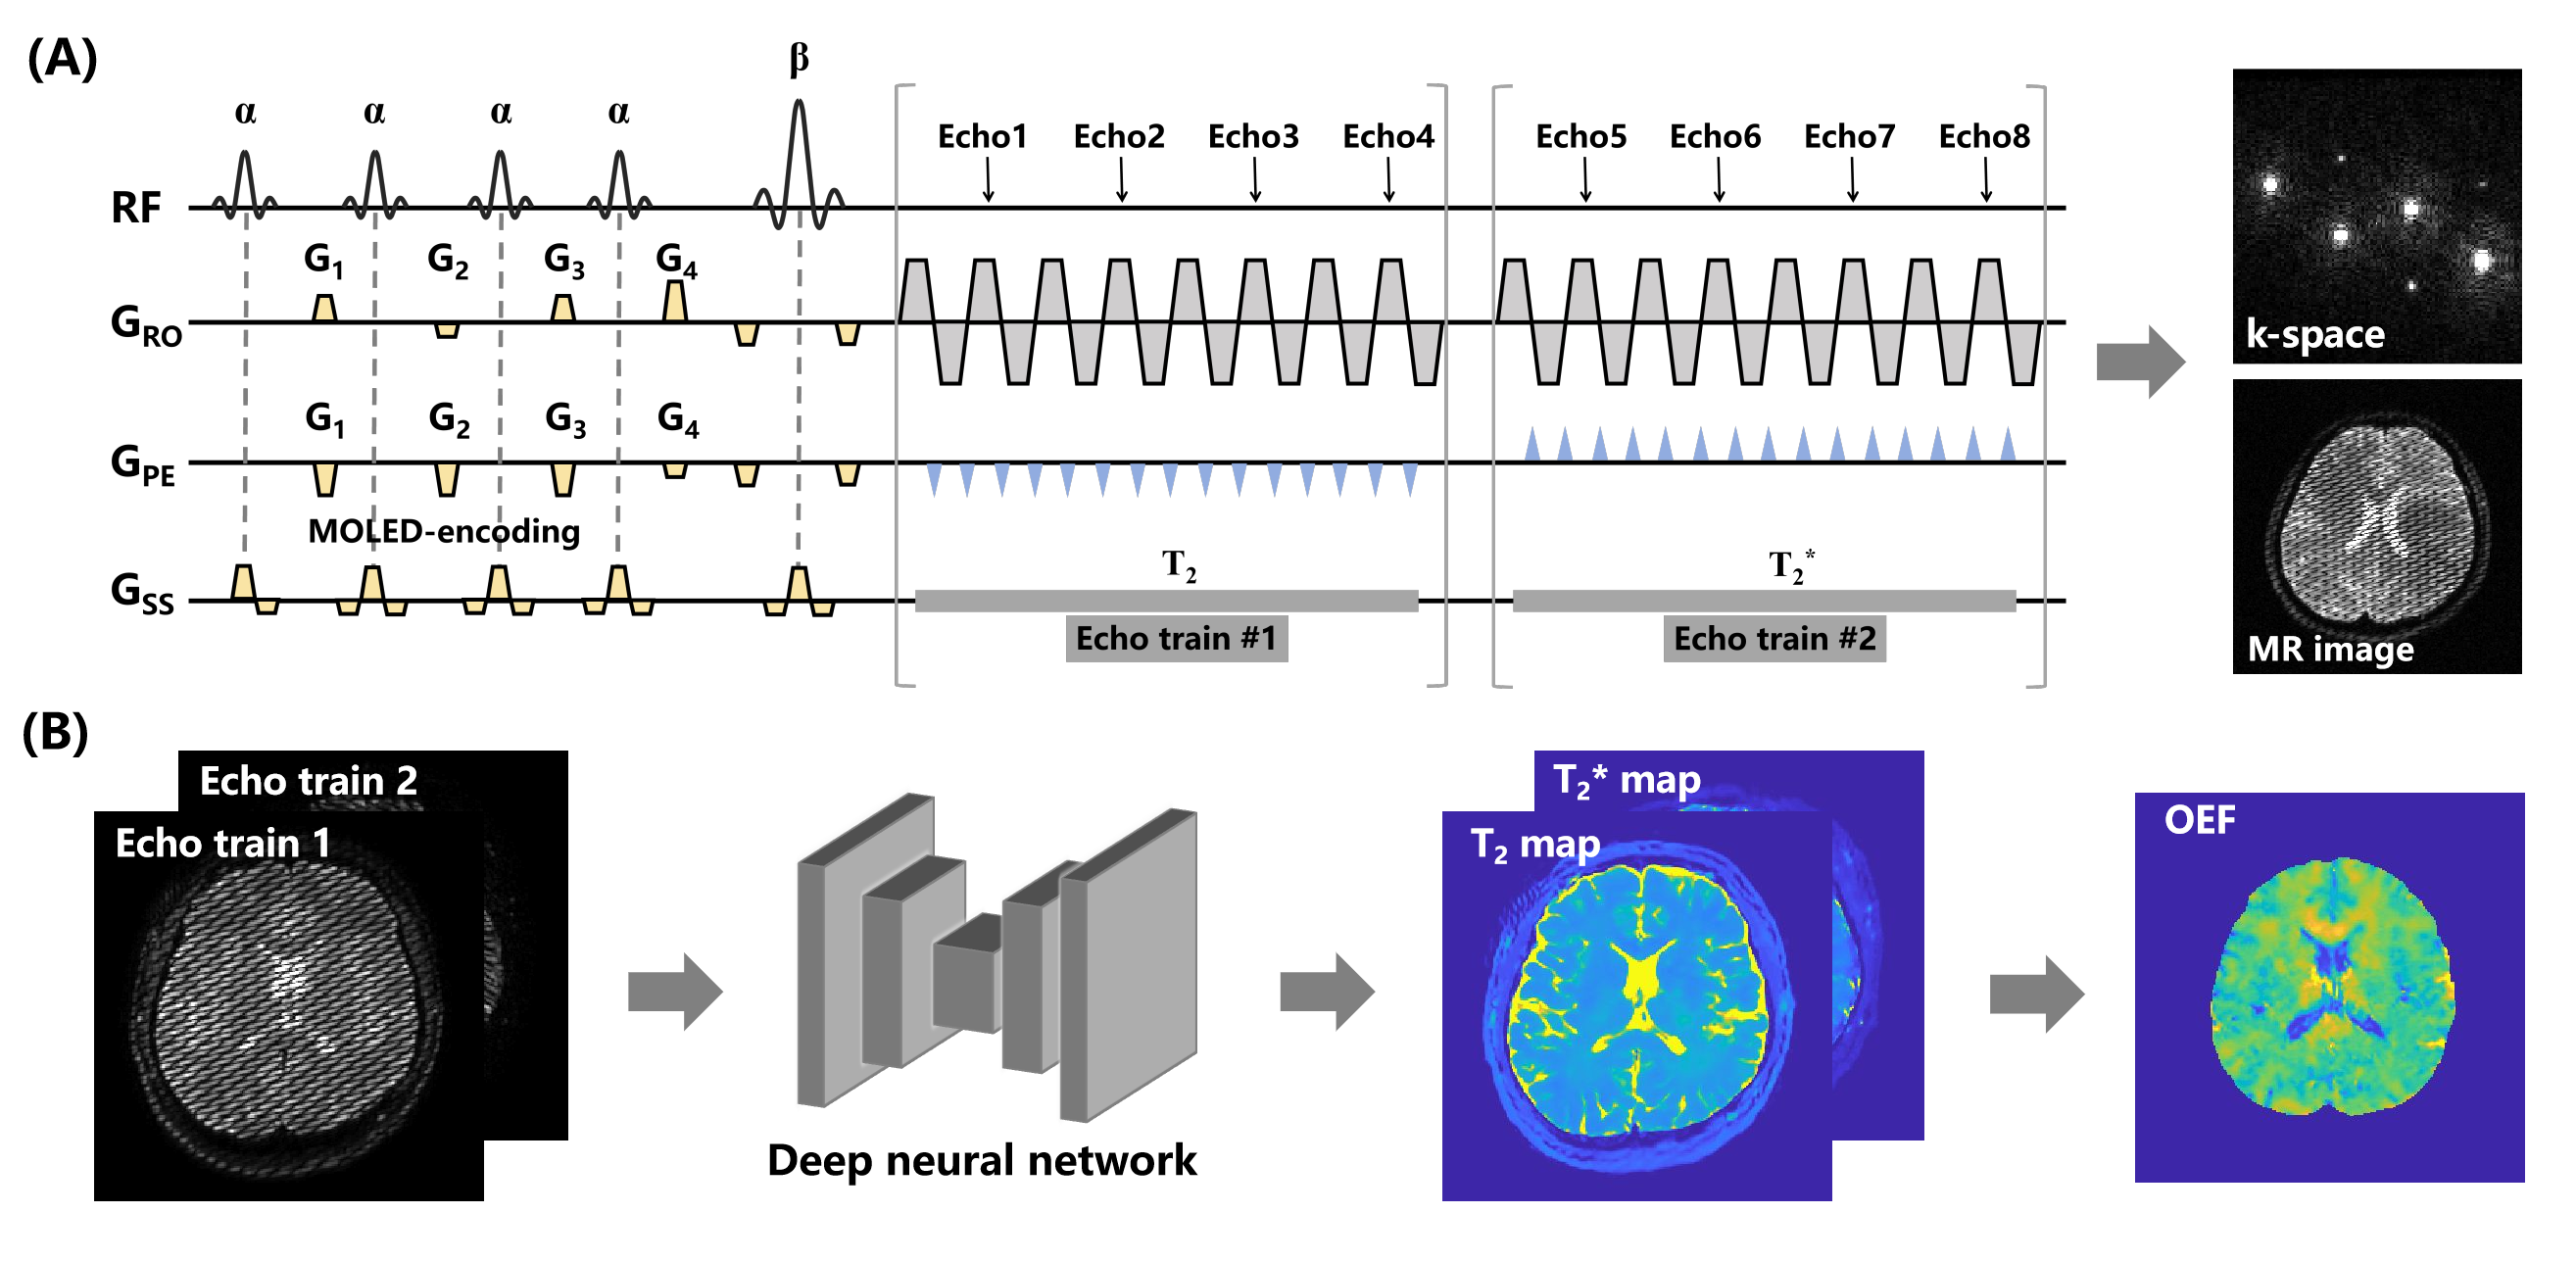
MOLED T2-T2* sequence: Figure 1(A) presents the single-shot MOLED T2-T2∗ sequence and the MOLED images. The MOLED image from the first echo train includes various T2-weighted signals for T2 mapping, while the MOLED image from the second echo train includes multiple T2*-weighted signals for T2* mapping.Deep learning reconstruction: As Figure 1(B) shows, the input of the reconstruction network is the acquired MOLED images, and the output is the T2 and T2∗ maps. The deep neural network was trained through synthetic data and then tested on real data. The data synthesis was based on Bloch simulation using MRiLab software,7 the parameters used in simulation were consistent with those used in phantom and in-vivo experiments. For the phantom data, the network trained with templates composed of random geometric shapes was used for reconstruction. As for the in-vivo data, the templates consisted of the human brain texture. A total of 2,700 paired samples were synthesized for network training.
OEF model: According to the simplified OEF model, OEF maps are directly dependent on the relaxation rate R2' :8 $$ OEF = \frac{R_{2}^{'}}{\frac{4}{3}\cdot\lambda\cdot\pi\cdot\gamma\cdot\triangle_{\chi_{0}}\cdot H_{ct}\cdot B_{0}} $$ R2' can be calculated from T2 and T2∗. Among them, λ is the venous blood volume fraction and was set to 3%.8 Hct is the fractional hematocrit and was set to 0.36.8 is the susceptibility difference between the fully oxygenated and deoxygenated blood and was set to 0.246 ppm per unit Hct.9 γ is the gyro-magnetic ratio and B0 is the main magnetic field strength.
Experiments and evaluation: A phantom was constructed, which consisted of 9 small tubes filled with MnCl2 solution of different concentrations. The acquisition parameters of MOLED were as follows: FOV = 220 × 220 cm2, matrix size = 128 × 128, voxel size = 1.7 × 1.7 mm2, slice thickness = 3 mm, TR = 6 s and slice number = 10. For comparison, conventional SE sequence with five different TEs (20, 40, 60, 90, 120 ms) and GRE sequence with six different TEs (8, 16, 24, 32, 40 ms) were acquired to provide reference T2 and T2∗ maps. For in-vivo experiments, two healthy volunteers were scanned using 3T scanner (Ingenia CX, Philips Healthcare, Best, The Netherlands) with the same sequence parameters as those used for the phantom experiment except for the slice thickness, which was set to 21. For breathing and breath-holding experiments, dynamic imaging was performed using the MOLED sequence. The data from two volunteers were collected using a breathing-hold protocol with 45 seconds for a cycle of normal respiration and breath-holding and three cycles were collected, resulting in an acquisition time of 4.5 minutes. The volunteers signed ethical consent agreements before the study.
Results
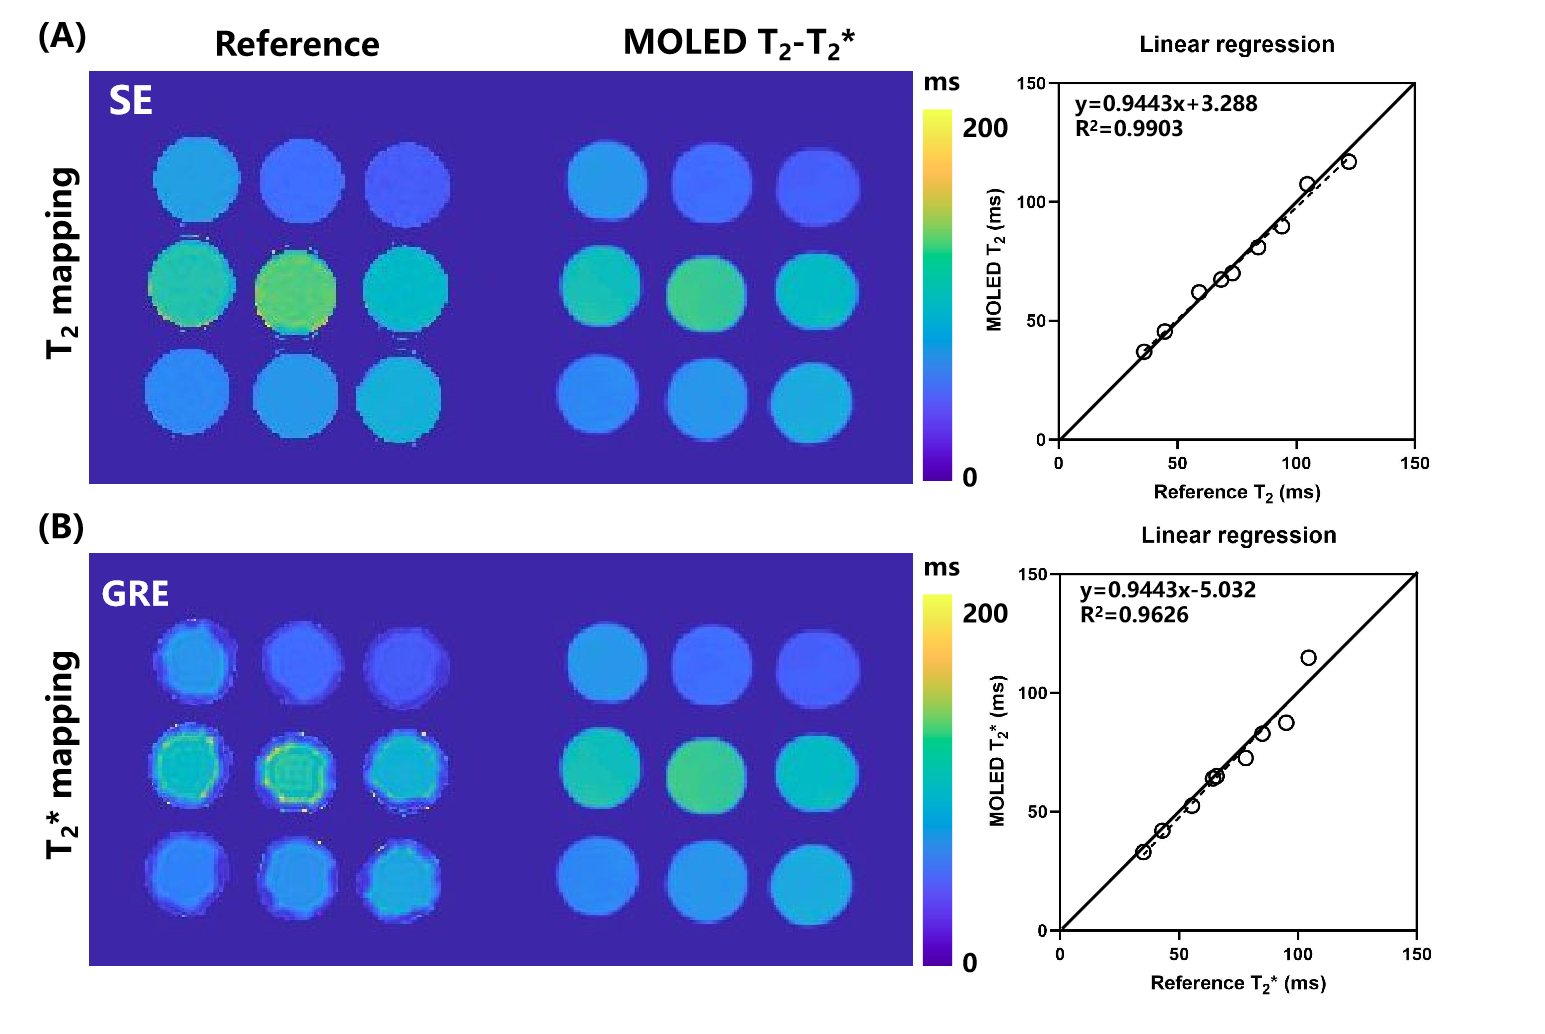
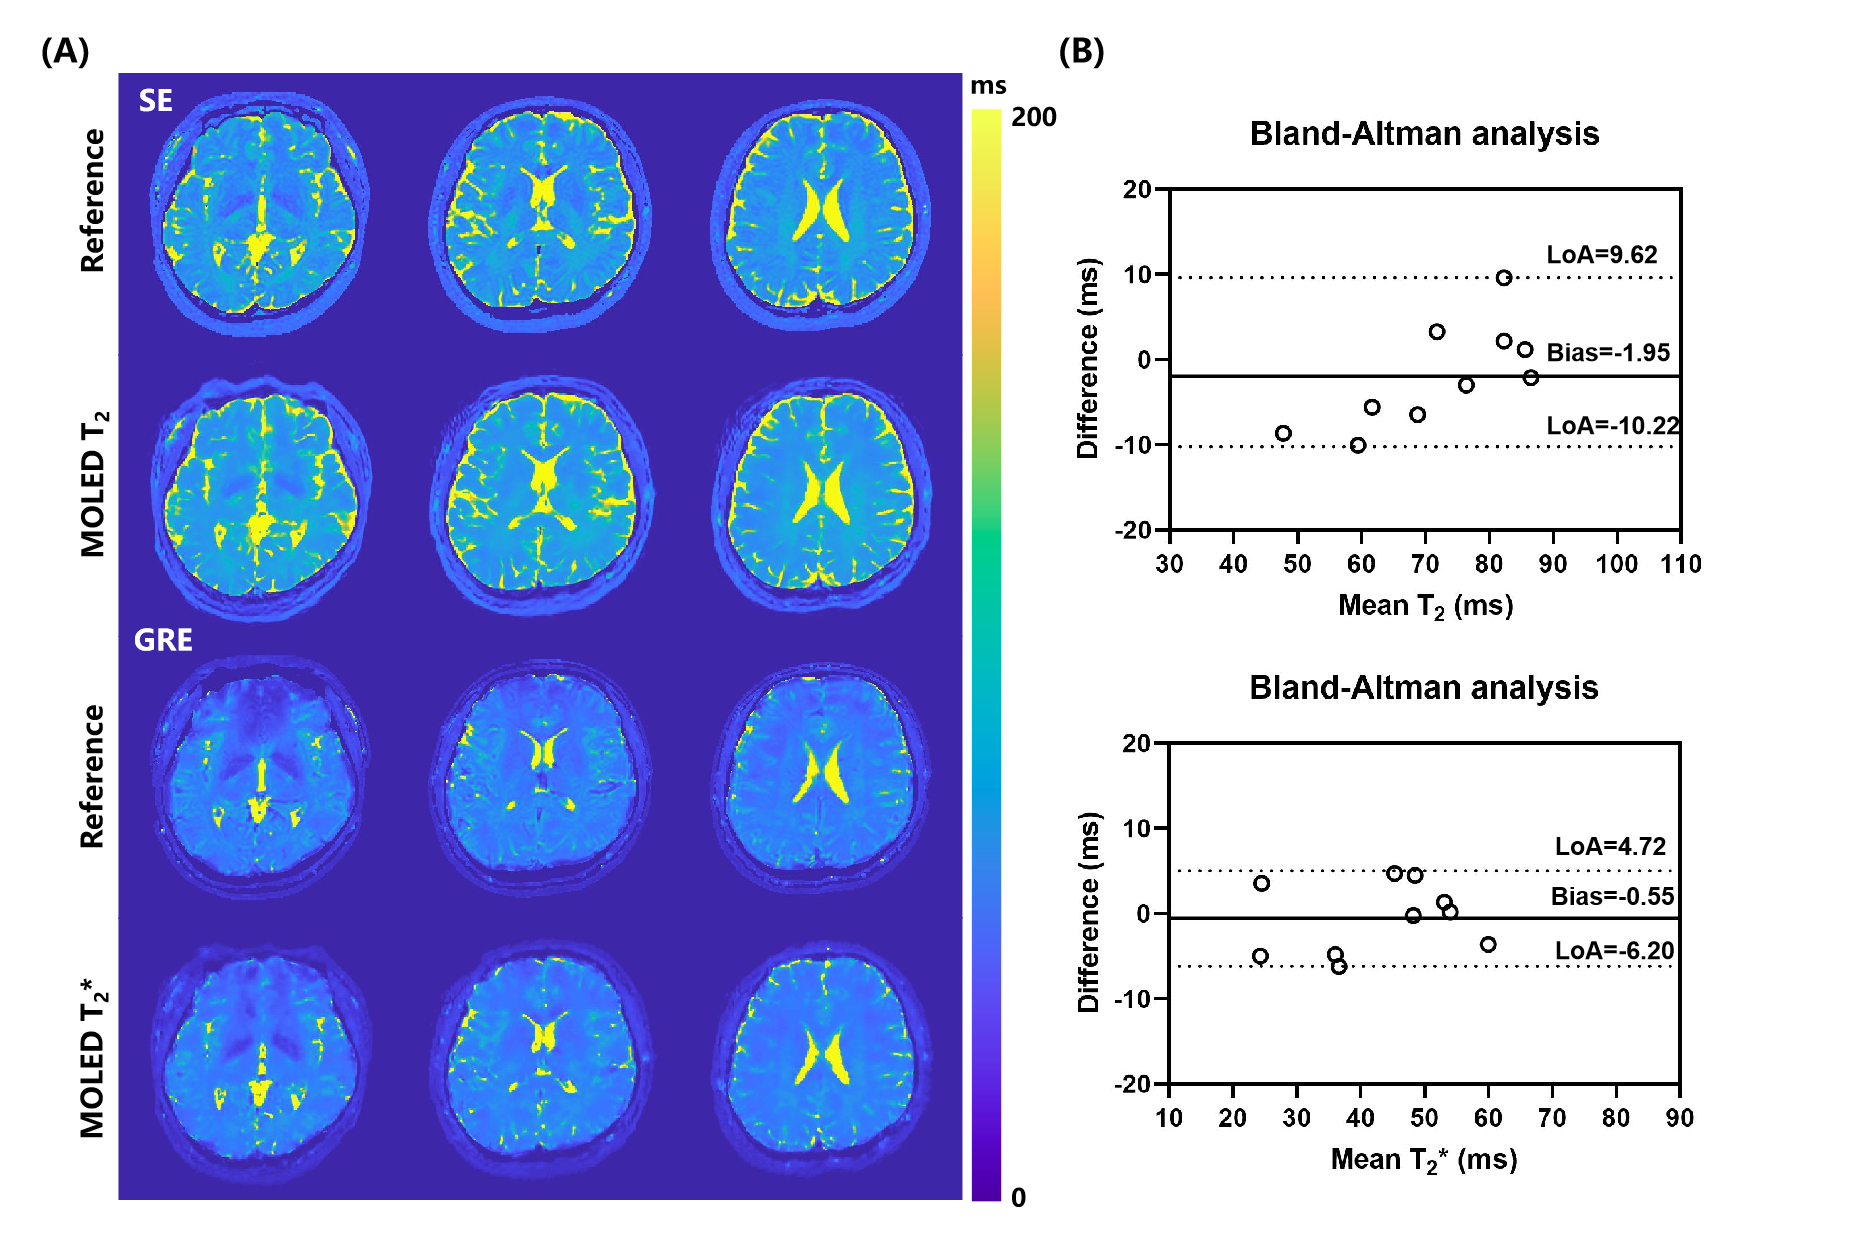
The T2 and T2∗ values of water phantom derived from MOLED were compared with the reference ones in Figure 2. Both results agree well with the references with R2 = 0.990/0.963.Figure 3 shows the in-vivo T2 and T2∗ maps of one of the volunteers acquired with SE/GRE and MOLED. Based on the visualization results and Bland-Altman analysis, all parametric maps from MOLED demonstrate good agreement with the references.
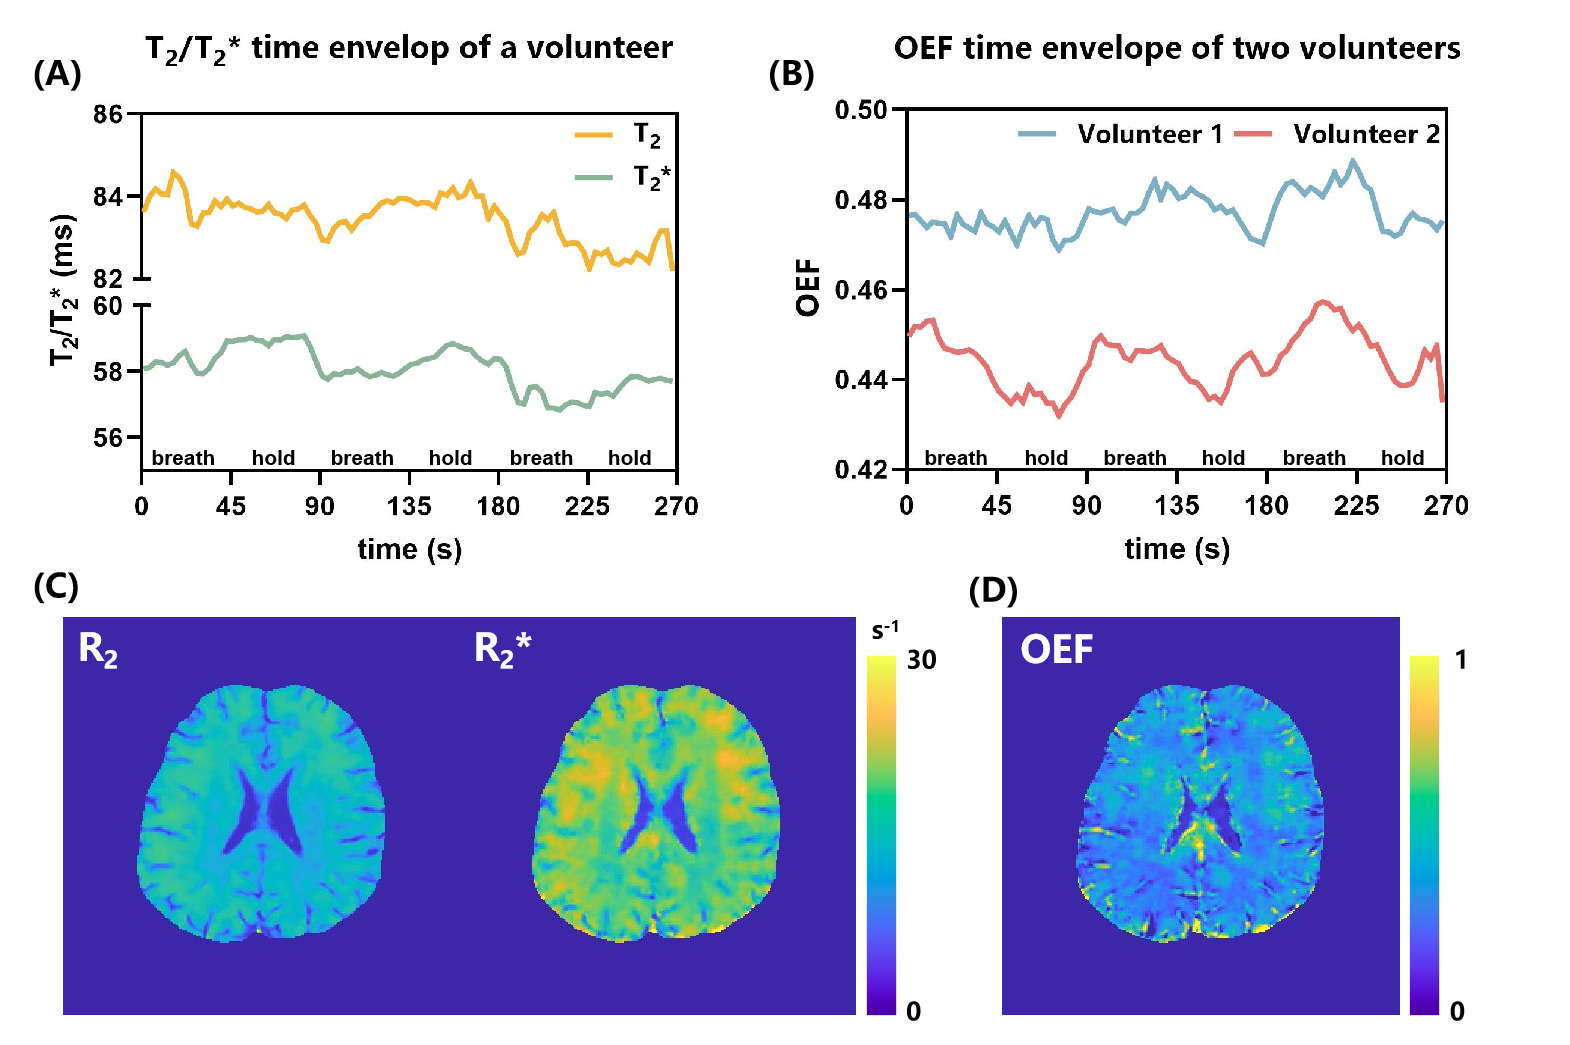
In Figure 4, the changes in OEF/T2/T2* values during breath-holding and breathing cycles were plotted, and quantitative maps of R2/R2*/OEF are also shown from one representative slice. The time envelope of mean OEF shows a decreasing OEF during breath-hold, followed by recovery during normal breathing, which aligns with the trend previously observed.10
Discussion and conclusion
The phantom and in-vivo experiments demonstrate the capability of MOLED to accurately quantify T2 and T2* parameters. Based on the fitting formula of the OEF model, the process of cerebral oxygen metabolism can be determined under both breathing and breath-holding conditions with high temporal resolution, revealing the potential of the MOLED sequence in quantitative measurement of the brain's oxygen metabolism.Acknowledgements
This work was supported by the National Natural Science Foundation of China under grant numbers 82071913, 12375291 and 22161142024.References
1. Luo Y, Gong Z, Zhou Y, et al. Increased susceptibility of asymmetrically prominent cortical veins correlates with misery perfusion in patients with occlusion of the middle cerebral artery. Eur Radiol. 2017;27:2381-2390.
2. Butterfield DA, Halliwell B. Oxidative stress, dysfunctional glucose metabolism and Alzheimer disease. Nat Rev Neurosci. 2019;20:148-160.
3. Cai CB, Wang C, Zeng YQ, et al. Single-shot T2 mapping using overlapping-echo detachment planar imaging and a deep convolutional neural network. Magn Reson Med. 2018;80:2202-2214.
4. Zhang J, Wu J, Chen SJ, et al. Robust single-shot T2 mapping via multiple overlapping-echo acquisition and deep neural network. IEEE Trans Med Imaging. 2019;38:1801-1811.
5. Yang QQ, Lin YH, Wang JC, et al. Model-based synthetic data-driven learning (MOST-DL): application in single-shot T2 mapping with severe head motion using overlapping-echo acquisition. IEEE Trans Med Imaging. 2022;41:3167-3181.
6. Ma LC, Wu J, Yang QQ, et al. Single-shot multi-parametric mapping based on multiple overlapping-echo detachment (MOLED) imaging. Neuroimage. 2022;263:119645.
7. Liu F, Velikina JV, Block WF, Kijowski R, Samsonov AA. Fast realistic MRI simulations based on generalized multi-pool exchange tissue model. IEEE Trans Med Imaging. 2017;36:527-537.
8. He X, Yablonskiy DA. Quantitative BOLD: mapping of human cerebral deoxygenated blood volume and oxygen extraction fraction: default state. Magn Reson Med. 2007;57:115-126.
9. Spees WM, Yablonskiy DA, Oswood MC, Ackerman JJH. Water proton MR properties of human blood at 1.5 tesla: magnetic susceptibility, T1, T2, T2* and non-Lorentzian signal behavior. Magn Reson Med. 2001;45:533-542.
10. Küppers F, Yun SD, Shah, NJ. Development of a novel 10-echo multi-contrast sequence based on EPIK to deliver simultaneous quantification of T2 and T2* with application to oxygen extraction fraction. Magn Reson Med. 2022;88:1608-1623.
Figures