4329
Model selection criteria for data-driven determination of 1H-MRS basis-set composition.1The Russell H. Morgan Department of Radiology and Radiological Science, Johns Hopkins Medicine, Baltimore, MD, United States, 2F.M. Kirby Research Center for Functional Brain Imaging, Kennedy Krieger Institute, Baltimore, MD, United States
Synopsis
Keywords: Signal Modeling, Spectroscopy
Motivation: The composition of metabolite basis sets impacts their estimates, but no consensus or objective methods exist to decide which compounds should be included or excluded for a particular dataset.
Goal(s): To develop an objective, data-driven procedure for determining basis-set composition.
Approach: An iterated fitting algorithm uses information criteria scores to select the most appropriate metabolite basis functions directly from the data. We tested two “stopping conditions” using in-vivo-like simulated spectra.
Results: The algorithm correctly, consistently identified large parts of the ground-truth set. Stopping conditions set reliable bounds on the basis-set composition. Refinement for low-concentration compounds is expected to further improve accuracy.
Impact: Model selection for data-driven assessment of basis set composition has the potential to provide objective criteria and remove operator bias of linear-combination modeling. This may reduce analytic variability and help establish practices for low-concentration and pathology-specific metabolites.
Introduction
Expert consensus1,2 recommends linear-combination modeling (LCM) to analyze in-vivo proton magnetic resonance spectroscopy (1H-MRS) data. However, at clinical field strengths, metabolite signals overlap, leading to spurious correlations between their estimated contributions3,4. Omission or inclusion of (particularly low-concentration) compounds from the basis set can lead to biases and interactions of metabolite estimates5–8.Several challenges arise: (1) If the basis-set composition requires a-priori knowledge (e.g., external diagnosis), clinical utility of MRS is limited. (2) Current methods cannot determine whether a specific candidate set will overfit, underfit, or appropriately fit the data. (3) No consensus or objective criteria exist to determine ideal basis-set composition, causing substantial analytic variability.
We propose formulating basis set selection as a model selection problem, i.e., using information criteria (IC) to find the best from a set of candidate models. IC scores reflect parsimony by balancing goodness-of-fit and model complexity. In this study, we investigated the feasibility of selecting a suitable basis set using a data-driven procedure informed by IC scores.
Methods
For a given LCM fit, we defined three IC scores—Akaike (AIC), corrected (AICc), and Bayesian (BIC):$$BIC=-2\bullet n\bullet ln\left(\sigma\right)-ln\left(n\right)\bullet p$$
$$AIC=-2\bullet n\bullet ln\left(\sigma\right)-2\bullet p$$
$$AIC_c=-2\bullet n\bullet ln\left(\sigma\right)-\frac{2n\left(p+1\right)}{n-p-2}$$
with $$$n$$$ the number of spectral points, $$$p$$$ the number of model parameters, and $$$\sigma\ =\ \sqrt[2]{\sum{{((\mathrm{data}-\mathrm{fit})}^2)}}$$$.
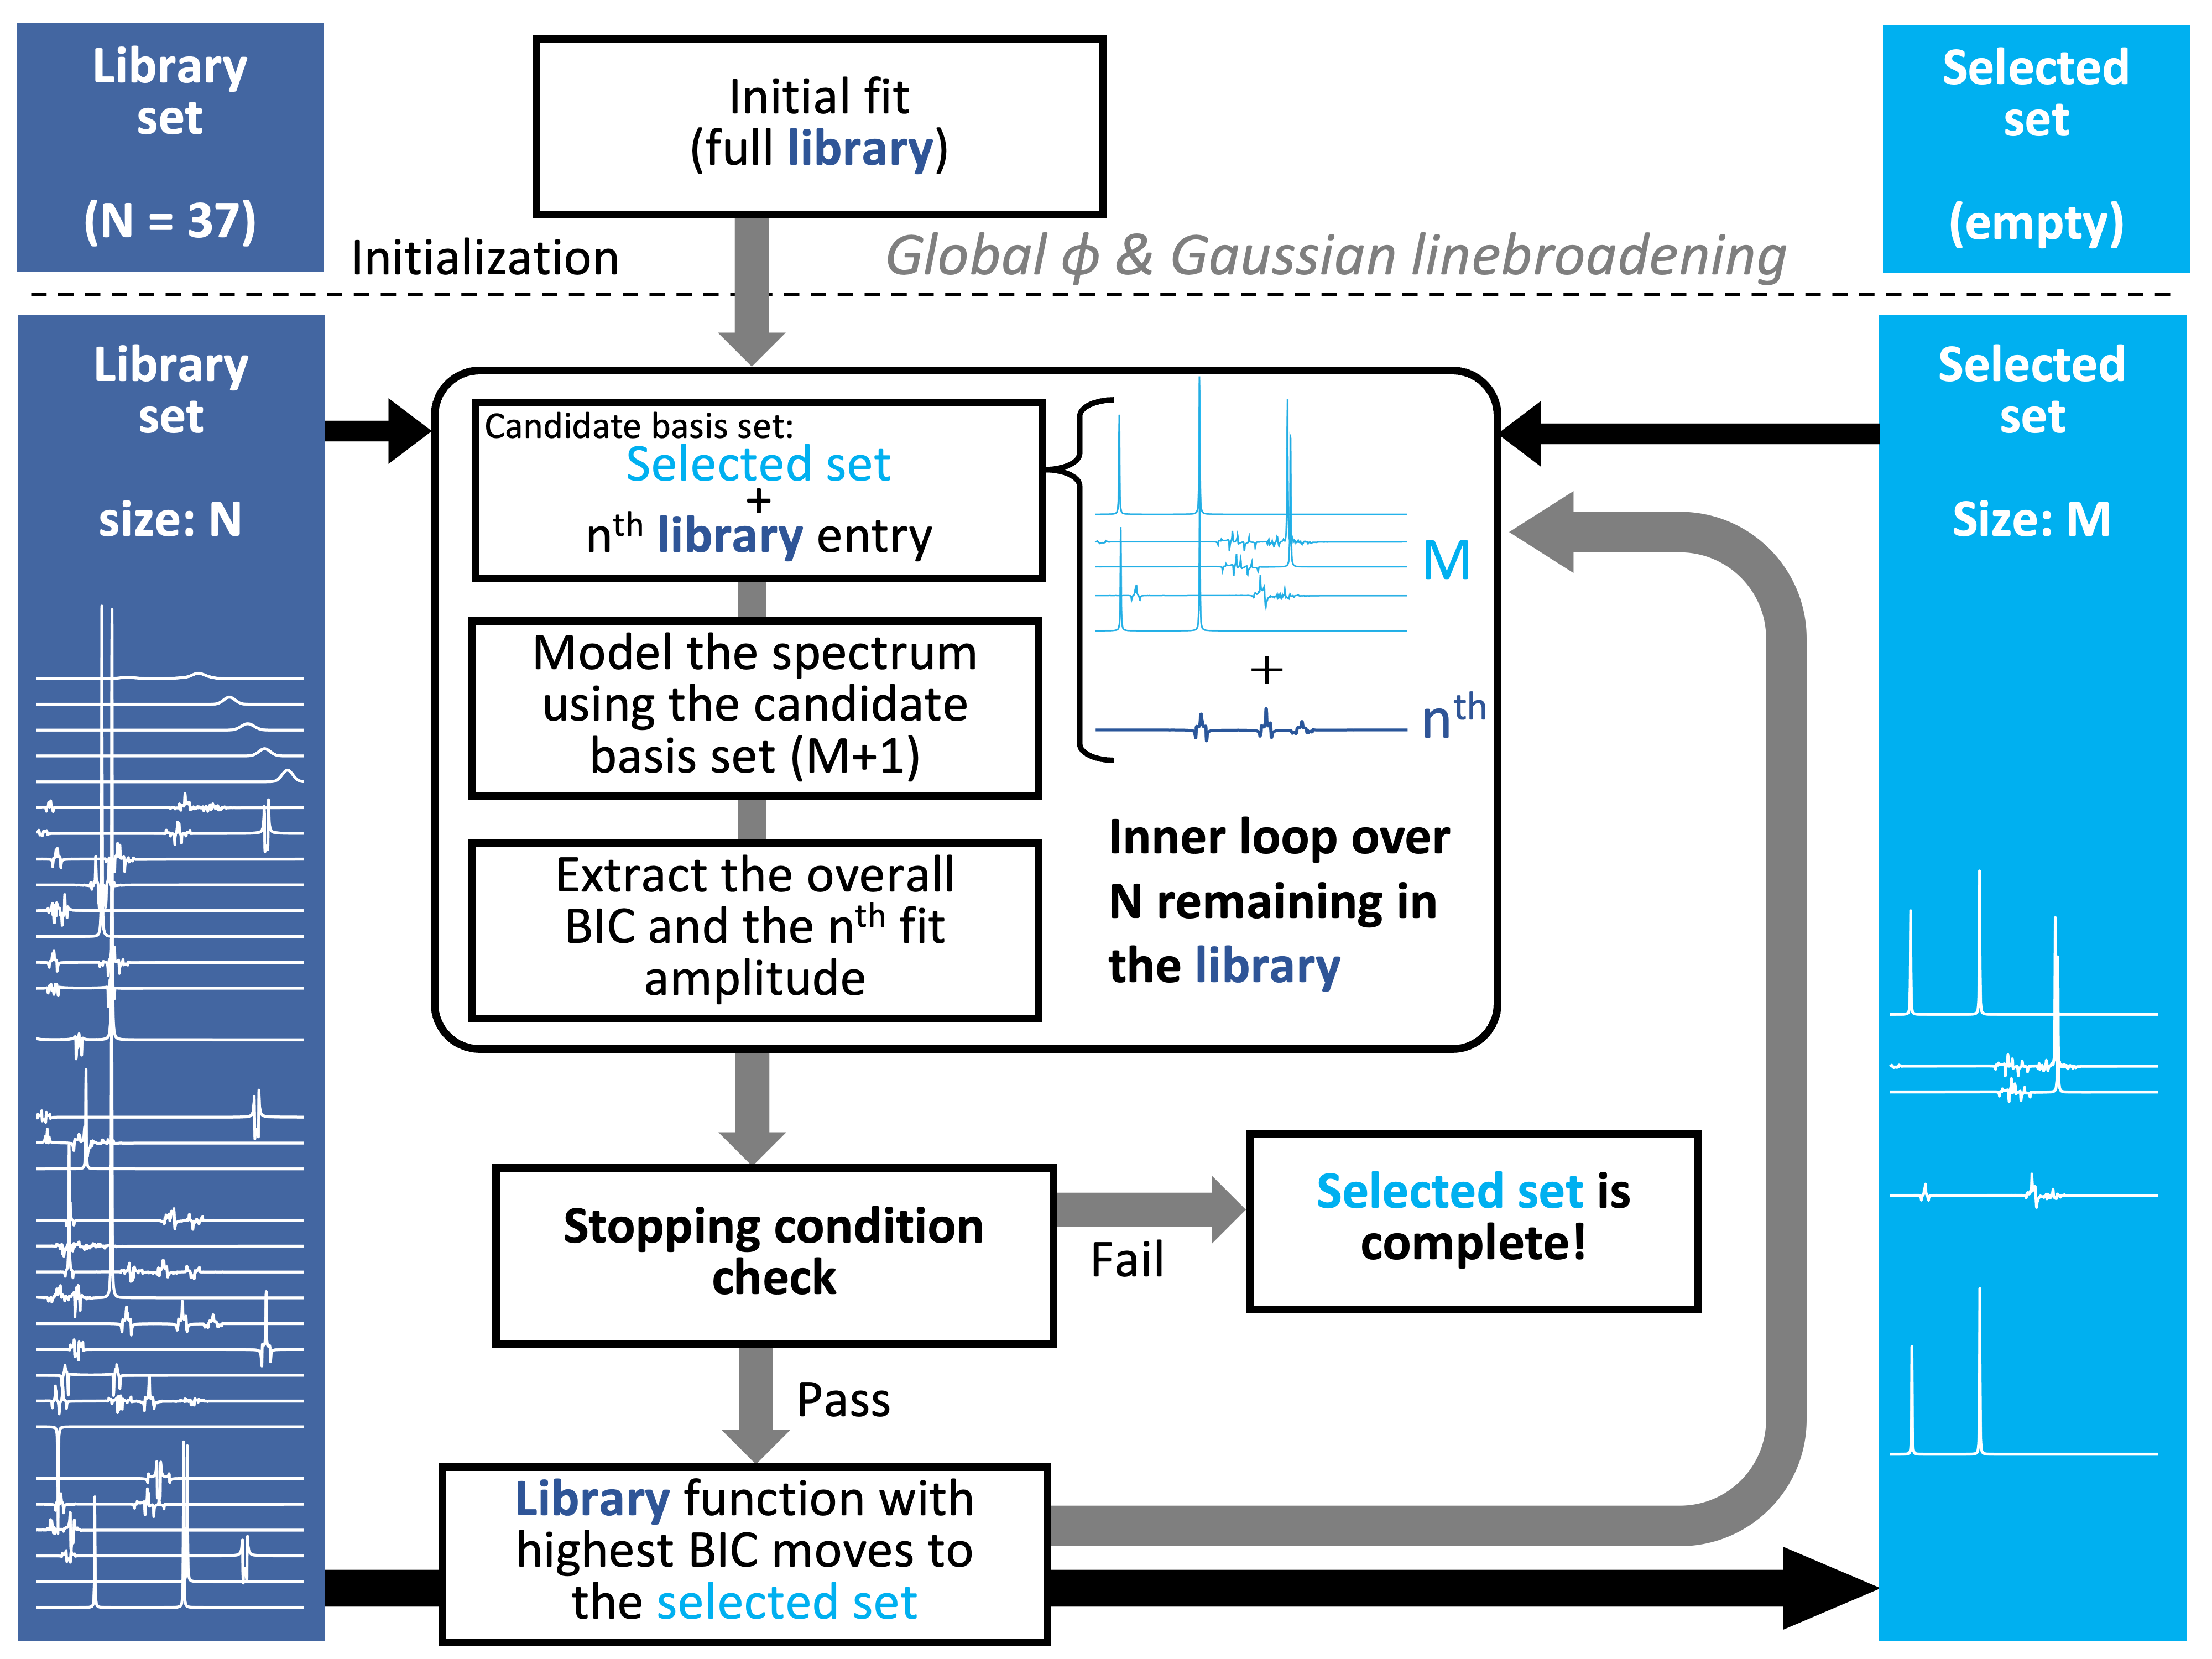
Figure 1 illustrates our basis-set-selection algorithm to iteratively move metabolites from a “library set” (containing all compounds) to a “selected set”. After an initial fit with all metabolites to estimate lineshape/phase parameters, the algorithm performs a series of fits with different candidate basis sets, starting with single-metabolite sets. At the end of each series, it iteratively adds the basis function that has achieved the greatest IC until a stopping condition is met. We compared two stopping conditions:
“Maximum BIC”: Stop adding metabolites once IC decreases.
“Zero-amplitude”: Keep adding metabolites beyond maximum IC until all remaining candidate metabolites are estimated with zero amplitude.
For testing, we generated 100 synthetic in-vivo-like spectra (PRESS, TE = 97 ms) from 23 (ground truth set) out of 37 simulated metabolites/macromolecules in the library set9,10.
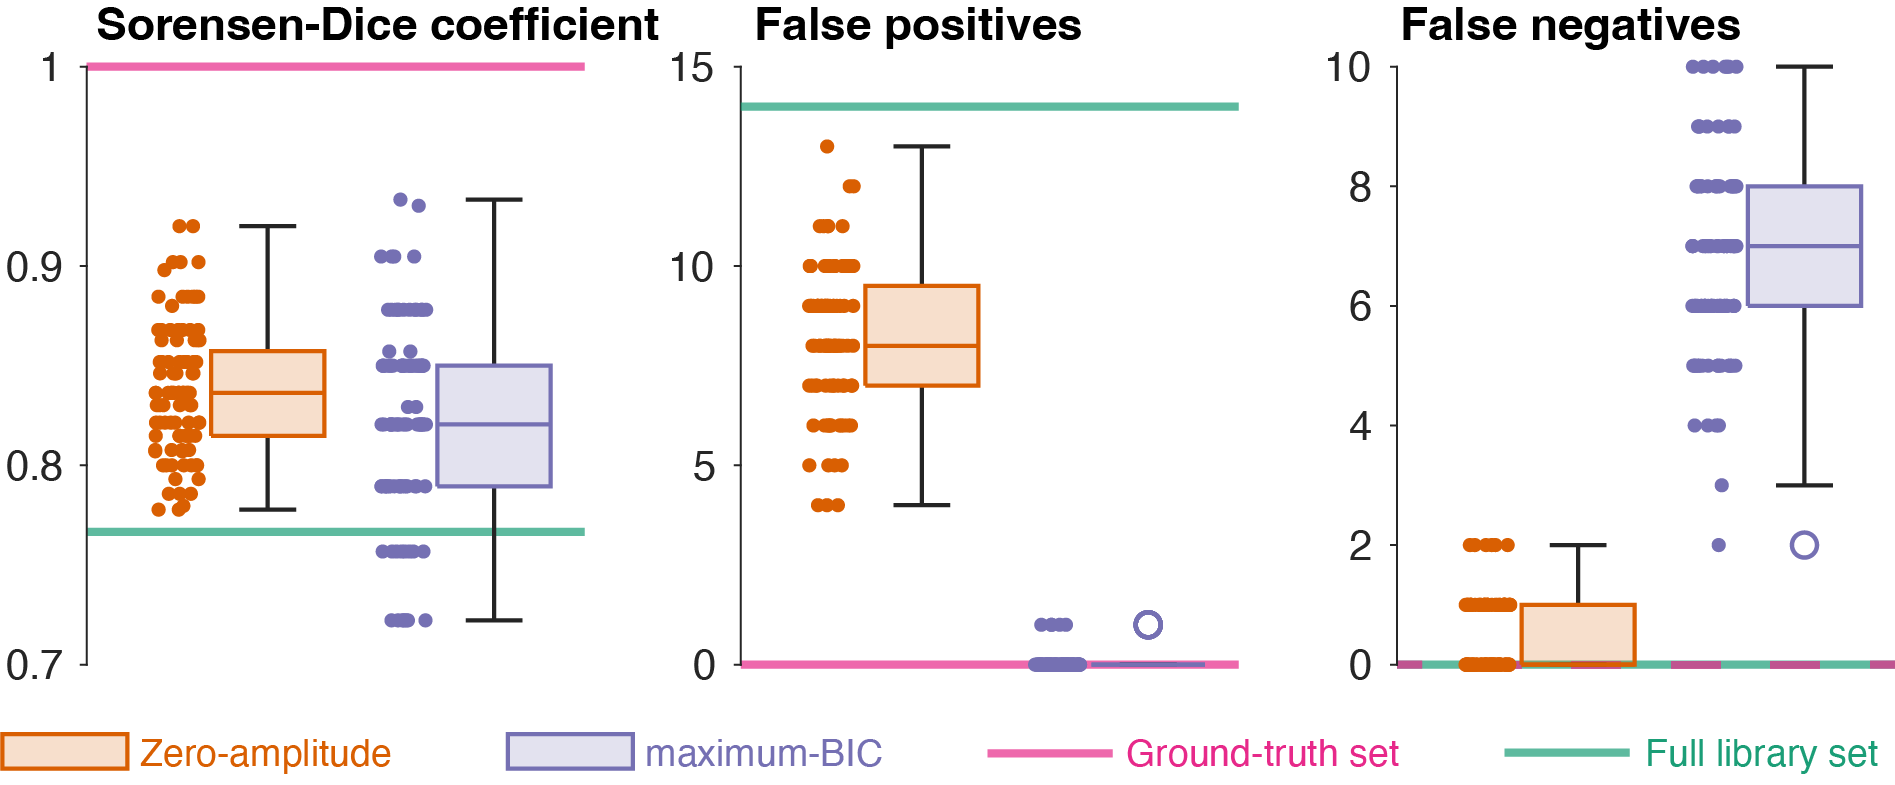
To compare the ability of the two stopping conditions to select the ground truth set from the library set, we ran t-tests on the following outcome measures for the final selected sets: the number of false positives/negatives (metabolites erroneously included/excluded), the Sorensen-Dice coefficient:
$$\mathrm{SDC}\ =\ \frac{2\bullet\mathrm{TruePositive}}{2\bullet\mathrm{TruePositive}\ +\ \mathrm{FalsePositive}\ +\ \mathrm{FalseNegative}}$$
and metabolite amplitude bias (estimate minus ground truth).
Results
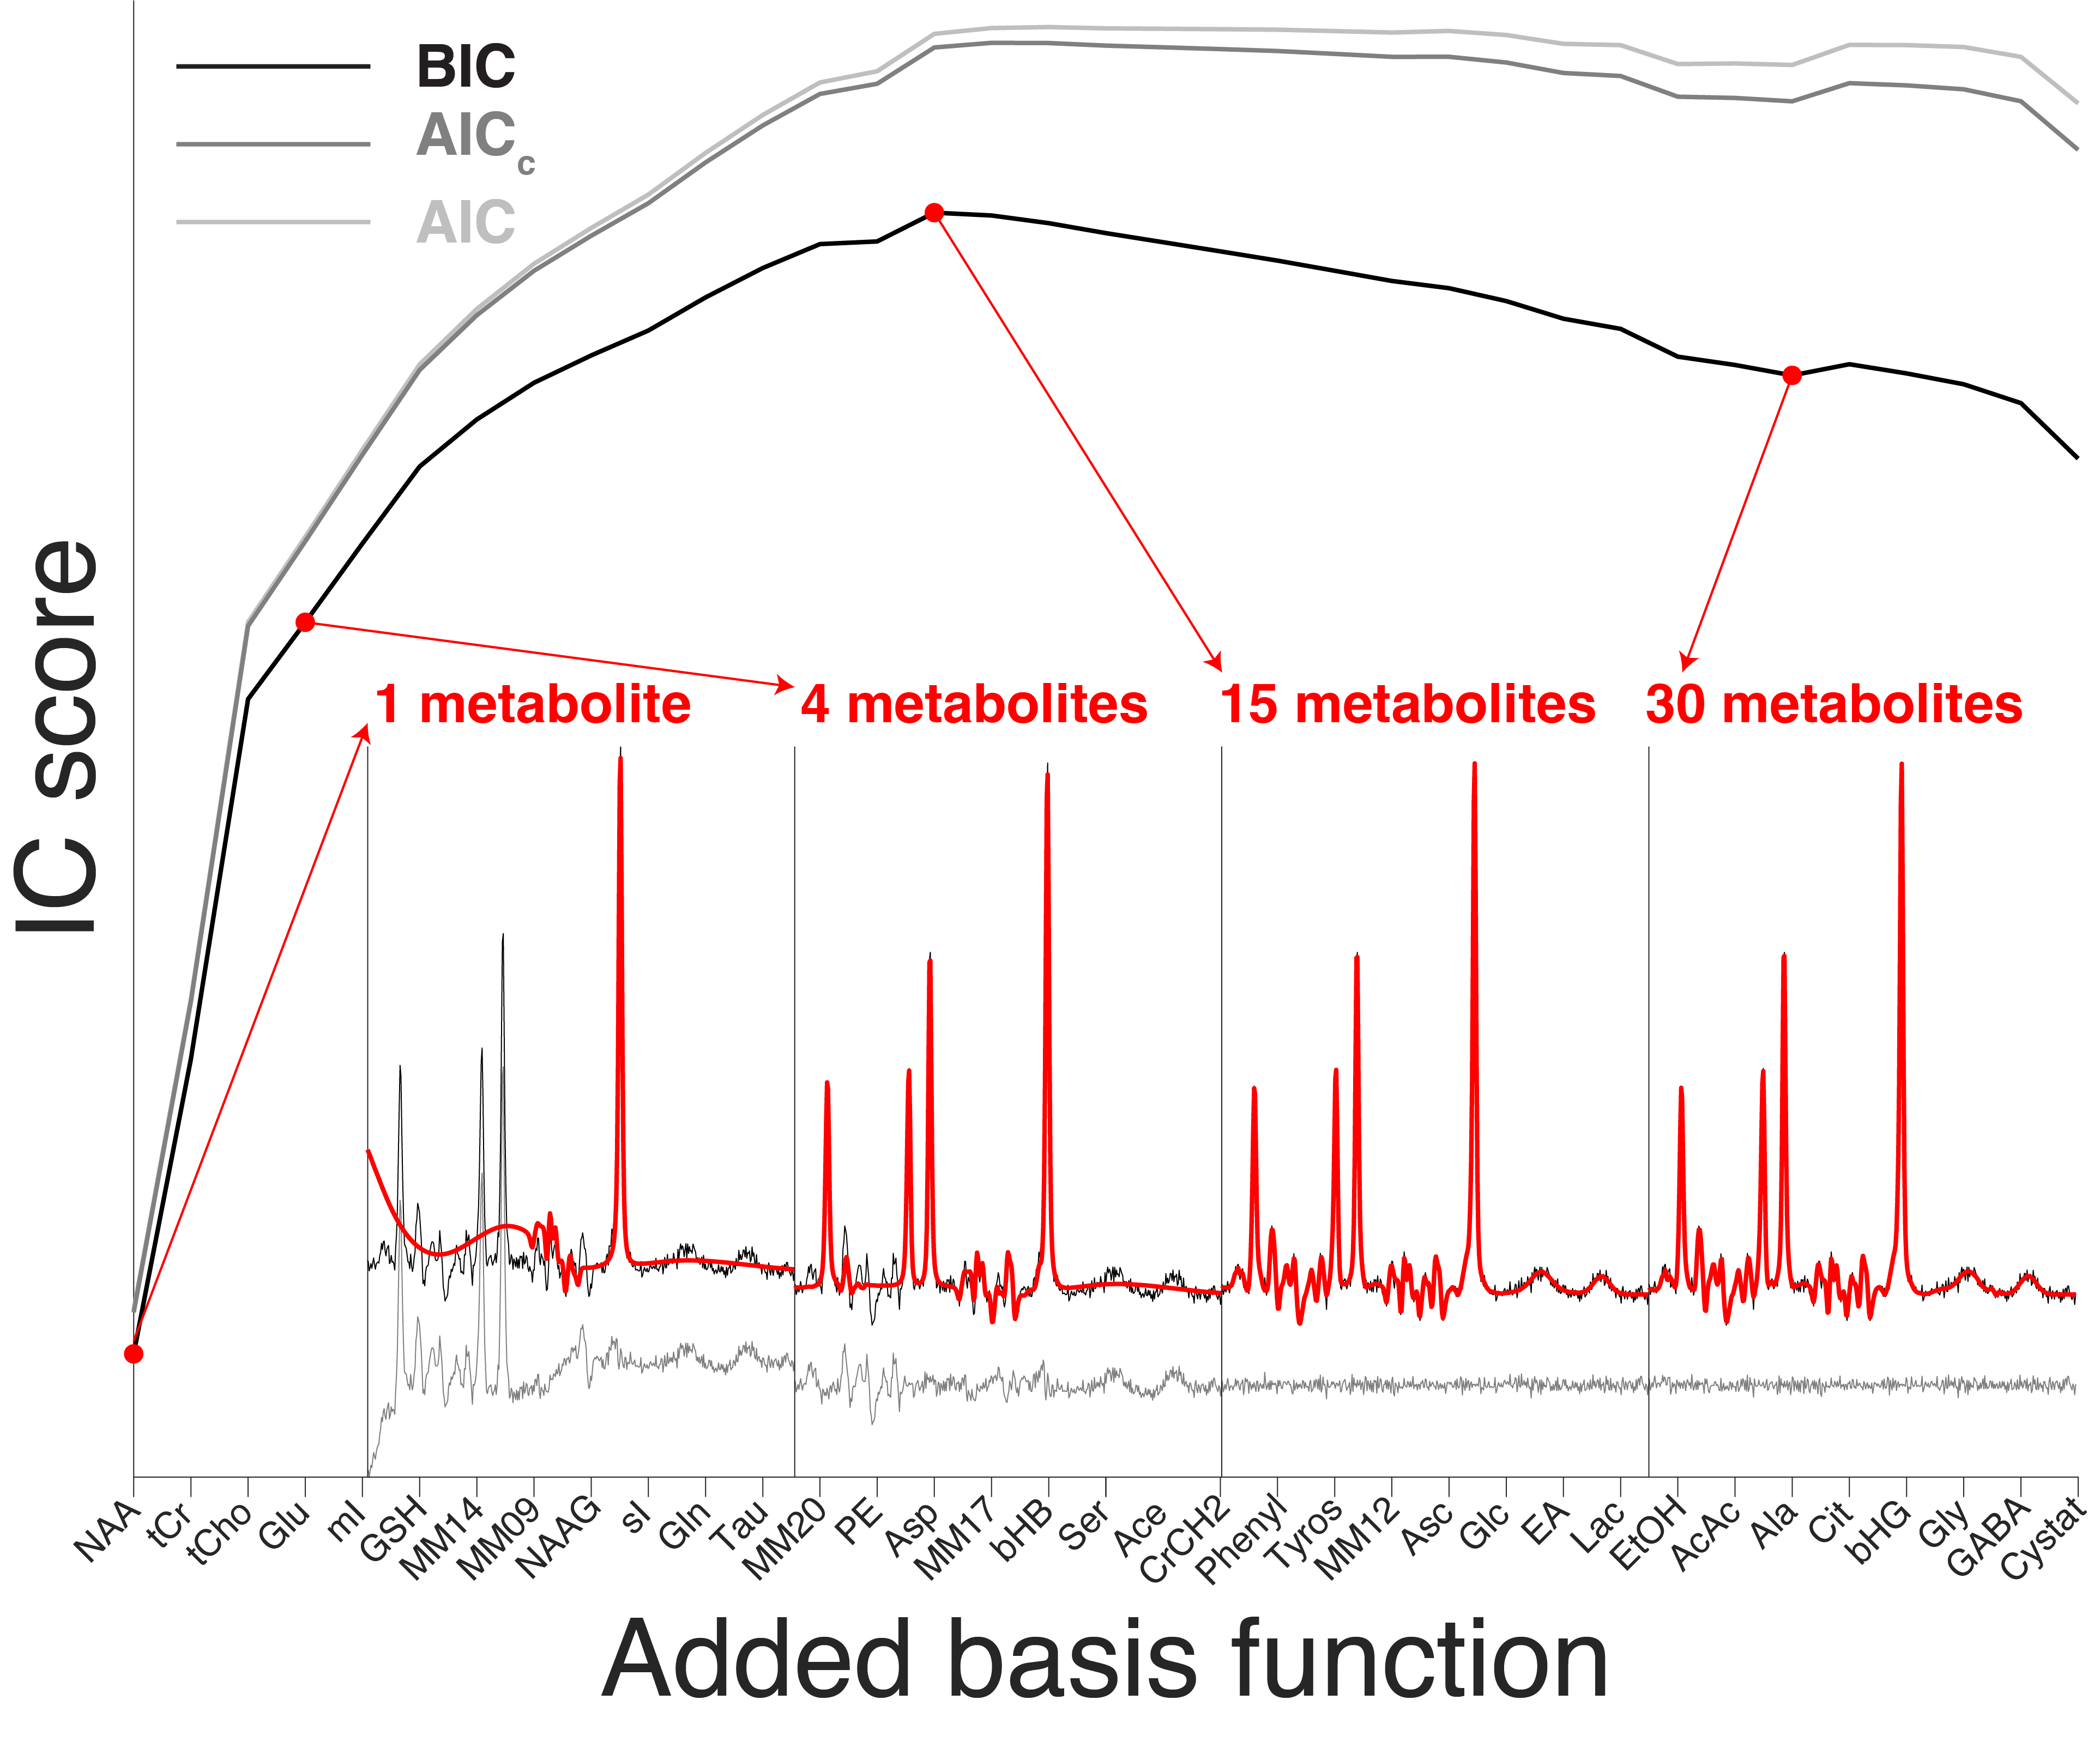
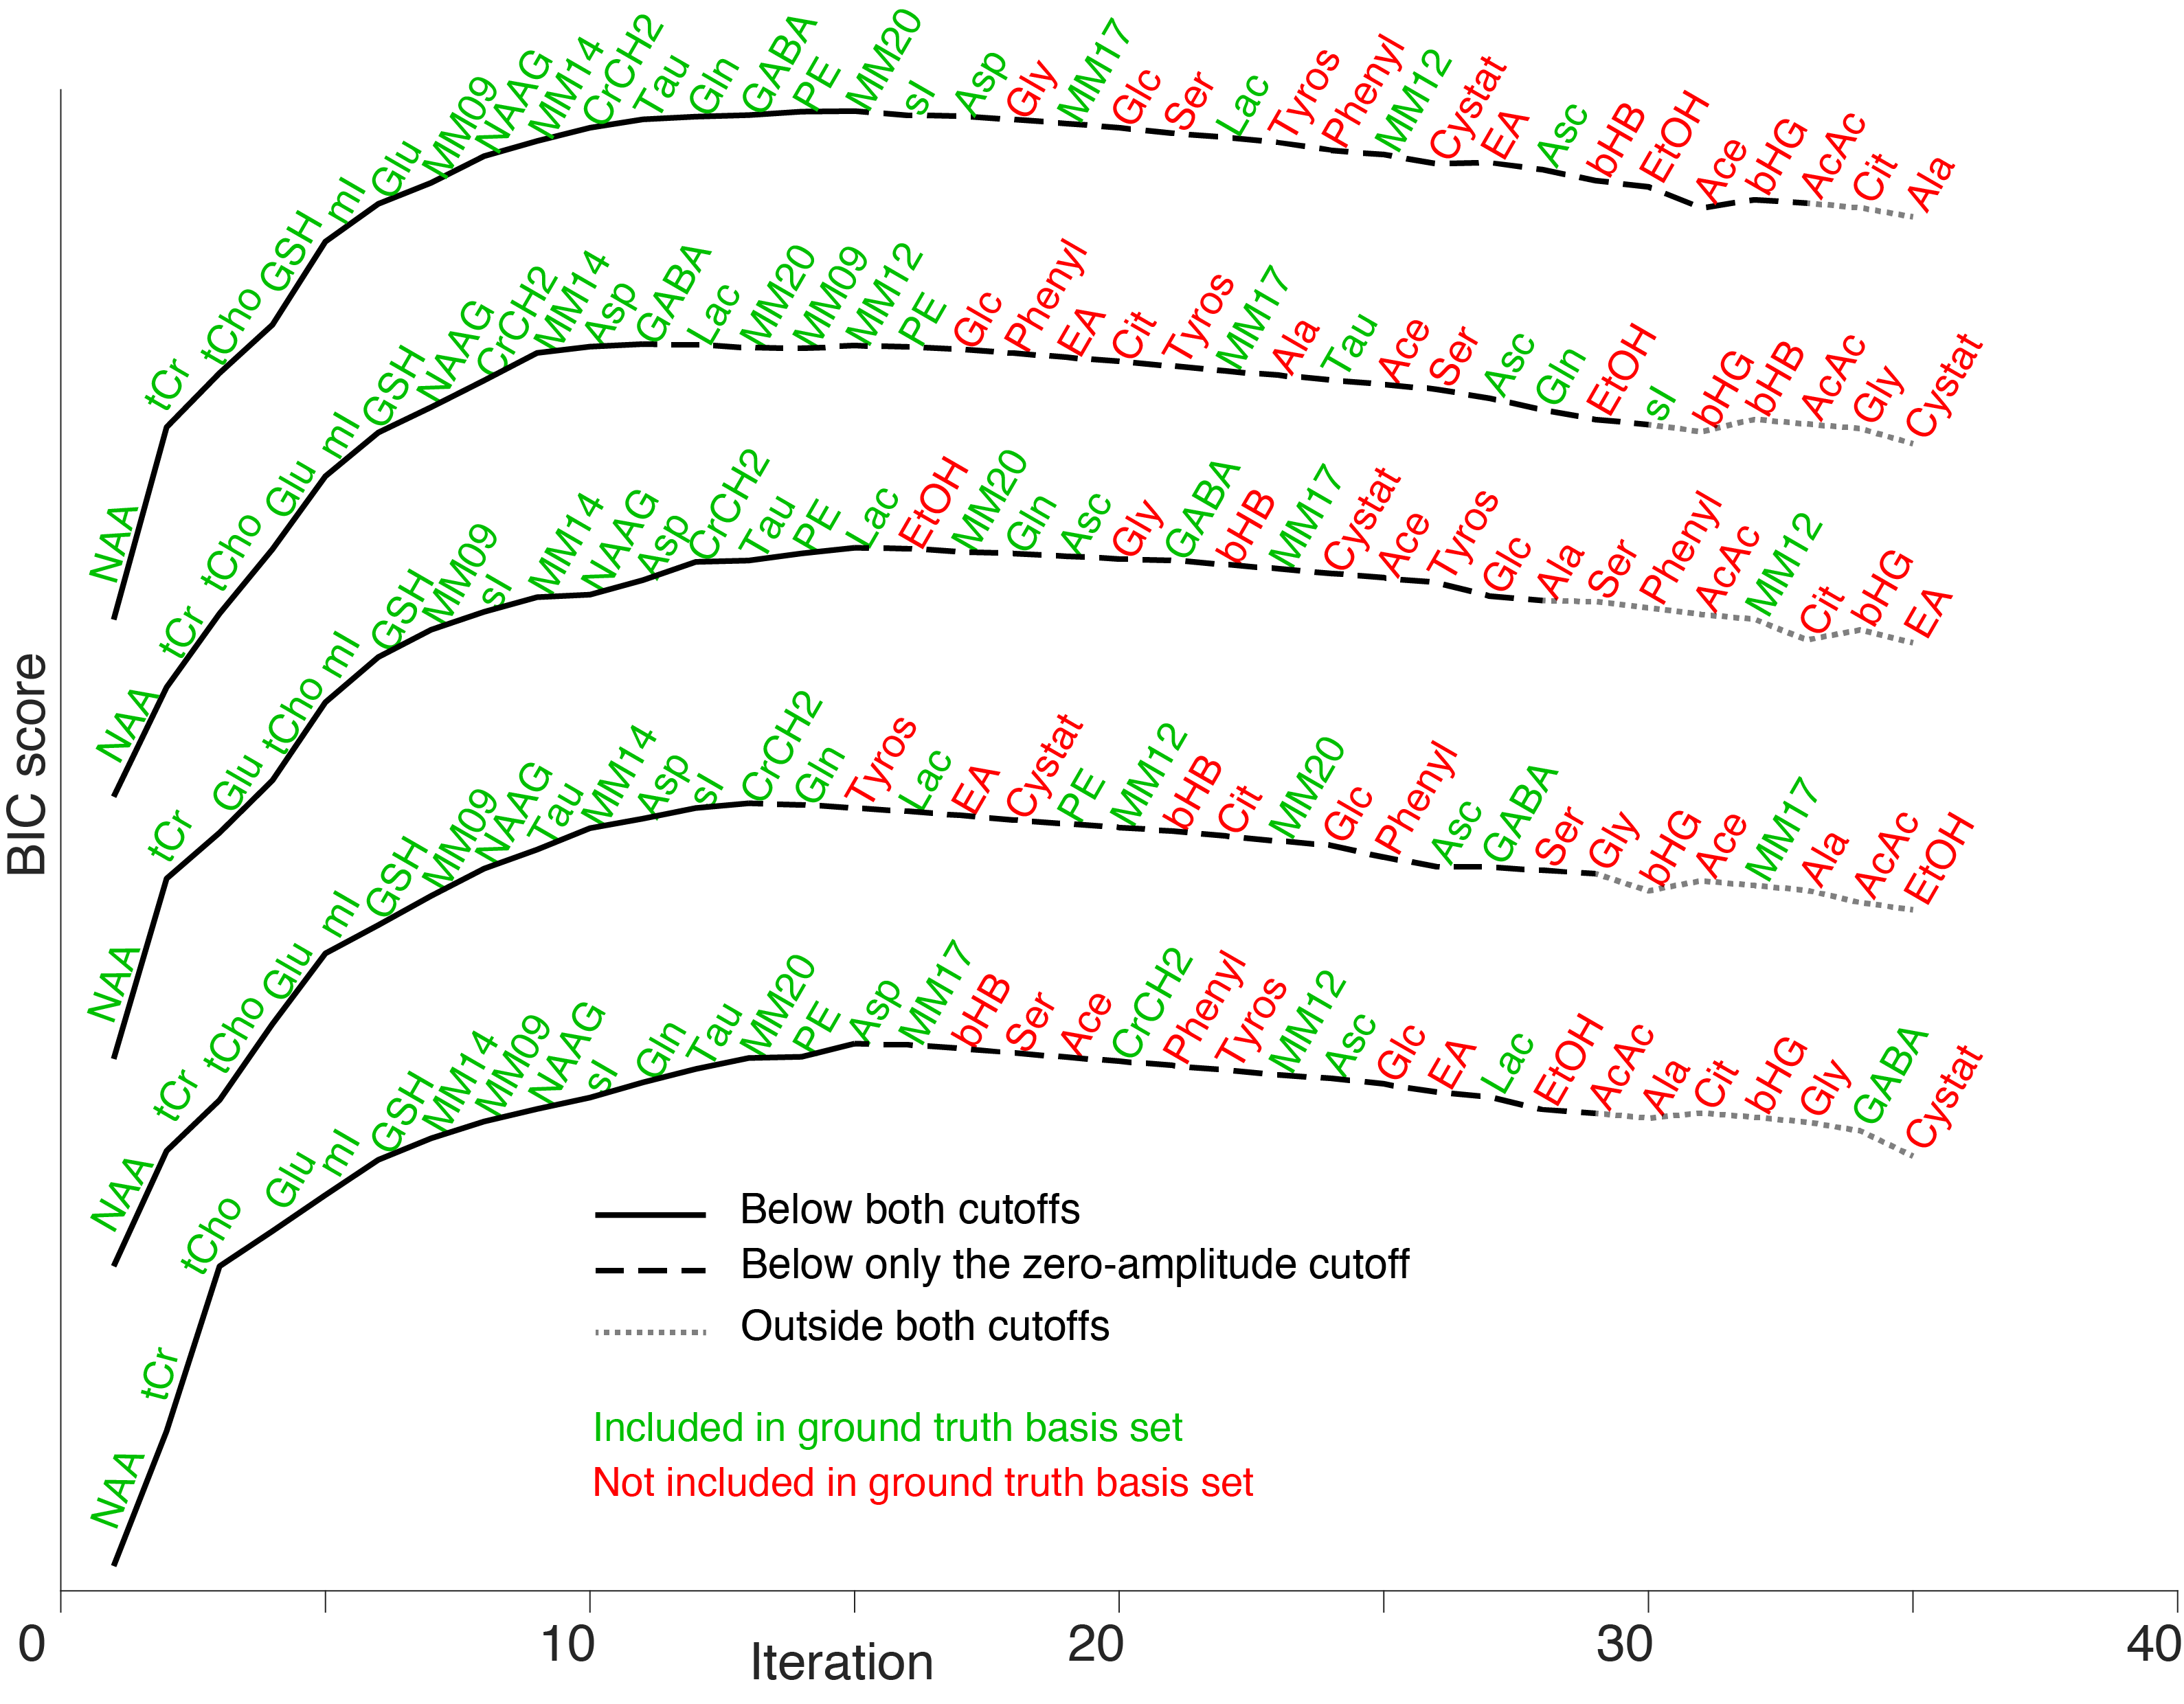
Figure 2 illustrates a typical IC trajectory as the basis set grows. Initially, ICs rapidly increase as large-singlet metabolites reduce fit residuals before tapering off as lower-amplitude signals are included. IC scores unanimously agreed on the order of addition. Since the BIC had the largest post-maximum slope, we selected it for subsequent analysis.Figure 3 depicts exemplary BIC trajectories for five datasets. The “Maximum BIC” stopping condition was more conservative (selecting 14 metabolites on average) than the “zero amplitude” one (29 metabolites). Figure 4 demonstrates that, consequently, the “zero-amplitude” mode identified more false positives (8.3 ± 1.8 vs 0.1 ± 0.2, p < 0.005), but fewer false negatives (0.5 ± 0.6 vs 6.8 ± 1.6, p < 0.005), achieving a higher SDC (0.84 ± 0.03 vs 0.82 ± 0.05, p = 0.015).
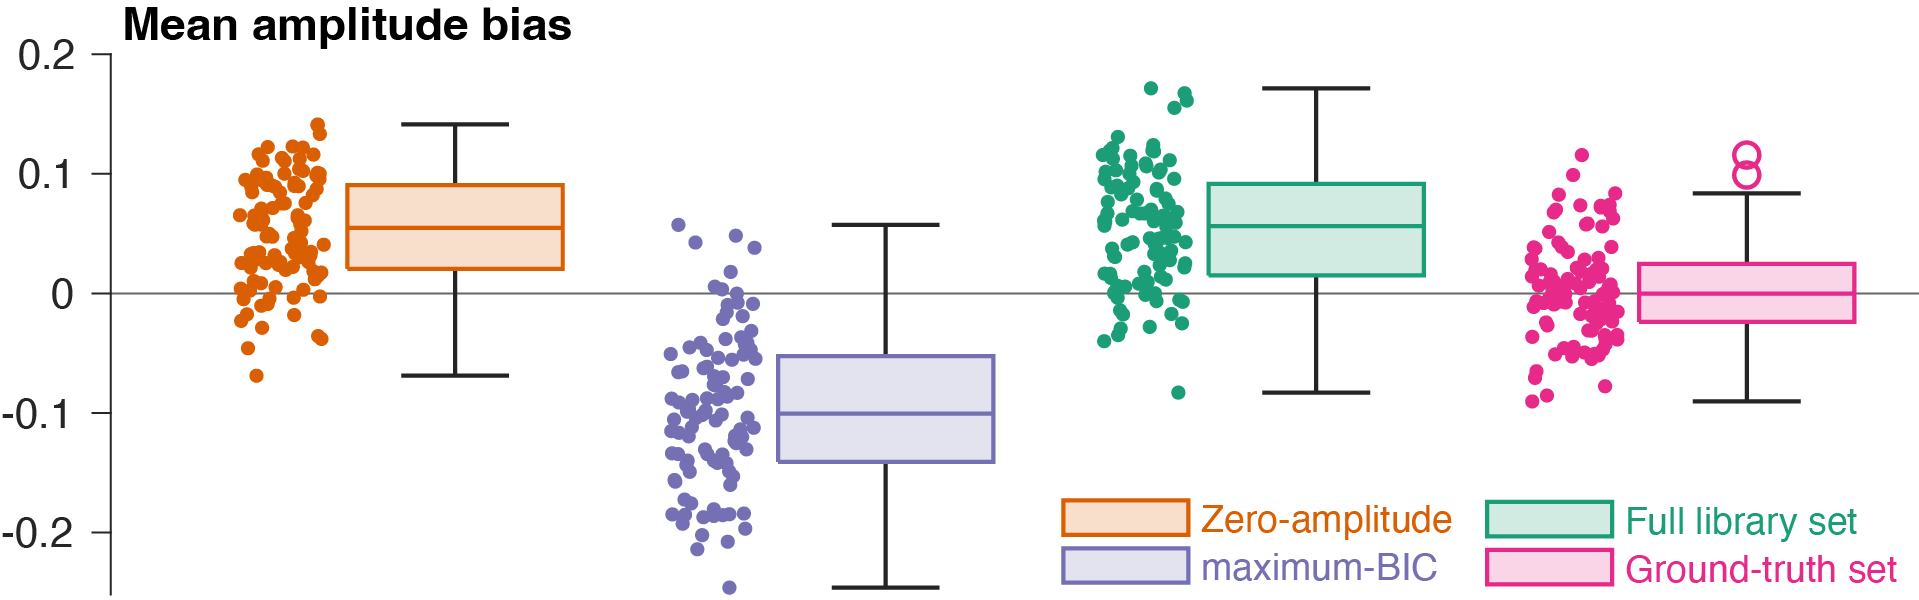
Figure 5 illustrates that the basis set selected by “maximum-BIC” led to a negative mean amplitude bias, while the basis set selected by “zero-amplitude” led to a positive one. This suggests that the IC-selected sets still exhibit underfitting (inappropriately modeled signal) and overfitting (attributing baseline/noise to basis functions). A model with the full library set also overfits, but with a substantially larger bias distribution than “zero-amplitude”.
Discussion
Basis-set composition has been at user discretion since the inception of LCM. A lack of consensus or objective criteria has led to divergent practices contributing to the poor reproducibility of in-vivo MRS.We demonstrate model selection as a promising novel approach for determining basis-set composition without external prior knowledge. The BIC-based stopping conditions correctly included all major metabolite signals, returning reasonable lower bounds on the ground-truth set. Low-concentration metabolites were less reliably identified, and further refinement should incorporate metrics like CRLBs, correlation matrices, and baseline stability to inform inclusion.
Alternatively, model selection may be performed at the cohort level by averaging IC scores across datasets. If two cohorts exhibit markedly different spectral characteristics—e.g., IDH-mutated tumors containing 2-hydroxyglutarate—each cohort may be best fit with its own basis set, affording the best bias-variance trade-off, i.e., the necessary degrees of freedom, but not more.
Conclusion
Data-driven determination of basis-set composition is feasible, and with refinement, may reduce estimation bias and analytic variability.Acknowledgements
This work was supported by National Institutes of Health grants R00 AG062230, R21 EB033516, K99 AG080084, R01 EB016089, R01 EB023963, and P41 EB031771.References
- Near J, Harris AD, Juchem C, et al. Preprocessing, analysis and quantification in single-voxel magnetic resonance spectroscopy: experts’ consensus recommendations. NMR Biomed. 2021;34(5):e4257. doi:10.1002/nbm.42572.
- Wilson M, Andronesi O, Barker PB, et al. Methodological consensus on clinical proton MRS of the brain: Review and recommendations. Magn Reson Med. 2019;82(2):527-550. doi:10.1002/mrm.277423.
- Hong S, Shen J. Neurochemical correlations in short echo time proton magnetic resonance spectroscopy. NMR Biomed. 2023;36(7):e4910. doi:10.1002/nbm.49104.
- Hong S, An L, Shen J. Monte Carlo study of metabolite correlations originating from spectral overlap. J Magn Reson. 2022;341:107257. doi:10.1016/j.jmr.2022.1072575.
- Demler V, Sterner EF, Wilson M, Zimmer C, Knolle F. The impact of spectral basis set composition on estimated levels of cingulate glutamate and its associations with different personality traits. July 2023:2023.07.12.23292540. doi:10.1101/2023.07.12.232925406.
- Branzoli F, Deelchand DK, Liserre R, et al. The influence of cystathionine on neurochemical quantification in brain tumor in vivo MR spectroscopy. Magn Reson Med. 2022;88(2):537-545. doi:10.1002/mrm.292527.
- Horská A, Barker PB. Imaging of Brain Tumors: MR Spectroscopy and Metabolic Imaging. Neuroimaging Clin. 2010;20(3):293-310. doi:10.1016/j.nic.2010.04.0038.
- Považan M, Mikkelsen M, Berrington A, et al. Comparison of Multivendor Single-Voxel MR Spectroscopy Data Acquired in Healthy Brain at 26 Sites. Radiology. 2020;295(1):171-180. doi:10.1148/radiol.20201910379.
- Považan M, Hangel G, Strasser B, et al. Mapping of brain macromolecules and their use for spectral processing of 1H-MRSI data with an ultra-short acquisition delay at 7T. NeuroImage. 2015;121:126-135. doi:10.1016/j.neuroimage.2015.07.04210.
- Oeltzschner G, Zöllner HJ, Hui SCN, et al. Osprey: Open-source processing, reconstruction & estimation of magnetic resonance spectroscopy data. J Neurosci Methods. 2020;343:108827. doi:10.1016/j.jneumeth.2020.108827
Figures