4322
MR Fingerprinting and Apparent Diffusion Coefficient Mapping for quantitative characterization of clinically significant Prostate Cancer1Department of Diagnostic and Interventional Radiology, University Hospital Bonn, Bonn, Germany, 2High Performance Computing & Analytics Lab, University Bonn, Bonn, Germany, 3Philips GmbH Market DACH, Hamburg, Germany
Synopsis
Keywords: Prostate, Cancer
Motivation: Diagnosing clinically significant prostate cancer(PCa) while avoiding overdiagnosis is crucial. Quantitative imaging techniques allow for more objective assessment of prostate lesions. Magnetic resonance fingerprinting(MRF) combined with apparent diffusion coefficient(ADC) might allow quantitative characterization of prostate lesions. Further validation studies with histopathological correlation are required.
Goal(s): To evaluate the utility of MRF and ADC for quantitative characterization of prostate lesions and correlate our results with pathology.
Approach: This study included 106 biopsy-naive patients with elevated PSA levels that underwent an mpMRI exam with additional acquisition of MRF.
Results: ADC and MRF based relaxometry allow quantitative characterization of prostate lesions that correlate with histopathology.
Impact: There is growing interest in the clinical application of quantitative imaging techniques for more objective assessment of prostate lesions. MRF is a fast and efficient method that promises to quantitatively characterize PCa in the future.
Introduction
Diagnosing clinically significant prostate cancer (PCa) while avoiding overdiagnosis of low-malignant tumors is of key importance in routine clinical practice1. To increase interreader repeatability a semiquantitative scoring system for the diagnosis of clinically significant PCa, the Prostate Imaging Reporting & Data System (PI-RADS) 2.1, has been developed2, 3. However, non-negligible variation between the semiquantitative readouts remain4. Therefore, more quantitative metrics, including the apparent diffusion coefficient (ADC), have been studied to objectively measure and characterize PCa lesions4. Magnetic resonance fingerprinting (MRF) enables simultaneous measurement of T1 and T2 relaxation times in a time-efficient manner5. Initial studies have shown that MRF based relaxometry combined with ADC mapping might aid in the differentiation of normal peripheral zone (PZ) and transitional zone (TZ) from PCa and prostatitis6, 7. Prior to clinical application, further validation studies with larger patient collectives and histopathological correlation are required. In this study, we evaluate the utility of MRF and ADC mapping for characterizing prostate lesions in the PZ and TZ and correlate our results with pathology.Methods and Materials
Patients: This institutional review board-approved retrospective study included prospectively collected data of 106 biopsy-naive patients with elevated prostate specific antigen (PSA) levels suspected of having PCa (66.2 +/- 7.8 years).Data acquisition: All patients underwent a multiparametric magnetic resonance imaging (mpMRI) exam at a 3T Philips Ingenia scanner (Philips Healthcare, Best, the Netherlands) and were classified by trained radiologists following the PI-RADS 2.1 scoring system. T1 and T2 mapping was performed using 2D fast imaging with steady-state precession-based MRF with spiral readout. ADC maps were calculated based on b-values = 100, 400, 800 s/mm2 (Figure 1).
Histopathology: Histopathological ISUP (International Society of Urological Pathology) grading was performed after biopsy/prostatectomy. In total, 78 patients underwent biopsy, 19 surgery.
Analysis: Zonal segmentation of the prostate was performed using a convolutional neural network with subsequent revision by a trained radiologist8. Lesions were manually segmented on the high-resolution T2-weighted images. After image registration, ADC values, T1-/T2-relaxation times of each lesion were correlated with histopathology. Systematic differences of T1-/T2-relaxation times and ADC values between different ISUP scores were assessed using one-way analysis of variance with Tukey type post hoc comparisons to adjust for multiple testing.
Results
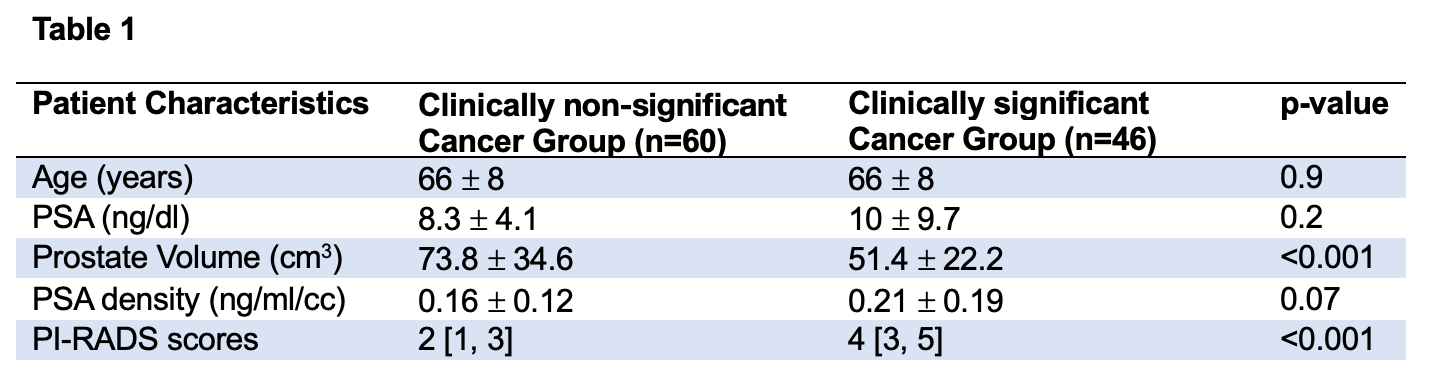
37 patients were classified as PI-RADS 2, 24 as PI-RADS 3, 25 as PI-RADS 4 and 20 as P|-RADS 5. In total 91 lesions were segmented, considering cross-zone growth 69 were located in the PZ, 23 in the TZ. 1 clinically significant, i.e., ISUP 2 PCa was missed on mpMRI. For patients characteristics see Table 1.For the PZ, mean ADC values and MRF T1-/T2-relaxation times significantly decreased in clinically significant PCa compared to normal PZ tissue (Figure 2).
For the TZ, ADC values significantly decreased from normal TZ to non-significant PCa to clinically significant PCa. MRF T1-relaxation times decreased significantly in clinically significant PCa compared to normal TZ. MRF T2-relaxation times decreased significantly in clinically significant compared to non-significant PCa (Figure 3).
Discussion
ADC and MRF based relaxometry allow quantitative characterization of prostate lesions in the PZ and TZ that correlate with histopathology. Particularly in the TZ, varying signal intensities on T2-weighted imaging can make it difficult to differentiate malignancy from stromal hyperplastic nodules and prostatitis7. ADC and MRF based relaxometry might improve TZ lesion characterization. Further validation studies are needed.Conclusion
MRF-based relaxation times combined with ADC could help in the diagnosis of clinically significant PCa. Especially with regard to the application of artificial intelligence and deep learning, such quantitative methods could be an interesting approach in addition to conventional ADC assessment.Acknowledgements
This research project is part of the Research Campus M2OLIE and funded by the German Federal Ministry of Education and Research (BMBF) within the Framework “Forschungscampus: public-private partnership for Innovations” under the funding code 13GW0388A.References
1. Wichtmann BD, Zollner FG, Attenberger UI, Schonberg SO. Multiparametric MRI in the Diagnosis of Prostate Cancer: Physical Foundations, Limitations, and Prospective Advances of Diffusion-Weighted MRI. Rofo. 2021;193(4):399-409.
2. American College of Radiology. Prostate Imaging - Reporting and Data System, PI-RADS v2.1. American College of Radiology wwwacrorg/Quality-Safety/Resources/PIRADS [Accessed: 6th of January 2020]. 2019.
3. Turkbey B, Rosenkrantz AB, Haider MA, Padhani AR, Villeirs G, Macura KJ, et al. Prostate Imaging Reporting and Data System Version 2.1: 2019 Update of Prostate Imaging Reporting and Data System Version 2. Eur Urol. 2019;76(3):340-51.
4. Gupta RT, Mehta KA, Turkbey B, Verma S. PI-RADS: Past, present, and future. J Magn Reson Imaging. 2020;52(1):33-53.
5. Ma D, Gulani V, Seiberlich N, Liu K, Sunshine JL, Duerk JL, et al. Magnetic resonance fingerprinting. Nature. 2013;495(7440):187-92.
6. Yu AC, Badve C, Ponsky LE, Pahwa S, Dastmalchian S, Rogers M, et al. Development of a Combined MR Fingerprinting and Diffusion Examination for Prostate Cancer. Radiology. 2017;283(3):729-38.
7. Panda A, Obmann VC, Lo WC, Margevicius S, Jiang Y, Schluchter M, et al. MR Fingerprinting and ADC Mapping for Characterization of Lesions in the Transition Zone of the Prostate Gland. Radiology. 2019;292(3):685-94.
8. Meyer A, Rakr M, Schindele D, Blaschke S, Schostak M, Fedorov A, et al., editors. Towards Patient-Individual PI-Rads v2 Sector Map: Cnn for Automatic Segmentation of Prostatic Zones From T2-Weighted MRI. 2019 IEEE 16th International Symposium on Biomedical Imaging (ISBI 2019); 2019 8-11 April 2019.
Figures
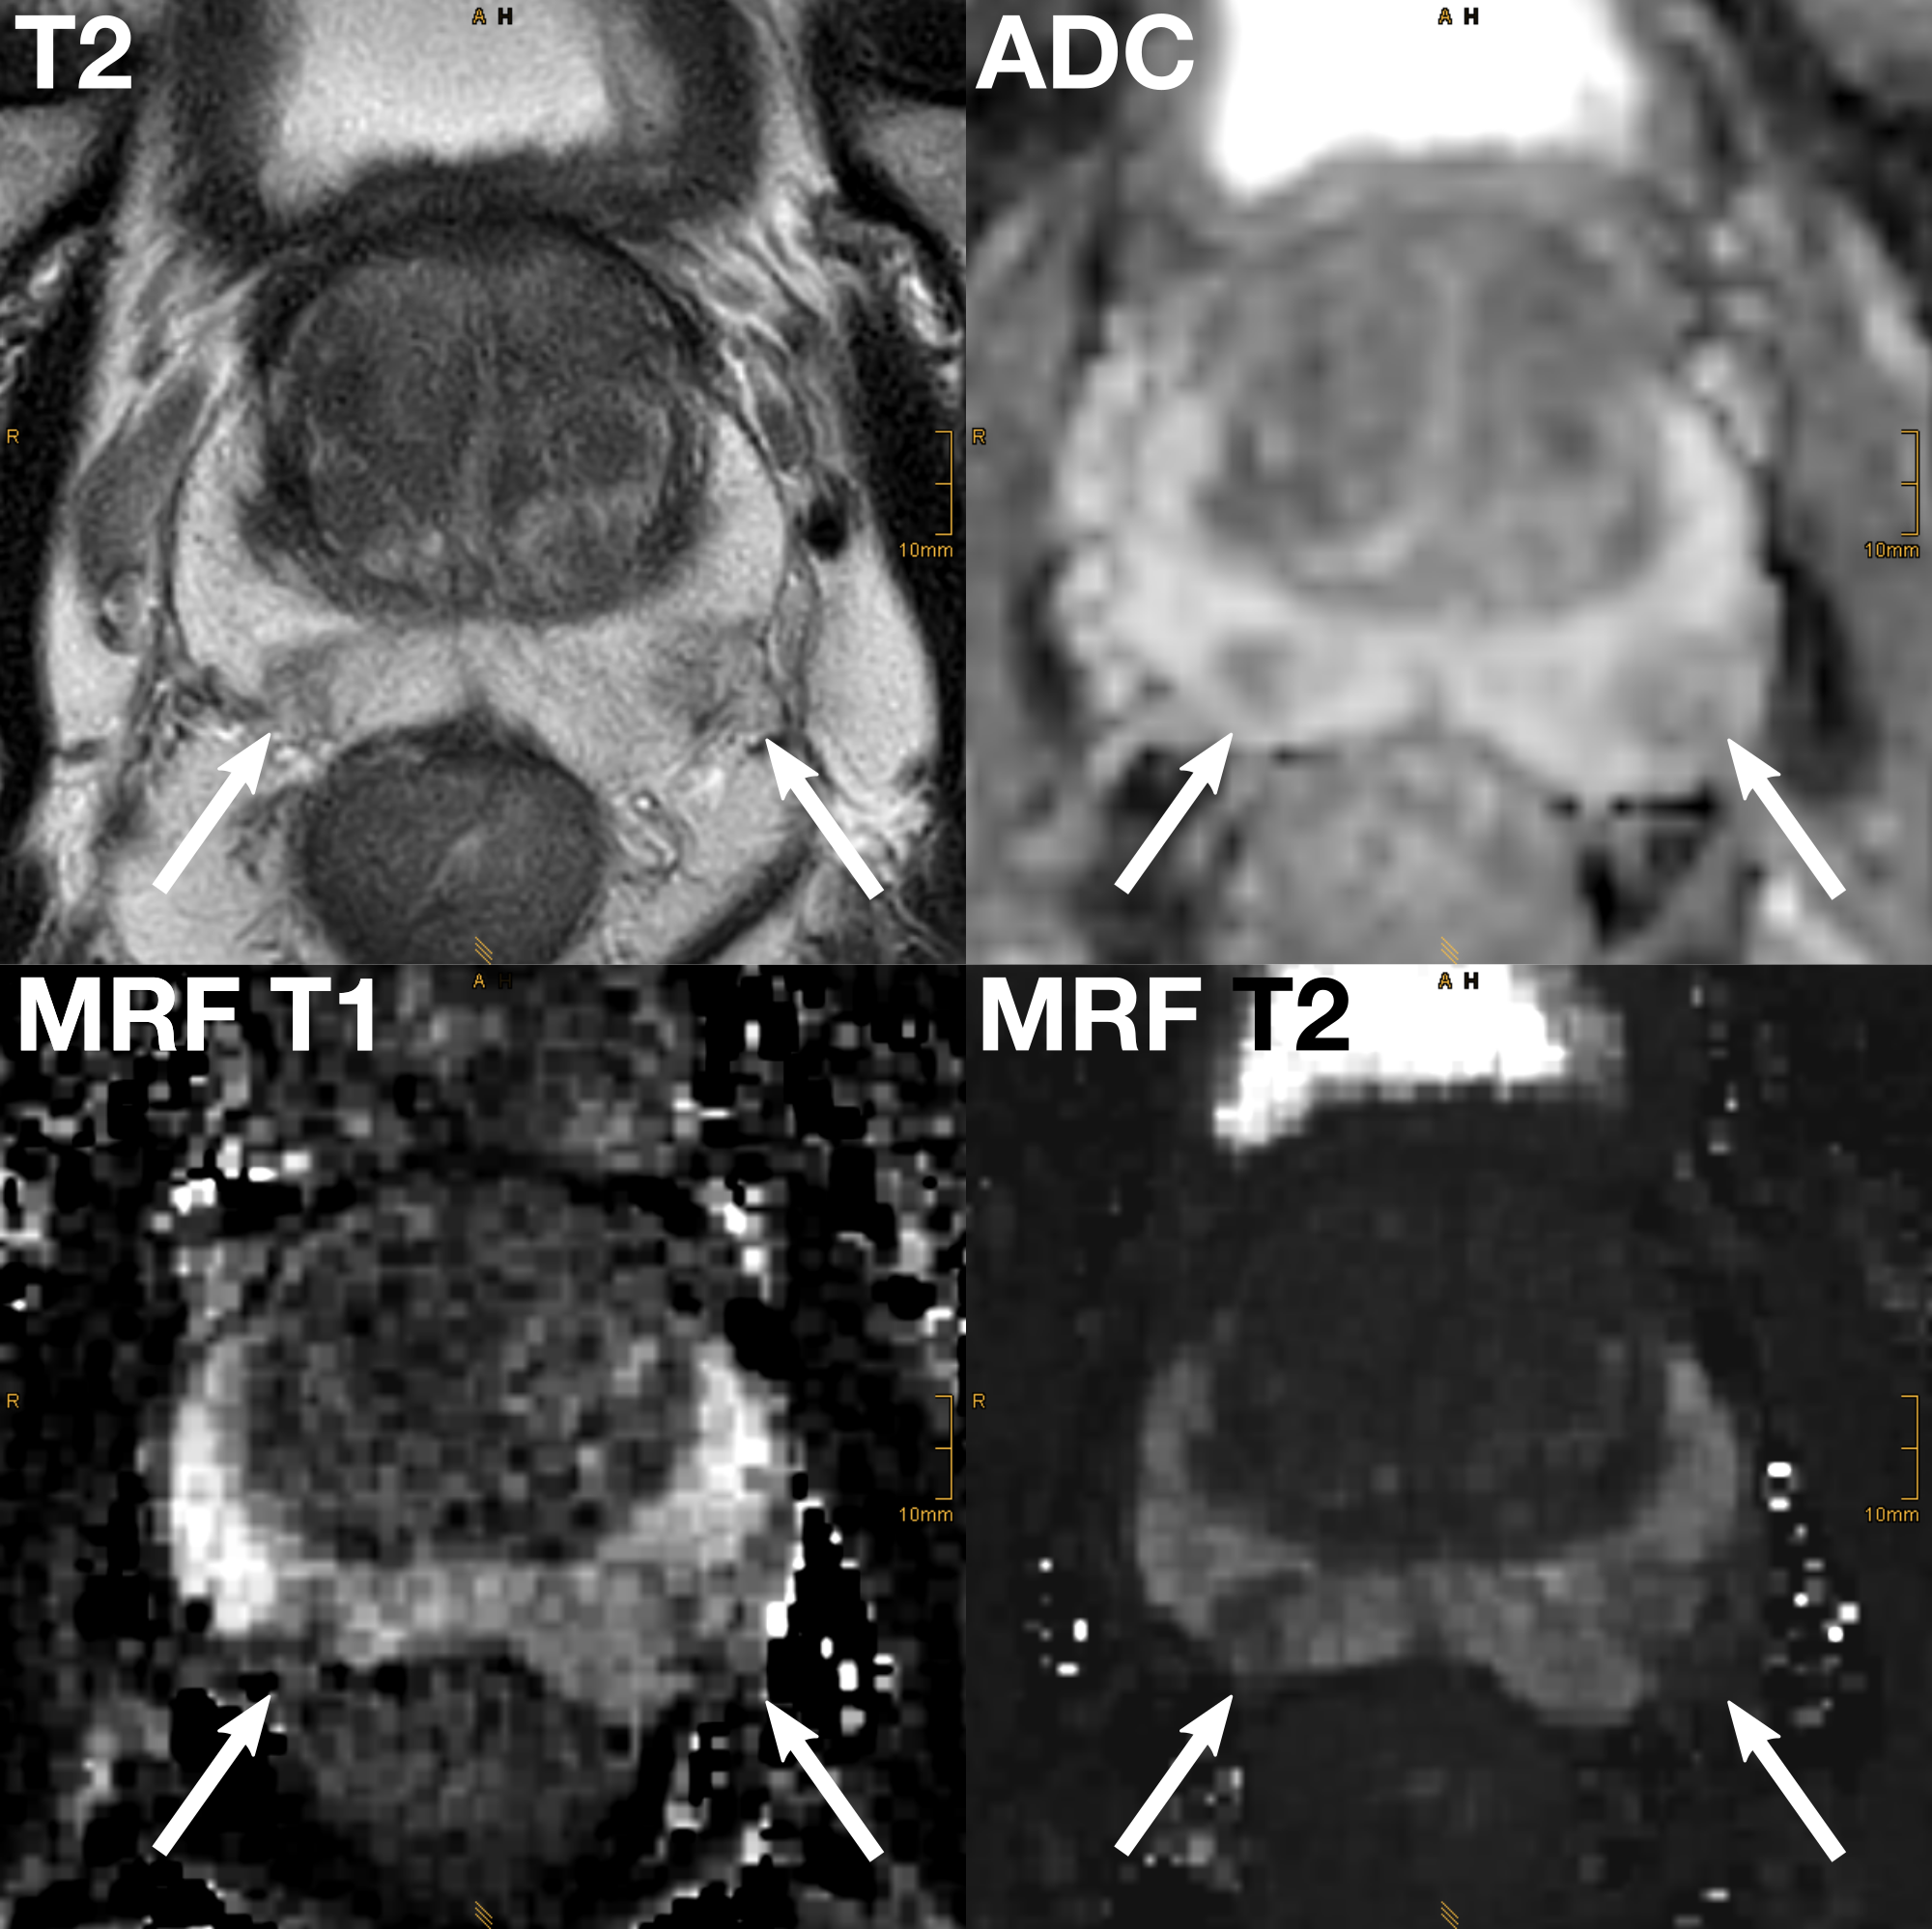
Shown is a 77 year old patient with an elevated PSA-level of 13.5 ng/ml. PSA density was 0.118 ng/ml/cc.
The arrows point to a PI-RADS 4 lesion on the left (PZpm/PZpl) and a PI-RADS 3 lesion on the right (PZpm). Targeted biopsy confirmed an acinar adenocarcinoma on the left (ISUP 3) and revealed benigne tissue on right.
Note the significant decrease in signal intensity on the axial high-resolution T2-weighted image, the ADC map and the MRF T1 and T2 maps.

Box-and-whisker plots of apparent diffusion coefficient (ADC) values, MRF T1 and T2 relaxation times for normal peripheral zone (PZ), clinically non-significant prostate cancer lesions (non-significant PCa) and clinically significant prostate cancer lesions (significant PCa) in the PZ.
Significant differences are marked with *. p<.05 was considered to indicate a significant difference.

Box-and-whisker plots of apparent diffusion coefficient (ADC) values, MRF T1 and T2 relaxation times for normal transitional zone (TZ), clinically non-significant prostate cancer lesions (non-significant PCa) and clinically significant prostate cancer lesions (significant PCa) in the TZ.
Significant differences are marked with *. p<.05 was considered to indicate a significant difference.