4316
Optimizing b-value Sampling Strategies with Integrative DWI: A Comparison Study on DISMANTLE Parameters in Breast1Department of Biomedical Engineering, University of Illinois Chicago, Chicago, IL, United States, 2Center for MR Research, University of Illinois Chicago, Chicago, IL, United States, 3University of Illinois Chicago, Chicago, IL, United States, 4Department of Radiology, University of Illinois Chicago, Chicago, IL, United States, 5Department of Neurosurgery, University of Illinois Chicago, Chicago, IL, United States
Synopsis
Keywords: Breast, Breast, Tissue heterogeneity, tissue vascularity, perfusion, advanced DWI, non-Gaussian DWI
Motivation: This study is driven by the pressing need for the standardization of breast diffusion-weighted imaging (DWI) techniques.
Goal(s): The objective is to explore the influence of b-value selection on the parameters estimated by using an integrated DWI approach (DISMANTLE) that aims to simultaneously assess tissue cellularity, vascularity, and heterogeneity.
Approach: We conducted a systematic analysis by evaluating DISMANTLE parameters in healthy breast tissue using diverse b-value sampling strategies.
Results: Our findings identified an ideal b-value distribution for accurate implementation of DISMANTLE in breast. This dataset included 12 b-values, reducing scan time by 34% compared to the comprehensive DWI protocol featuring broad b-value range.
Impact: This study emphasizes the role of b-value sampling in advanced breast DWI. Our systematic evaluation contributes to the potential success of advanced DWI techniques in breast imaging and the current discussion of the need for standardization in advanced DWI.
Introduction
Accurate in vivo characterization of breast tissue is important for efficient risk assessment, diagnosis, and optimized treatment strategies in breast cancer. Diffusion-weighted imaging (DWI) with apparent diffusion coefficient has become a pillar of clinical MRI for probing tissue cellularity1. Recent advancements in DWI have revealed that specific ranges of b-values in the diffusion-weighted signal can provide insights into various tissue properties2,3. One of these advanced techniques is an integrated DWI approach for simultaneous assessment of tissue cellularity, vascularity, and heterogeneity – so called DISMANTLE4 – which combines the intravoxel incoherent motion (IVIM) model5 at low b-values with a high-b-value continuous-time random-walk (CTRW) model6. As emphasized by the EUSOBI International Breast DWI working group7, the challenge in advanced breast DWI lies in standardization where the number of b-values and the choice of their distribution plays a crucial role. Considering that different ranges of b-value selections sensitize the signal to different components of diffusion, this decision can make a substantial difference in the parameters, particularly those recognized for their variability8. In this study, we performed a systematic comparison among the DISMANTLE parameters in the breast tissue of a healthy volunteer obtained from a total of eight different b-value sampling strategies extracted from a comprehensive DWI protocol with a wide b-value range.Methods
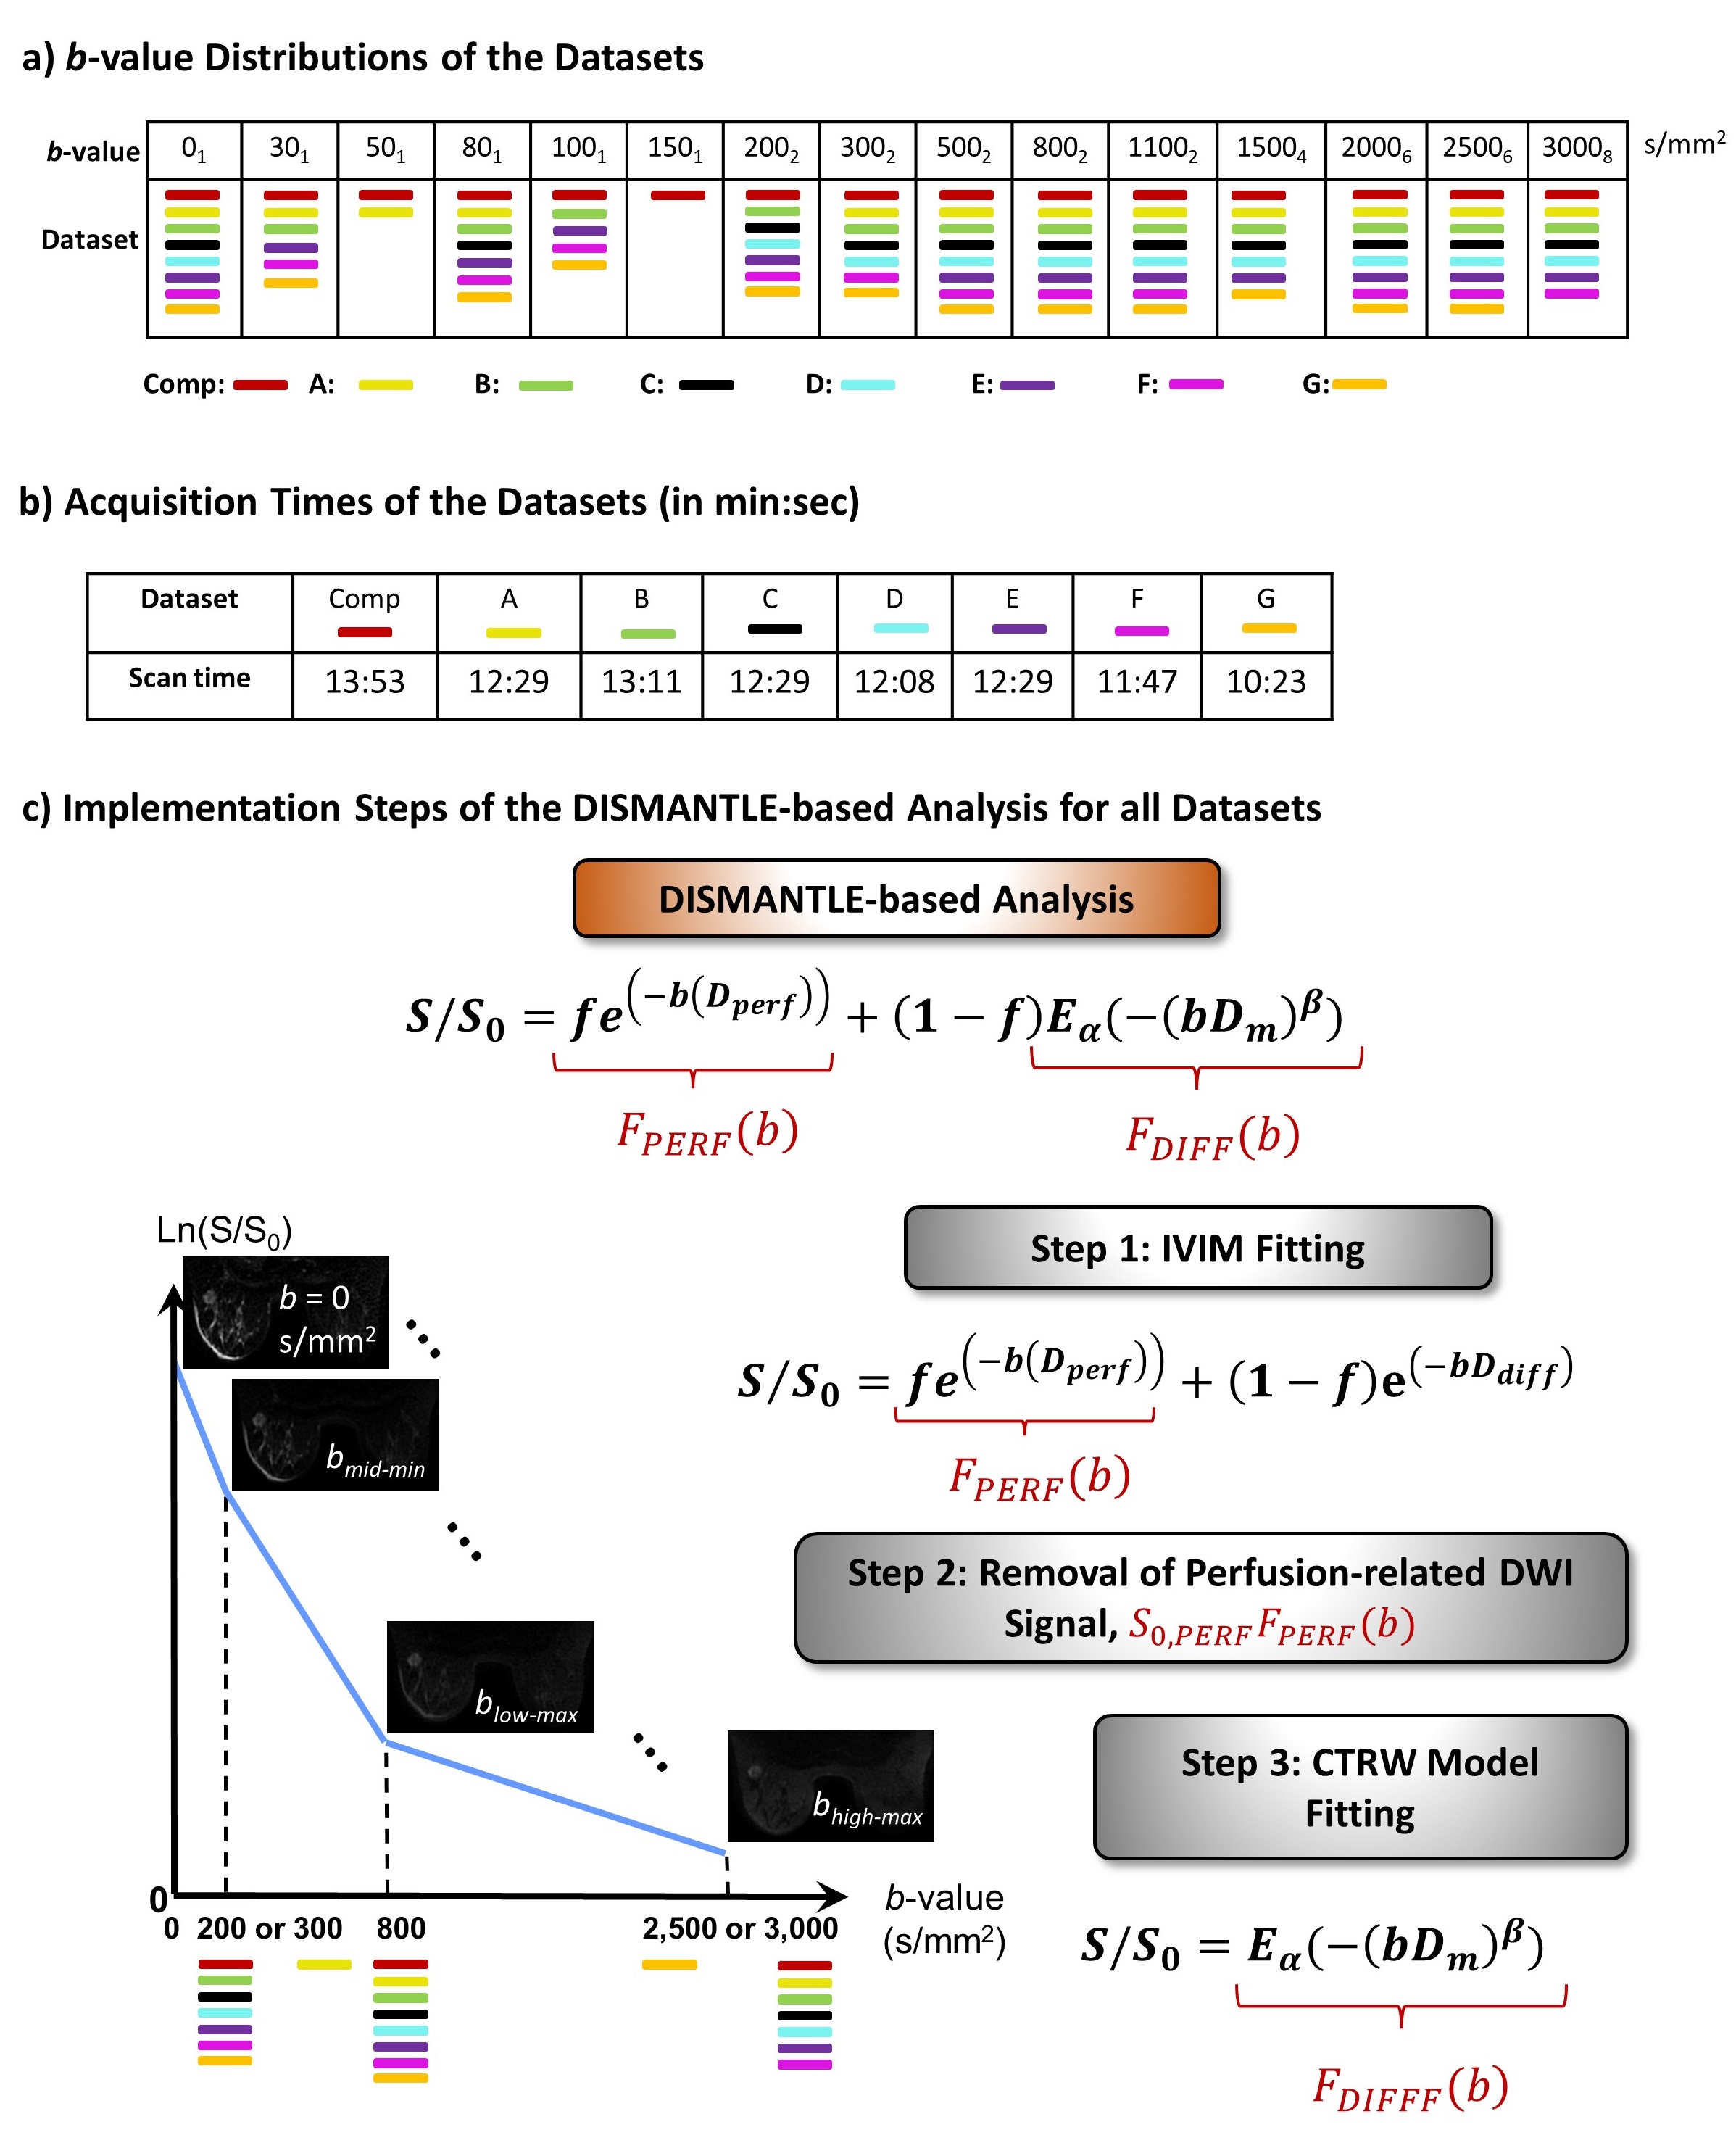
Datasets: A healthy volunteer underwent an axial MRI scan at 3T (GE Healthcare, Discovery MR750) with an 8-channel breast coil. DWI was performed with 15 b-values (0-3000 s/mm2), TR/TE=7000/78ms, slice thickness=5mm, FOV=32cm×32cm, and matrix=256×256). This comprehensive dataset is referred to as “DatasetComp” from which an additional seven subsets, DatasetA-G, were generated. The datasets and corresponding scan times are illustrated in Figs. 1a and 1b, respectively.DWI Image Analysis: The diffusion-weighted images in all datasets were analyzed using DISMANTLE4
$$ S/S_0=fe(-bD_{perf } )+(1-f) E_α (-(bD_m )^β), (1) $$
where Eα is a Mittag-Leffler function. Eq.(1) produces vascularity-related (IVIM’s perfusion fraction, f and pseudo-diffusion coefficient, Dperf), cellularity-related (CTRW’s diffusion coefficient, Dm), and heterogeneity-related (CTRW’s temporal and spatial diffusion heterogeneity, α and β) parameters. DISMANTLE was implemented through a multi-step approach as in Figure 1c.
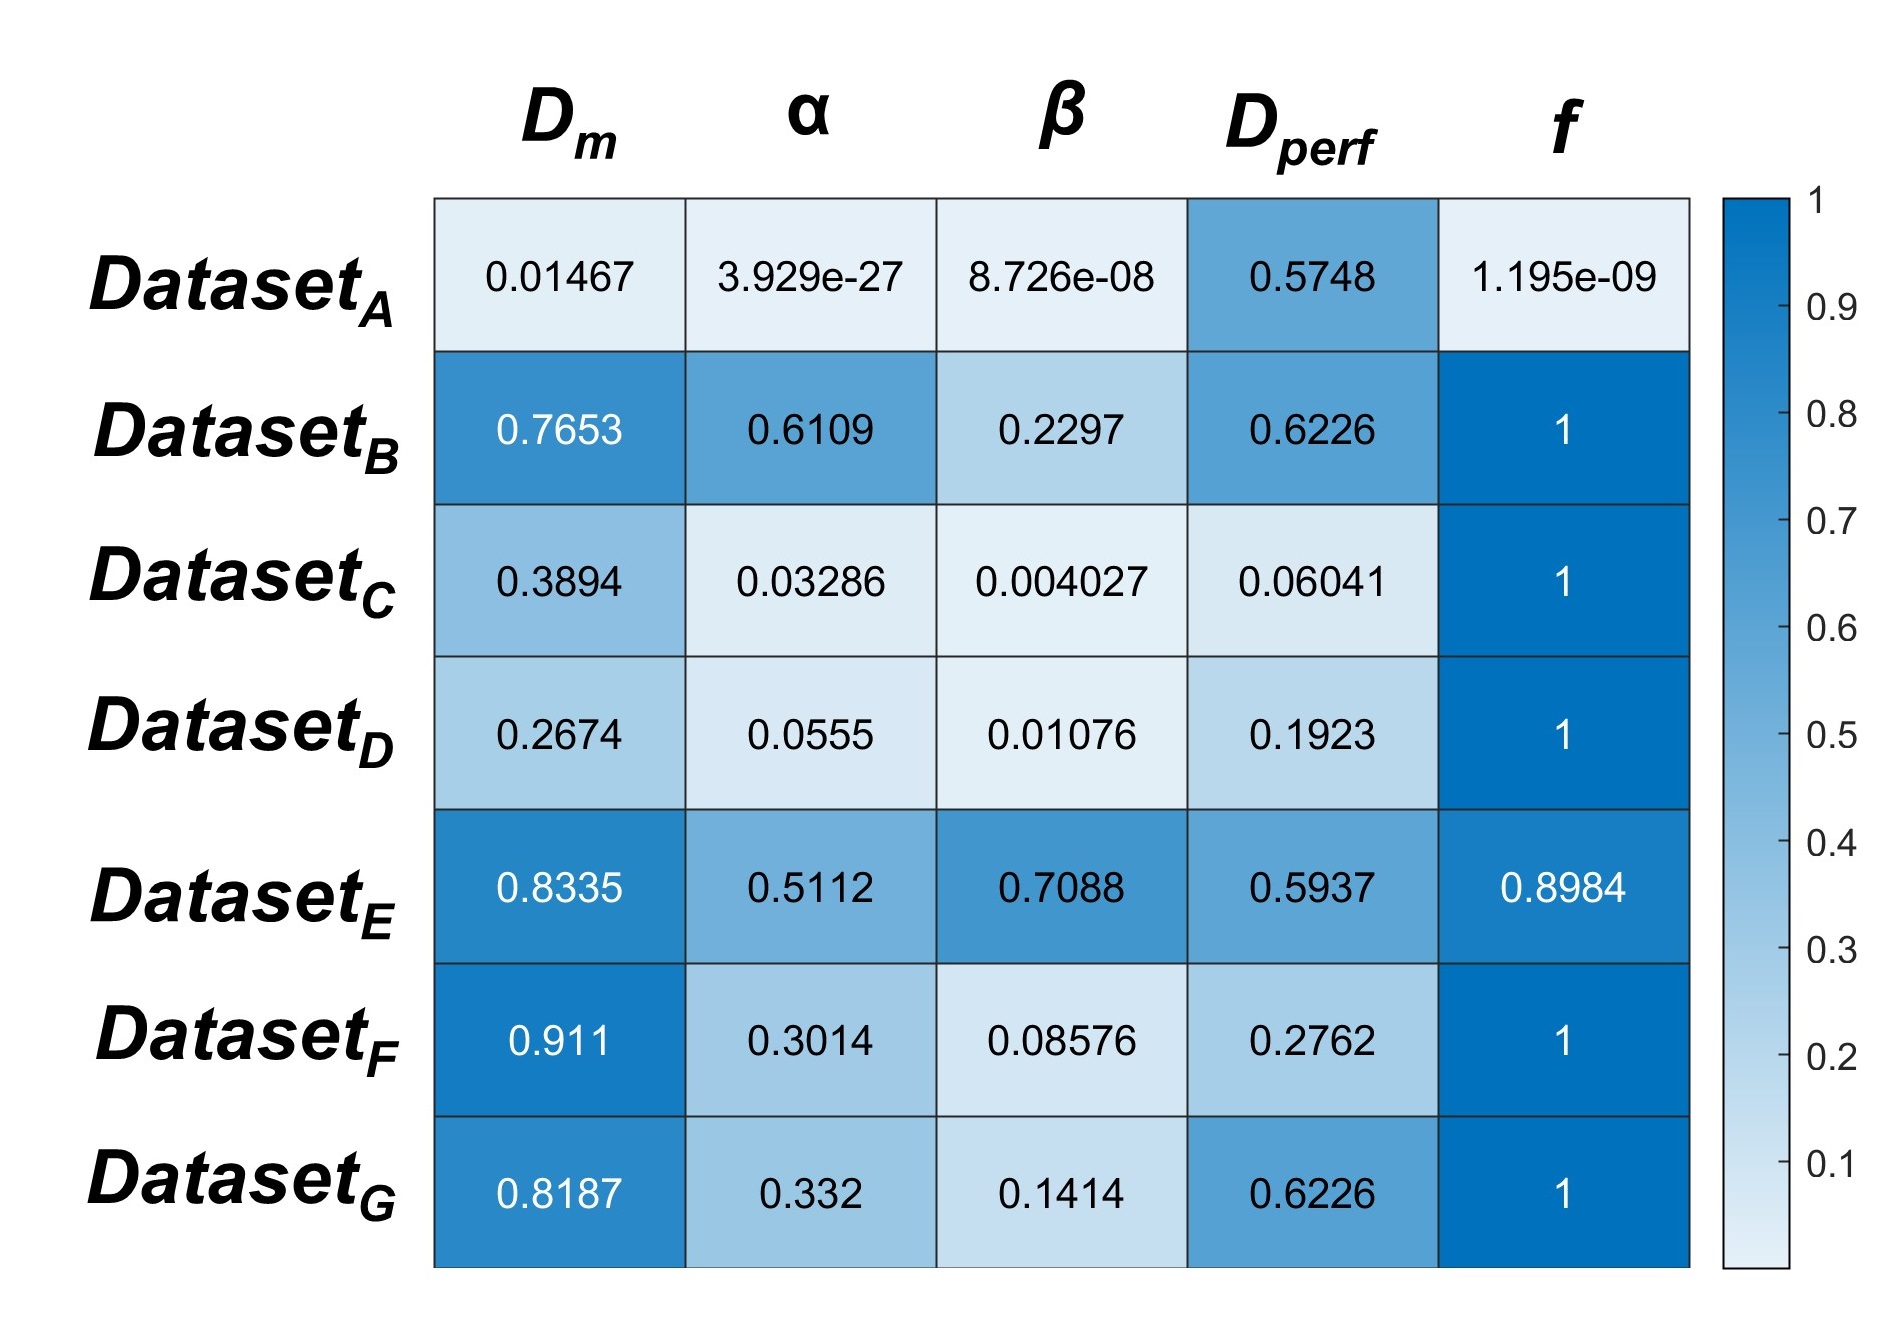
Statistical Analysis: A total of 100 regions of interest (ROIs) with 5×5 voxels were drawn on five consecutive mid-slices of breast parenchyma. The mean values of DISMANTLE parameters were computed over the ROIs. Comparison of mean parameter values from each of the datasets was performed using a Mann-Whitney-U test (significance threshold: 0.05); and the results were demonstrated using a heatmap. Coefficients of variation (CV) were calculated as the ratio of standard deviation over the mean for each parameter.
Results
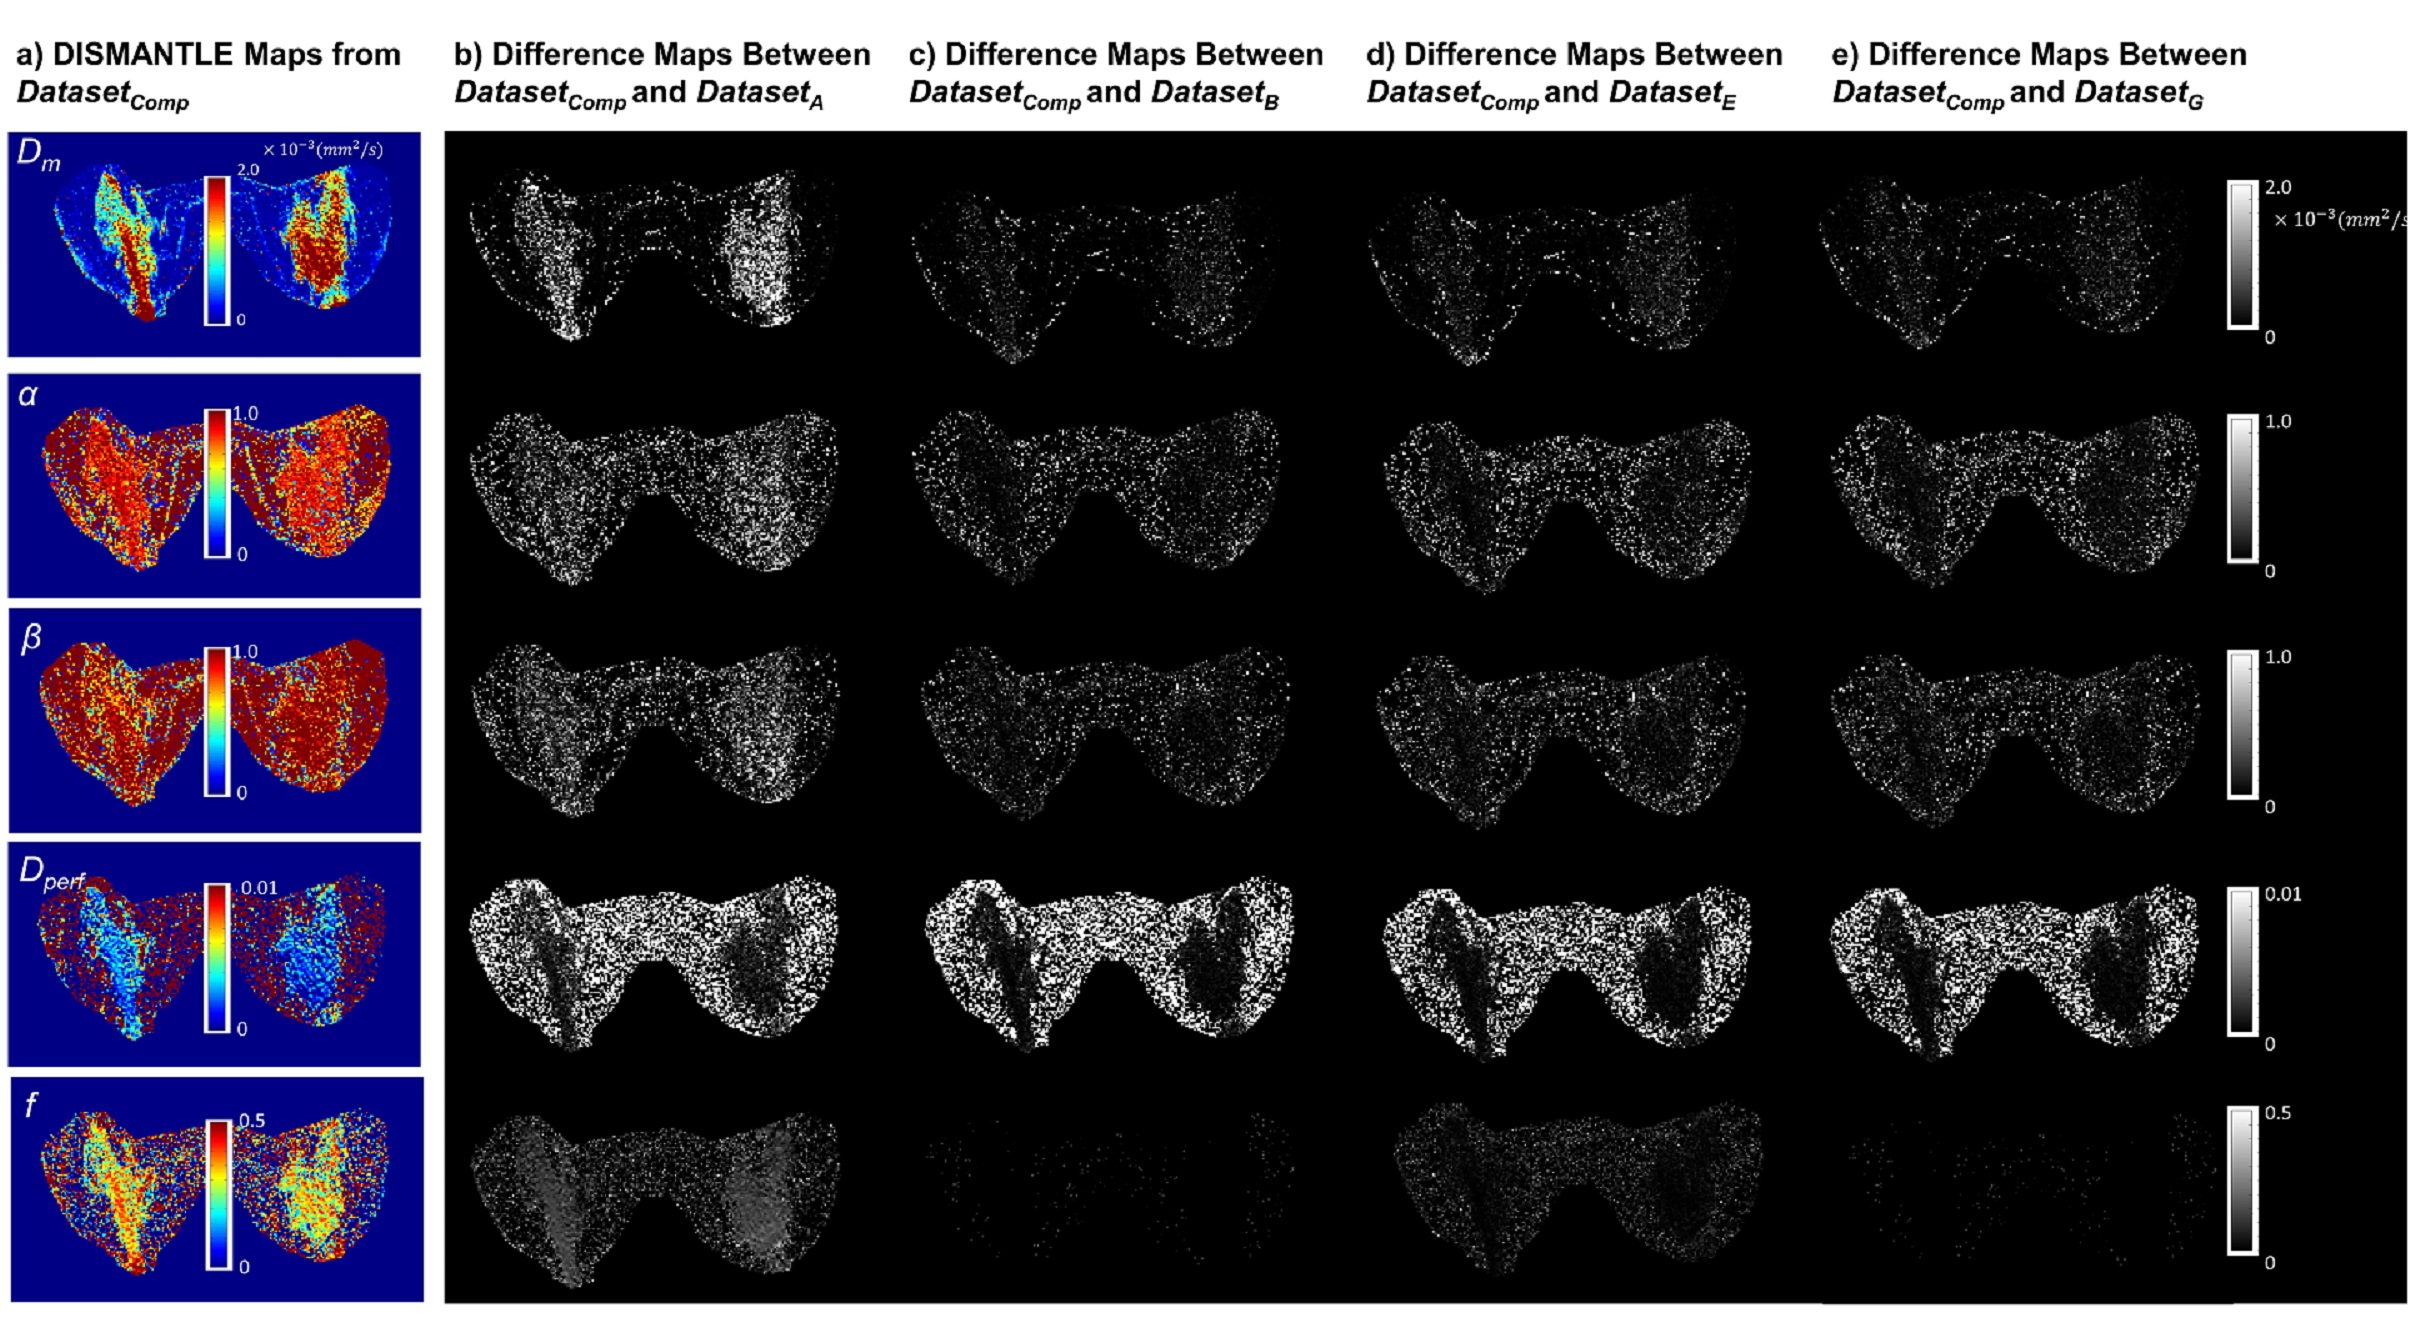
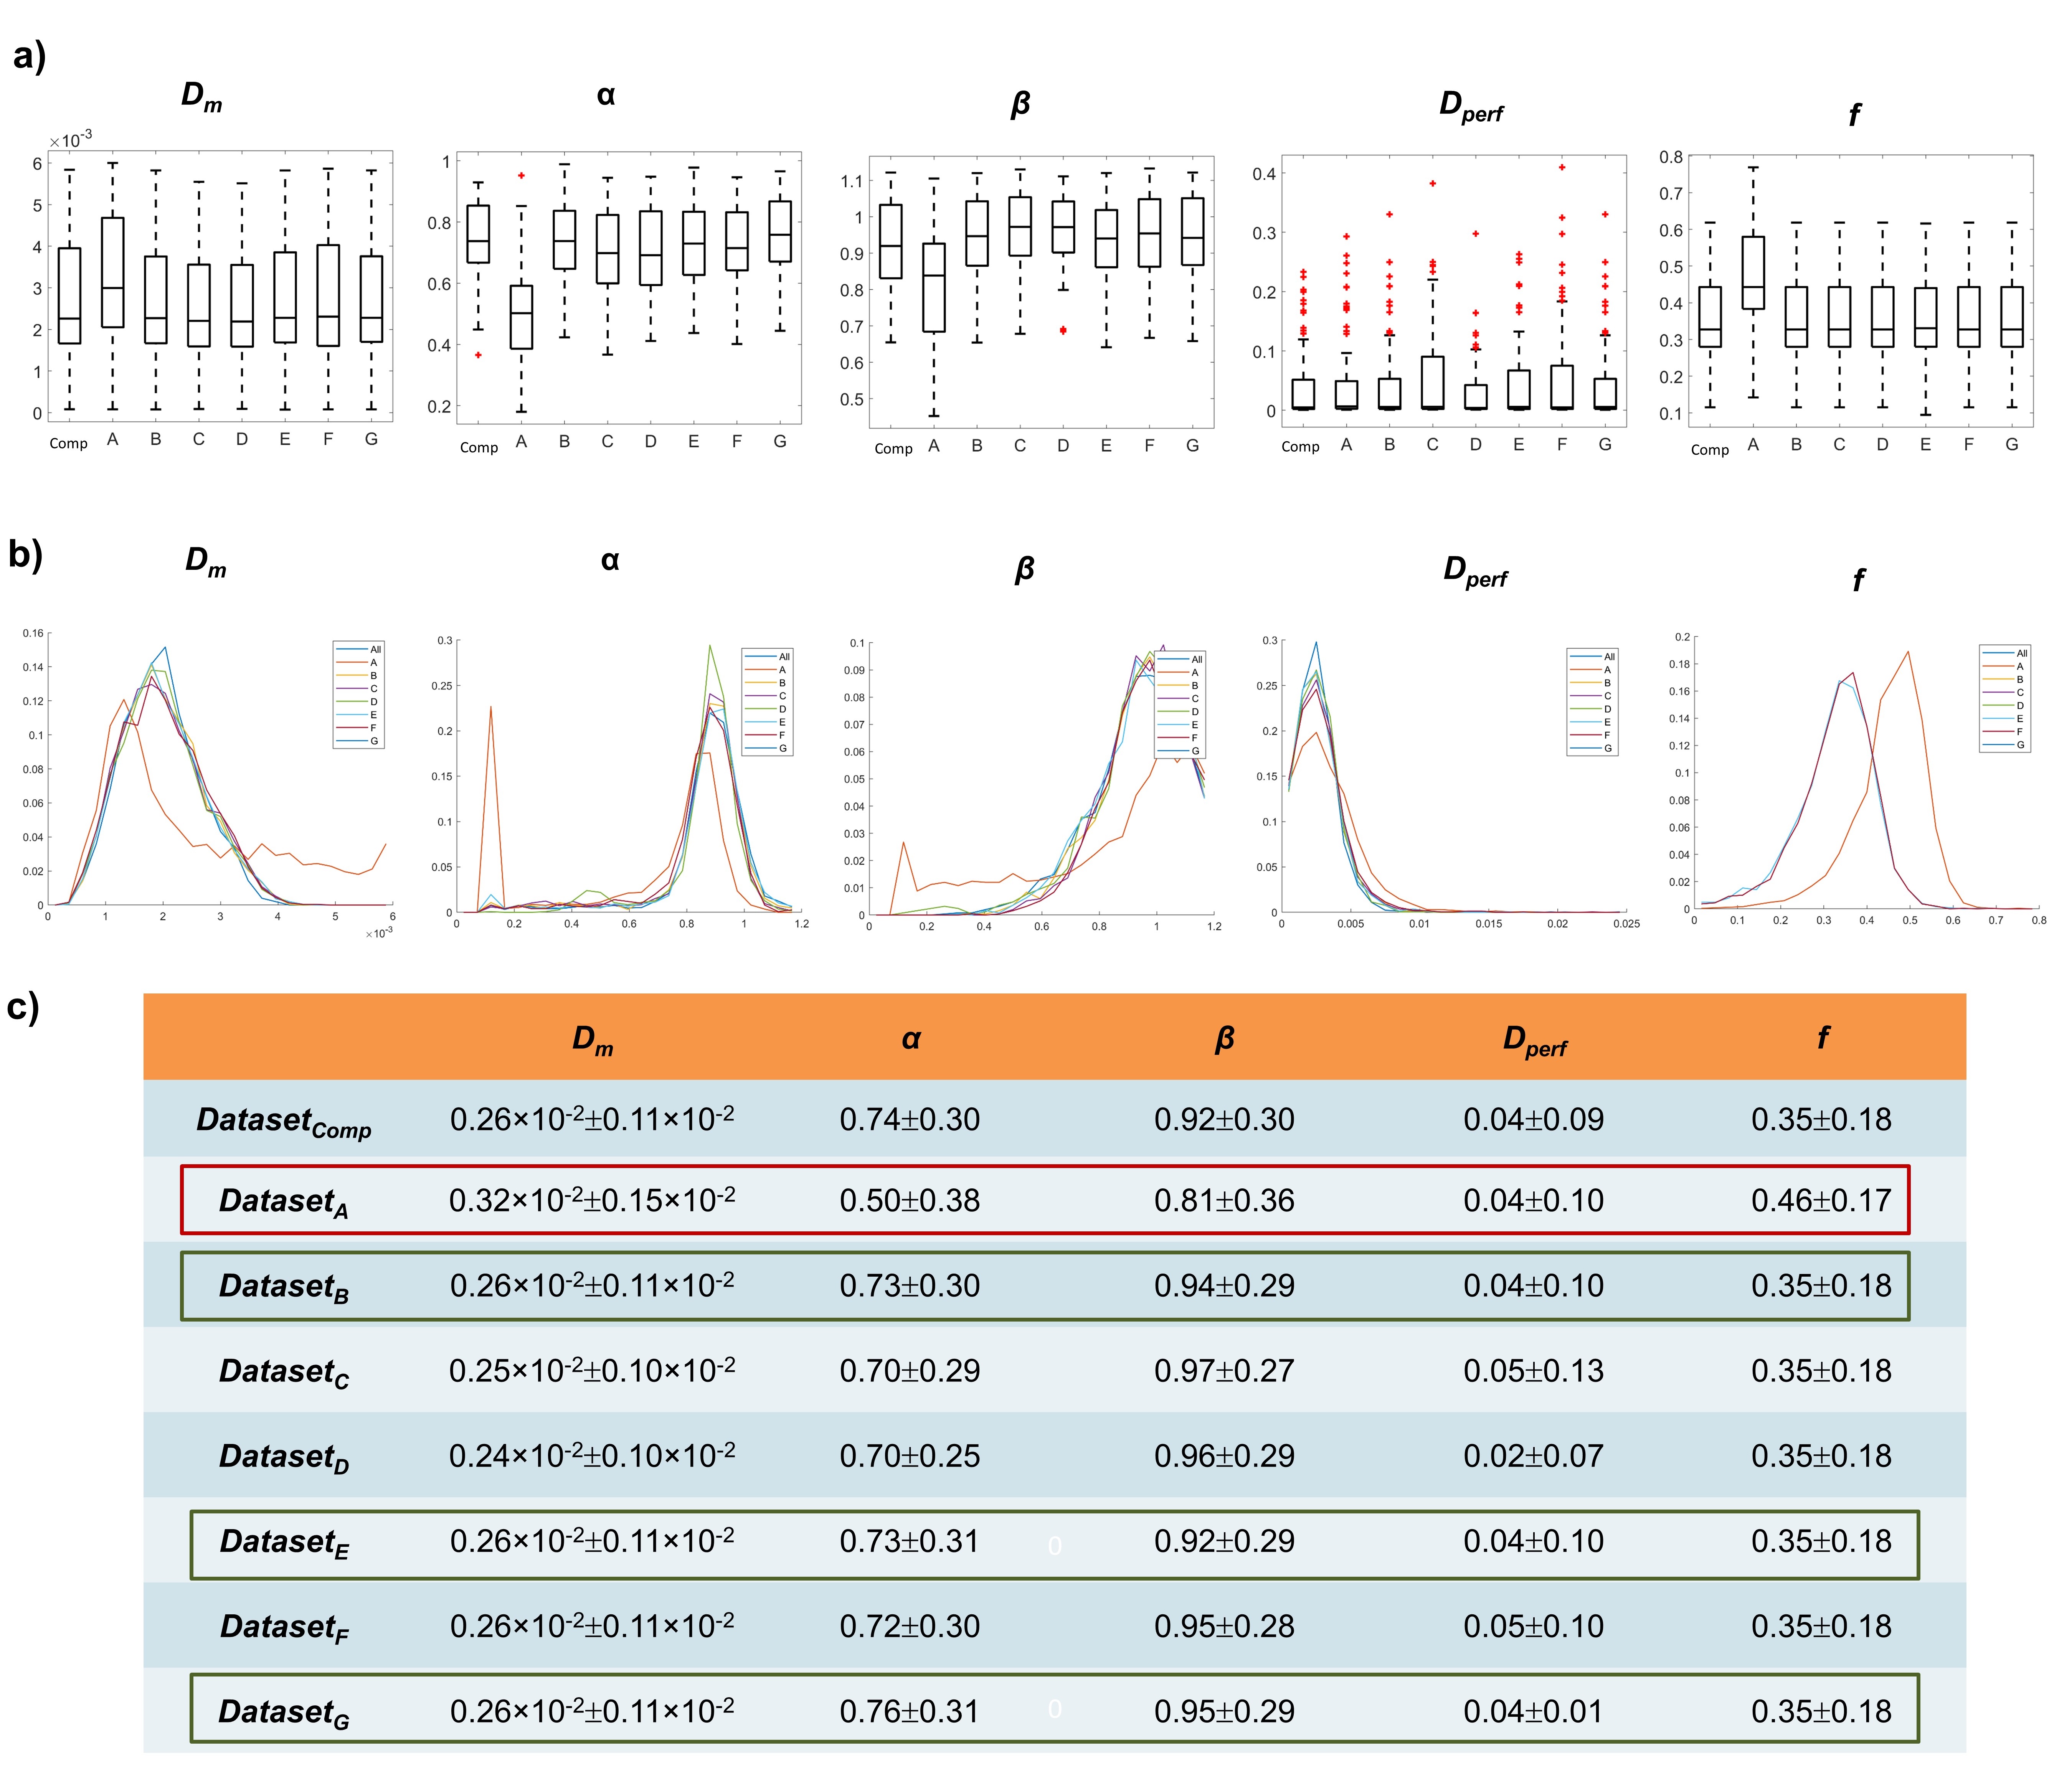
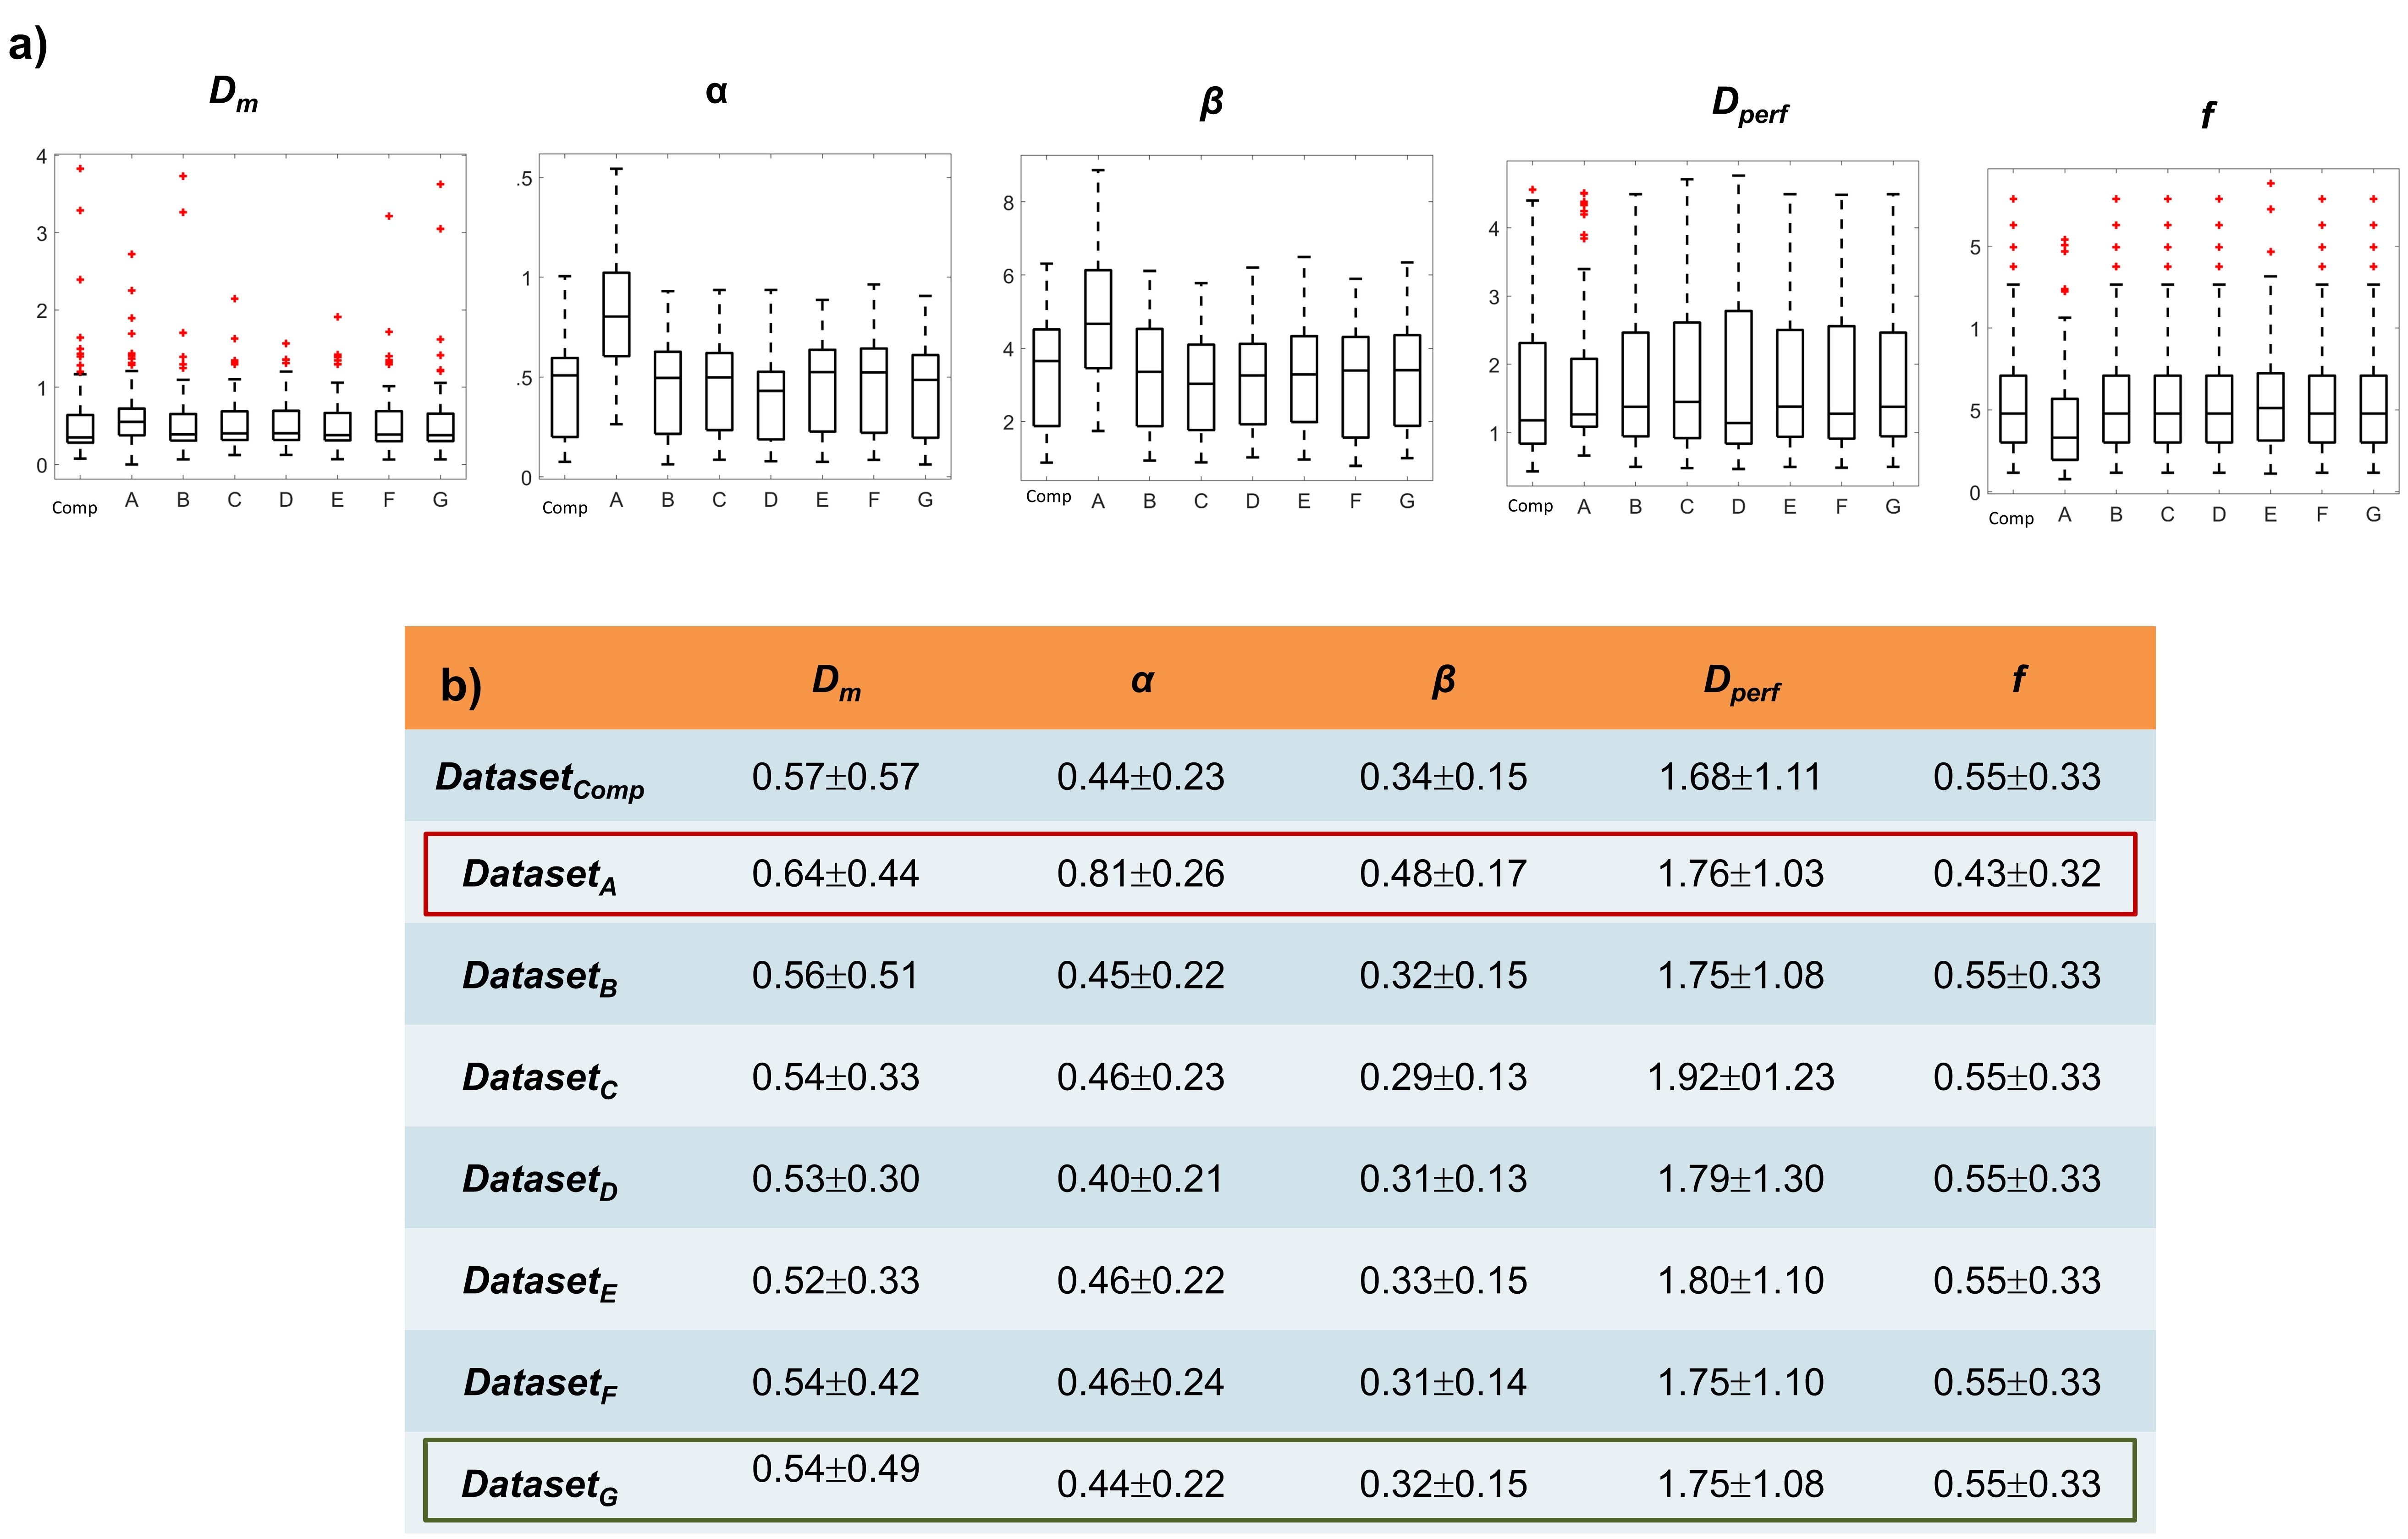
Figures 2a-2e show DISMANTLE parameters obtained from DatasetComp and their absolute difference maps between those obtained from DatasetA, DatasetB, DatasetE, and DatasetG, respectively, as examples. The parameters are also visualized in Figures 3a and 3b with histograms and boxplots; and summarized with descriptive statistics in Figure 3c. While variations can be observed in most parameters among most datasets, the most striking differences were observed with DatasetA. Figure 4 shows that statistically significant differences were determined between DatasetComp and other datasets in most parameters, with 𝛼 and β exhibiting more pronounced disparities. Figures 5a and 5b show the boxplots and the descriptive statistics of the CV values of each DISMANTLE parameter from each dataset. When the results in Figures 3-5 were evaluated collectively, as explained in figure captions, DatasetB, DatasetE and DatasetG stood out by producing similar parameter values to DatasetComp (darker blue cells in heatmap in Figure 4) with comparable or lower CVs and ~6%, and ~12%, ~34% reduction in scan time, respectively (Figure 1b).Discussion and Conclusion
We systematically compared DISMANTLE parameters within the breast tissue of a healthy volunteer to identify an optimized b-value sampling scheme for advanced DWI analysis. This entailed analyzing multiple datasets derived from a comprehensive b-value sampling scheme while considering parameters' deviation from those obtained from the comprehensive dataset and a low coefficient of variability. Our findings highlighted the effectiveness of DatasetG, which includes 12 b-values, allowing for a clinically feasible scan time of approximately 10 minutes. Notably, our study revealed that a b-value of 2500 s/mm2 suffices for accurate CTRW model fitting in breast tissue, in contrast to high b-value DWI studies in brain3 where b-values can reach 4000 s/mm2. This underscores the need for organ-specific DWI protocols and the complexities in selecting b-value schemes for advanced DWI protocols. Our systematic evaluation, with potential expansion to larger sample sizes and diverse disease conditions, contributes to the potential success of advanced breast DWI techniques like DISMANTLE in clinical studies and the current discussion of the need for standardization in advanced DWI.Acknowledgements
This work was supported in part by the NIH (Grant No. 1R21EB032071).References
[1] Jiang R, Ma Z, Dong H, et al. Diffusion tensor imaging of breast lesions: Evaluation of apparent diffusion coefficient and fractional anisotropy and tissue cellularity. Br J Radiol. 2016;89(1064).
[2] Le Bihan D. Apparent diffusion coefficient and beyond: What diffusion MR imaging can tell us about tissue structure. Radiology. 2013;268(2):318-322.
[3] Tang L, Zhou XJ. Diffusion MRI of cancer: From low to high b-values. J Magn Reson Imaging. 2019;49(1):23-40.
[4] Karaman M, Che S, Dan G, et al. Integrated DWI for pre-treatment prediction of response to neoadjuvant chemotherapy in breast cancer. Proc ISMRM Annual Meeting; 2022;S401.
[5] Le Bihan D, Breton E, Lallemand D, et al. MR imaging of intravoxel incoherent motions: application to diffusion and perfusion in neurologic disorders. Radiology. 1986;161(2):401-407.
[6] Karaman MM, Sui Y, Wang H, et al. Differentiating low- and high-grade pediatric brain tumors using a continuous-time random-walk diffusion model at high b-values. Magn Reson Med. 2016;76(4):1149-1157.
[7] Baltzer P, Mann RM, Iima M, et al. EUSOBI international Breast Diffusion-Weighted Imaging working group. Diffusion-weighted imaging of the breast-a consensus and mission statement from the EUSOBI International Breast Diffusion-Weighted Imaging working group. Eur Radiol. 2020 Mar;30(3):1436-1450.
[8] Chabert S, Verdu J, Huerta G, et al. Impact of b-Value Sampling Scheme on Brain IVIM Parameter Estimation in Healthy Subjects. Magn Reson Med Sci. 2020 Aug 3;19(3):216-226.
[9] Sigmund EE, Cho GY, Kim S, et al. Intravoxel incoherent motion imaging of tumor microenvironment in locally advanced breast cancer. Magn Reson Med. 2011;65:1437-1447.
[10] Cho GY, Moy L, Zhang JL, et al. Comparison of fitting methods and b-value sampling strategies for intravoxel incoherent motion in breast cancer. Magn Reson Med. 2015;74(4):1077-1085.
Figures