4315
To compare the value of intratumoral and peritumoral IVIM and MUSE-IVIM magnetic resonance imaging in predicting of HER-2 status in breast cancer1Radiology, The First Hospital of Lanzhou University, Lanzhou, China, 2GE HealthCare MR Research, Beijing, China, 3Breast Disease, The First Hospital of Lanzhou University, Lanzhou, China
Synopsis
Keywords: Breast, Breast, MRI; MUSE-IVIM; IVIM; HER-2
Motivation: Few studies had explored different diffusion imaging techniques of magnetic resonance imaging for molecular prognostic factors of breast cancer, and human epidermal growth factor receptor-2(HER-2) was closely related to targeted therapy.
Goal(s): To compare the effect of high-resolution magnetic resonance intravoxel incoherent motion based on multiplexed sensitivity encoding (MUSE-IVIM) and conventional IVIM in predicting HER-2 status in breast cancer.
Approach: Different parameters of MUSE-IVIM and IVIM within and around the tumor were analyzed, including apparent diffusion coefficient (ADC), tissue diffusivity (Dt), pseudo diffusivity (Dp), perfusion fraction (f).
Results: IVIM-Dt-intratumoral predicted HER-2 with the highest value(AUC=0.775, P=0.003).
Impact: Although the signal to noise ratio (SNR) of MUSE-IVIM was higher than IVIM, they may be evenly matched in predicting HER-2 in breast cancer, which required more research and exploration.
Introduction
Previous studies on breast cancer mainly were dedicated to the intratumoral region1-3, while recent studies have shown that the microenvironment of tumor was crucial in the occurrence and progression of breast cancer, and the peritumoral region may contain characteristic information, for instance, vascular lymphatic and immune cell infiltration4. The parameters of traditional IVIM were calculated by means of double exponential curve fitting5. Nevertheless MUSE-IVIM was used to fill K-space with multiple excitations to achieve high resolution and high SNR6. At present, the gold standard of HER-2 examination are invasive pathological methods, therefore, non-invasive prediction of HER-2 status before surgery has to be settled urgently.Methods
Participants and data acquisition:This study was conducted in accordance with the Helsinki Declaration and written informed consent for study participation was waived, which was permitted by Institutional Ethics Committee. A total of 47 cases of breast cancer patients confirmed by pathology were collected, including 14 cases in the positive HER-2 group and 33 cases in the negative HER-2 group, who underwent preoperative 3.0T MR scanning( SIGNATM Architect, GE Healthcare, Milwaukee WI, USA) with sequences of IVIM and MUSE-IVIM analyzed retrospectively from September 2022 to August 2023.
Image analysis:
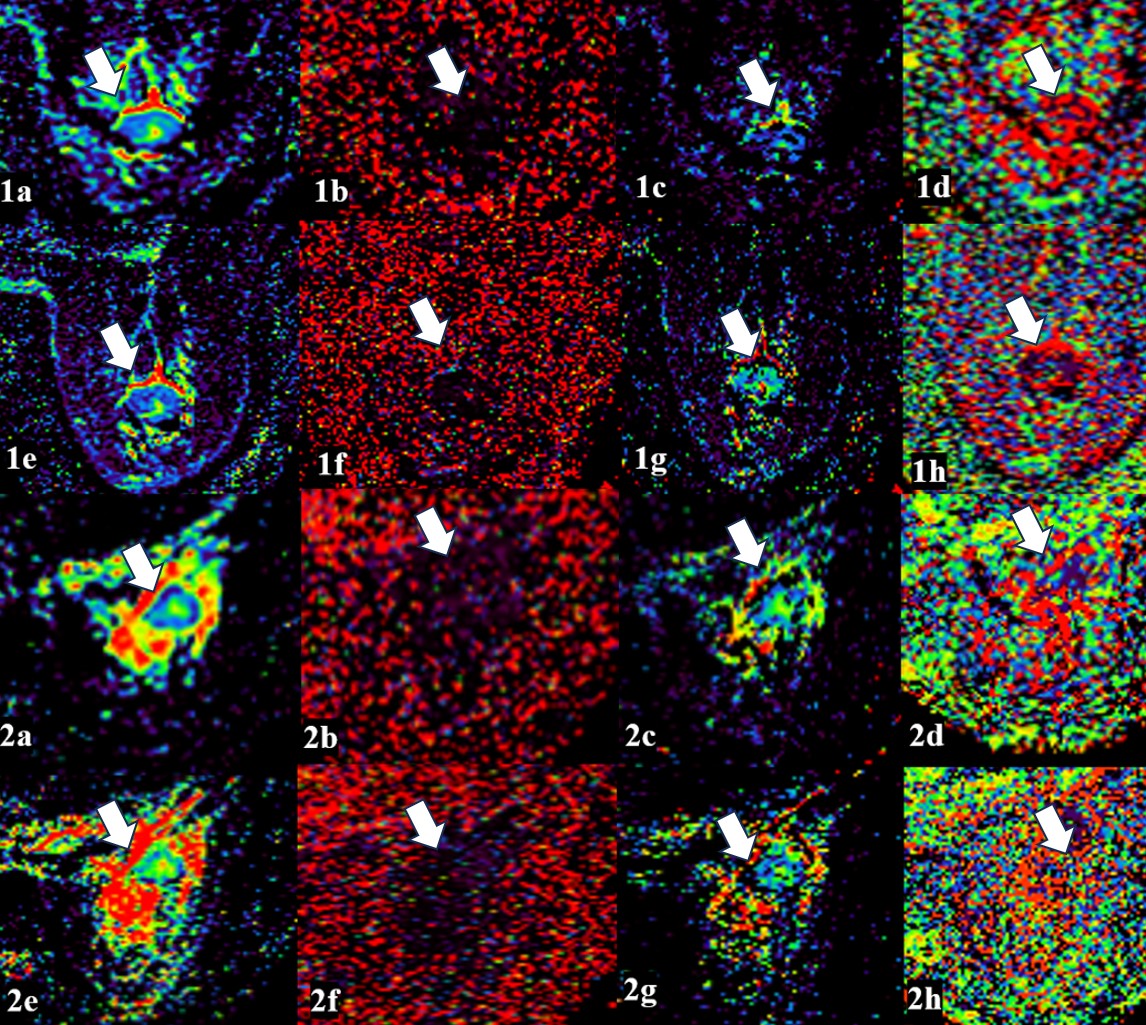
Breast MRI images were obtained by a 3.0T scanner using a dedicated 8-channel phased-array breast coil in the prone position. Dt, Dp, f and ADC images were analyzed with iQuant workstation. Image registration was performed on ITK-SNAP software (version 3.8, http://www.itksnap.org) with reference to the breast MRI images at the maximum intensification stage. Two breast-specialized radiologists delineated the tumor regions of interest (ROI) and peritumoral regions of the tumor( the square ROIs were placed on the enhanced image at the solid area of maximum intratumoral enhancement and the area within 2mm periatumoral area respectively). The ROIs were plotted in the solid region inside the tumor and the region within 2mm of the tumor circumference without considering about the HER-2 status, and intraclass correlation coefficient(ICC) was calculated. In addition, SNR0 (b=0 s/mm2) and SNR800 (b=800 s/mm2) were measured in picture archiving and communication systems(PACS) .
Pathological criteria:
A HER-2 staining intensity score of not lower than 3 with immumohistochemical staining, or a HER-2 staining intensity score of 2 with gene amplification confirmed by fluorescence in situ hybridization(FISH), was considered to be positive (HER-2 positive group, 14 cases), while otherwise was considered to be low (HER-2 negative group, 31 cases)7.
Statistical analysis:
The differences of the clinicopathological characteristics and multimodal MRI quantitative parameters(the intratumoral parameters were expressed by “-in” and the peritumoral parameters were expressed by “-per”) between the positive HER-2 group and the negative HER-2 group were analyzed by Shapiro Wilk-test, Chi Square-test, student’s T-test, and Mann Whitney U-test of two independent samples. The parameters with statistically significant differences between the two groups were formed into logistic regression model, and the diagnostic efficacy of these models were analyzed by ROC curves. ICC test was applied to verify the intergroup consistency, and paired t-test or Wilcoxon rank sum test were used to compare the differences between objective scores for image quality. IBM SPSS Statistics 25 was used for statistical analyses at the bilateral 5% significance level, and P<0.05 indicated that the differences were statistically significant. All drawings were done on MedCalc statistical software(version 20.02, Belgium) and GraphPad Prism software(version 9.51, Boston).
Results
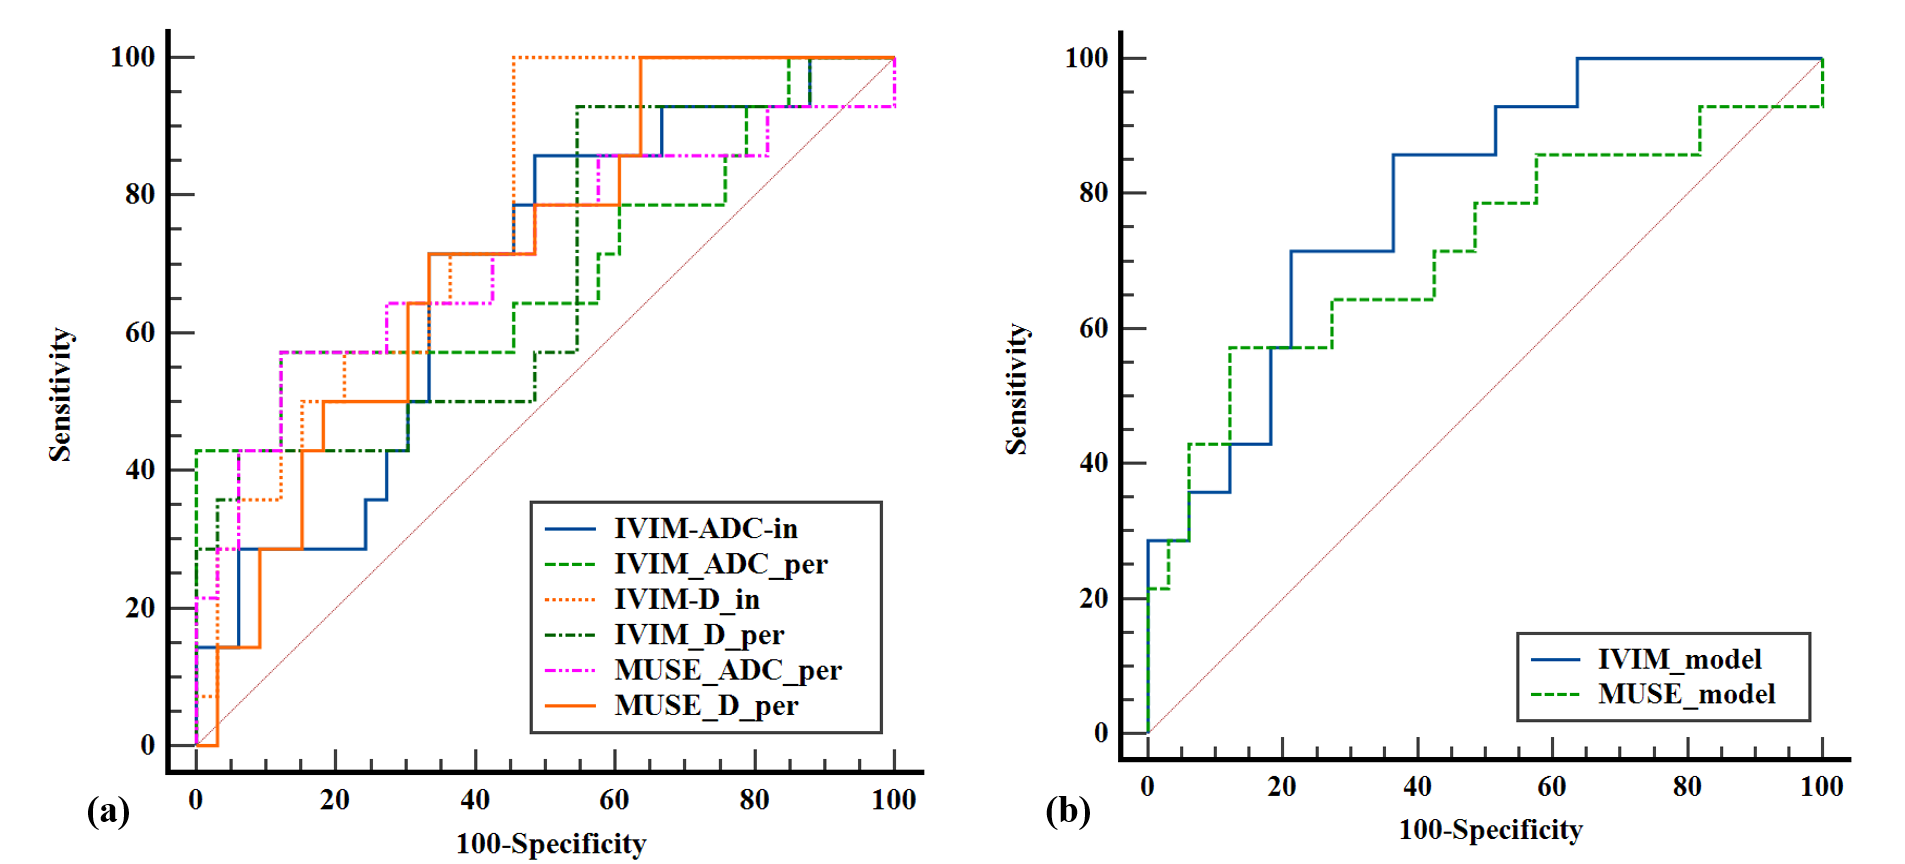
The amount of breast cancer patients was 47 with positive pathologic results were included in our study. The values of IVIM-ADC-in, IVIM-ADC-per, IVIM-Dt-in, IVIM-Dt-per, MUSE-ADC-per and MUSE-Dt-per in the HER-2 positive group were higher than those in the negative group, while values of MUSE-Dp-per were lower than those in the negative group, with statistical significance (P< 0. 05).The combination of MUSE-ADC-per, MUSE-Dt-per and MUSE-Dp-per had an AUC of 0.794 (P=0. 002), while the combination of IVIM-ADC-in, IVIM-Dt-in, IVIM-Dt-per and IVIM-ADC-per had an AUC of 0.797(P=0.001). The SNR of MUSE was higher than that of IVIM b was equal to 0 and 800 s/mm2(P=0.097, P=0.472).Discussion
According to our analysis, the reason why the efficacy of IVIM model was better than that of MUSE-IVIM may be relevant to the sample size, and the IVIM model contained intratumoral information, which made the heterogeneity of breast cancer tumors more prominent possibly. MUSE had an higher SNR than IVIM, which was similar to other studies8. In this study, the scanning time of IVIM was shorter than that of MUSE-IVIM.Conclusion
Statistical difference in the value of IVIM and MUSE-IVIM parameters was found between HER-2 expression in breast carcinoma. This may indicate the potential to provide a surrogate measure of HER-2 expression through noninvasive imaging tools.Acknowledgements
The authors would like to thank Dr. Yuhui Xiong for his contribution.References
- Granzier R W Y, Ibrahim A, Primakov S P, et al. MRI-based radiomics analysis for the pretreatment prediction of pathologic complete tumor response to neoadjuvant systemic therapy in breast cancer patients: a multicenter study[J]. Cancers, 2021, 13(10): 2447.
- Ma W, Zhao Y, Ji Y, et al. Breast cancer molecular subtype prediction by mammographic radiomic features[J]. Academic radiology, 2019, 26(2): 196-201.
- Bitencourt A G V, Gibbs P, Saccarelli C R, et al. MRI-based machine learning radiomics can predict HER2 expression level and pathologic response after neoadjuvant therapy in HER2 overexpressing breast cancer[J]. Ebio Medicine, 2020, 61.
- Xu Q, Chen S, Hu Y, et al. Landscape of immune microenvironment under immune cell infiltration pattern in breast cancer[J]. Frontiers in immunology, 2021, 12: 711433.
- Kang H S, Kim J Y, Kim J J, et al. Diffusion kurtosis MR imaging of invasive breast cancer: correlations with prognostic factors and molecular subtypes[J]. Journal of Magnetic Resonance Imaging, 2022, 56(1): 110-120.
- Chen N, Guidon A, Chang H C, et al. A robust multi-shot scan strategy for high-resolution diffusion weighted MRI enabled by multiplexed sensitivity-encoding (MUSE)[J]. Neuroimage, 2013, 72: 41-47.
- Wolff A C, Hammond M E H, Hicks D G, et al. Recommendations for human epidermal growth factor receptor 2 testing in breast cancer: American Society of Clinical Oncology/College of American Pathologists clinical practice guideline update[J]. Archives of Pathology and Laboratory Medicine, 2014, 138(2): 241-256.
- Daimiel Naranjo I, Lo Gullo R, Morris E A, et al. High-spatial-resolution multishot multiplexed sensitivity-encoding diffusion-weighted imaging for improved quality of breast images and differentiation of breast lesions: a feasibility study[J]. Radiology: Imaging Cancer, 2020, 2(3): e190076.
- Kim Y Y, Kim M J, Gho S M, et al. Comparison of multiplexed sensitivity encoding and single-shot echo-planar imaging for diffusion-weighted imaging of the liver[J]. European Journal of Radiology, 2020, 132: 109292.
Figures
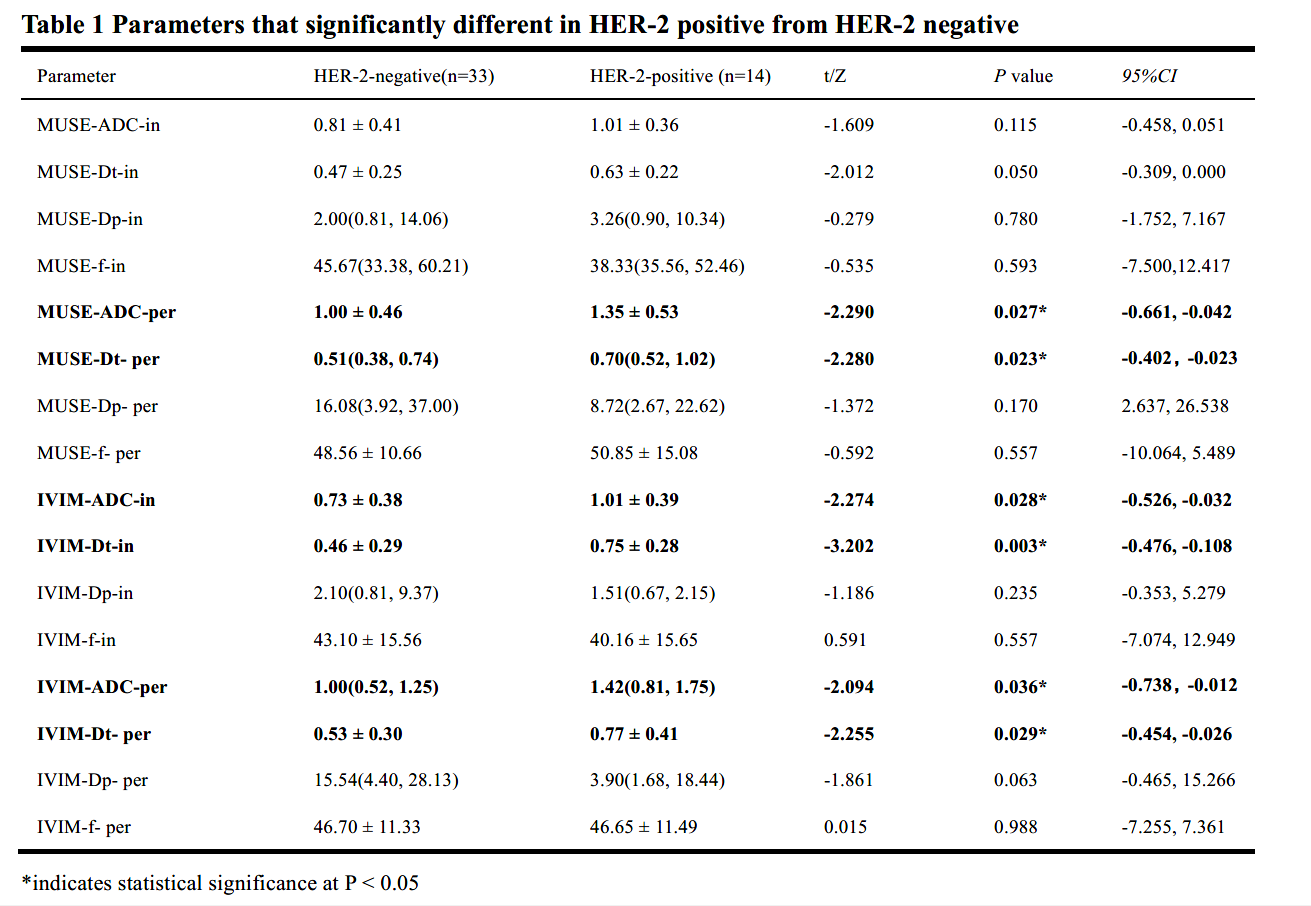
Table 1 Parameters that significantly different in HER-2 positive from HER-2 negative
*indicates statistical significance at P < 0.05
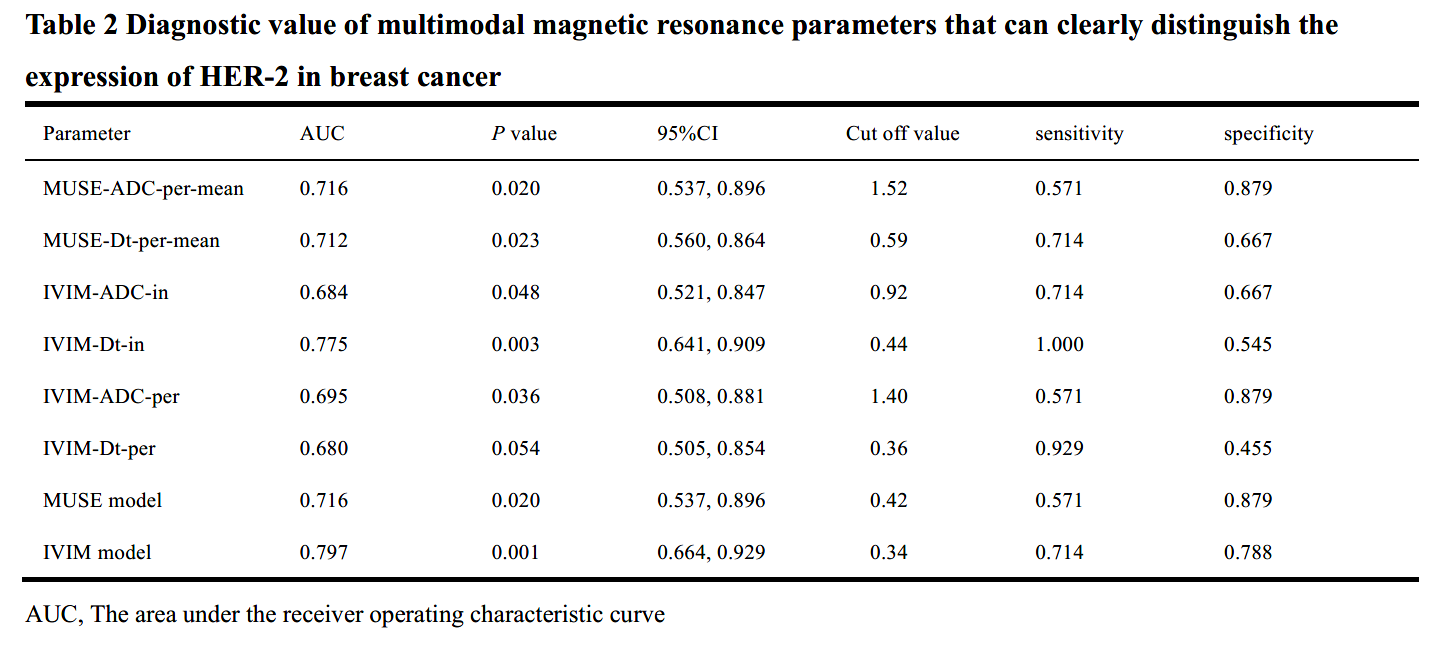
Table 2 Diagnostic value of multimodal magnetic resonance parameters that can clearly distinguish the expression of HER-2 in breast cancer
AUC, The area under the receiver operating characteristic curve
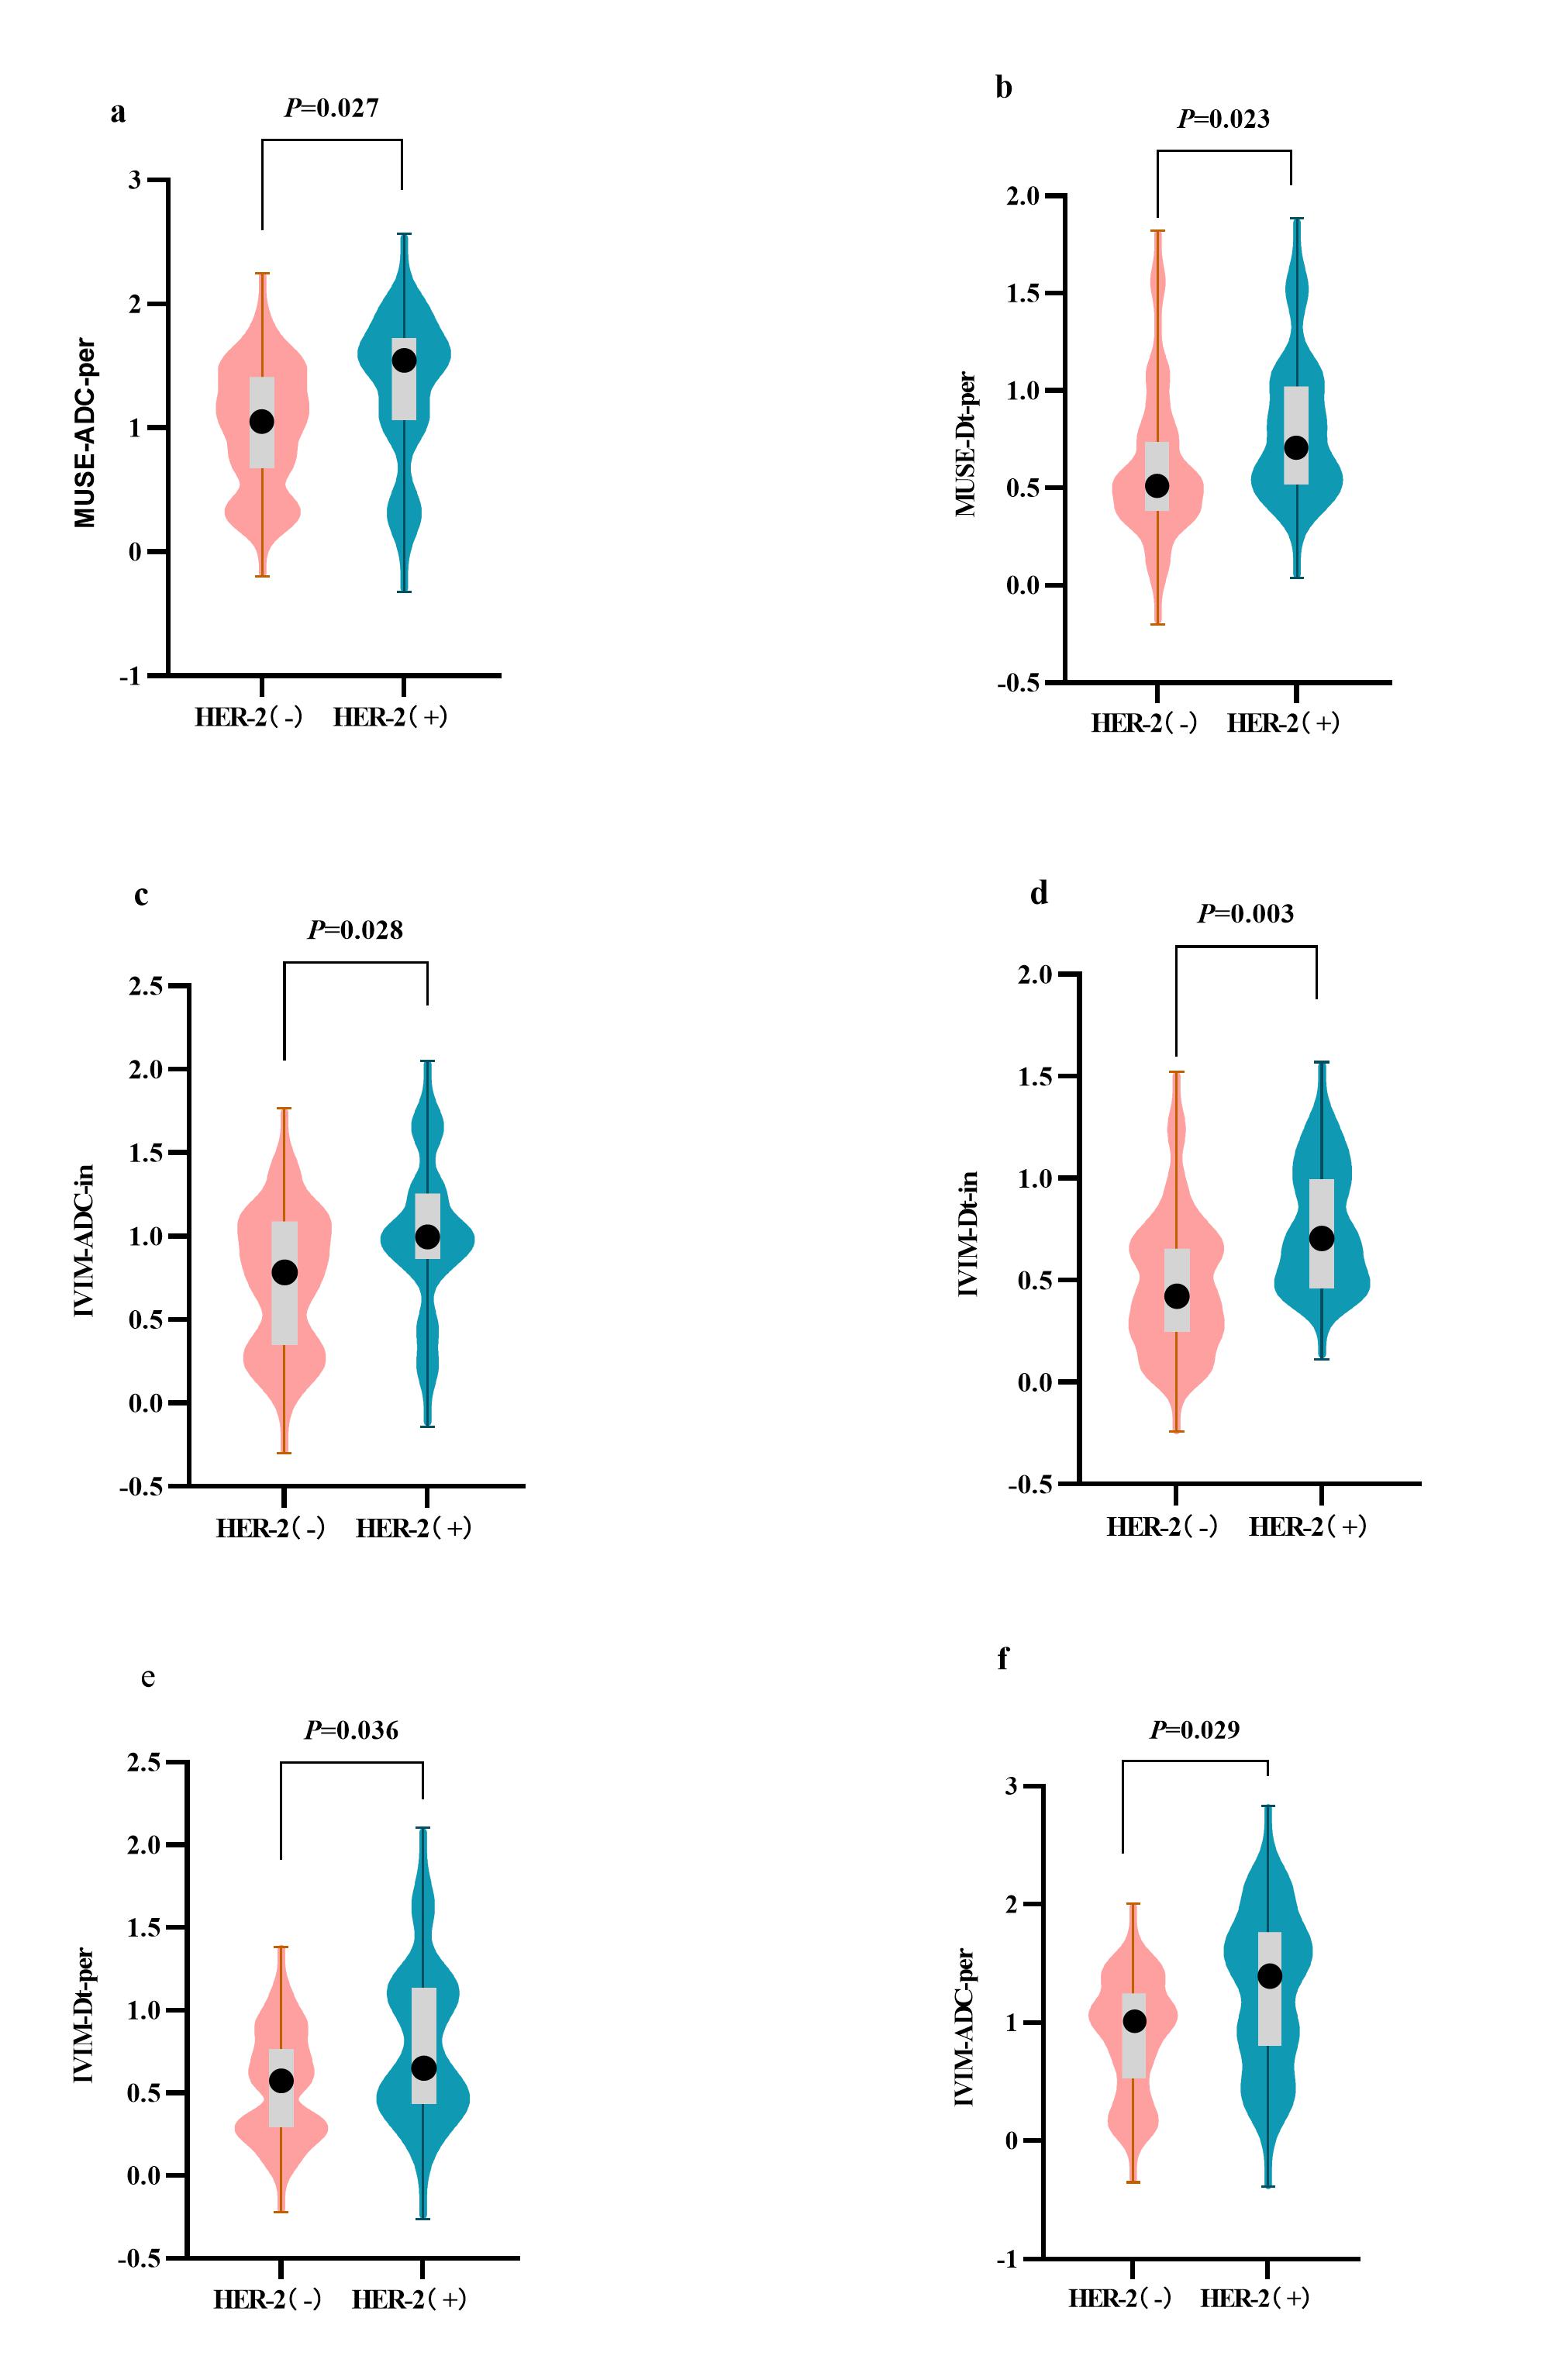
Figure 1. Violin plot of the comparison of parameters
(a) MUSE-ADC-Per, (b) MUSE-Dt-Per, (c) IVIM-ADC-in,(d) IVIM-Dt-in, (e) IVIM-Dt-Per and (f) IVIM-ADC-per.There were significant differences in these features between HER(-) and HER(+) in the breast cancer (P < 0.05). The width of the violin plot represents the probability density. The box plots represent the Q3, median, Q1 (the top line, black dot, and bottom line of the box, respectively), maximum and minimum values(the highest and lowest points of a line segment).