4312
Automated Apparent Diffusion Coefficient Calculation Using Multimodal Image Registration for Prediction of Breast Cancer Treatment Response1University of California, San Francisco, San Francisco, CA, United States, 2University of Michigan, Ann Arbor, MI, United States, 3University of Minnesota, Minneapolis, MN, United States, 4University of Washington, Seattle, WA, United States
Synopsis
Keywords: Breast, Breast, Cancer, Image Registration, Treatment Response
Motivation: Tumor delineation is a challenging but critical step for ADC calculation in Diffusion-weighted (DW) MRI. Automated delineation methods are still underdeveloped for DW-MRI.
Goal(s): To compare the predictive performance of manual vs. automated ADC values at multiple timepoints during neoadjuvant treatment.
Approach: We used MRI data from the ACRIN 6698 trial for this analysis. Automated ADC values were computed using transformed ROIs from image registration between pre-contrast DCE and DWI (b=0).
Results: Predictive performance improved with automated ADC values at 3-week timepoint and remained similar at 12-week and pre-surgery timepoints.
Impact: This work offers a practical approach for automated ADC calculation, allowing radiologists to expedite clinical decisions for breast cancer patients at early treatment timepoints; therefore, improving patient care.
Background
MRI is an accurate tool for breast cancer diagnosis and therapy assessment, with a growing interest in contrast-free breast diffusion-weighted imaging (DWI). DWI measures tissue water mobility and calculates the apparent diffusion coefficient (ADC) from various b-values. Accurate ADC calculation relies on precise region-of-interest (ROI) delineation, impacting diagnostics and prediction. Manual delineation is time-consuming and subject to intra- and inter-reader variation. Automated delineation gains popularity in breast cancer but facing challenges.A previous study showed that automated ADC calculations using image registration to align dynamic contrast enhanced (DCE) and DWI images improved the predictive value for pathologic complete response (pCR) over ADC values derived from manually delineated ROIs (1). The prior study focused only on early treatment ADC measures, when tumors tend to be larger and more distinct. This study’s goal is to further evaluate the predictive performance of automated ADC values calculated at all treatment timepoints using multi-center MRI data from the ACRIN 6698 trial (2).
Methods
The patient cohort for this study was from the multi-center trial, ACRIN 6698 (ClinicalTrials.gov: NCT01564368) (3).Image registration, implemented in IDL using the Elastix toolkit (4), involved two steps. Initially, rigid transformations aligned features in the b=0 DWI and pre-contrast DCE images, with only ipsi-lateral images considered. Subsequently, B-spline transformations fine-tuned the alignment. The combined transformation, including both rigid and B-spline transformations, was applied to the ROIs of functional tumor volume (FTV) segmentation. These transformed ROIs were used for automated ADC calculations to predict pCR. FTV segmentation ROIs were generated semi-automatically from DCE images following standardized protocols (5), as previously explained (6).
In ACRIN 6698, patients had MRI exams at pre-treatment (T0), 3 weeks (T1), 12 weeks (T2), and post-treatment (T3) that included DCE and DWI. ΔADC, the percentage change in tumor ADC compared to T0, was calculated. ADC mean values were extracted from manual and transformed ROIs. To predict pCR, AUC from logistic regression models for ΔADC in both ROI types was assessed. AUCs were compared via 1000-replicate bootstrapping with a two-sided test. Differences in MRI variables between pCR and non-pCR groups were evaluated using p-values from the Wilcoxon rank sum test. Statistical analyses used Python, with a significance level of 𝛼 = 0.05.
Results
Of the 242 participants comprising the analysis set, 227 had evaluable imaging studies at T1, 210 at T2 and 186 at T3.The median of manual mean tumor ADCs (x 10^-3 mm²/s) were 1.12 [0.98-1.27], 1.25 [1.10-1.44], 1.46 [1.18-1.77] and 1.55 [1.30-1.87] at T0, T1, T2 and T3 timepoints, respectively. Automated mean tumor ADCs (x 10^-3 mm²/s) were 1.42 [1.21-1.67], 1.41 [1.22-1.63], 1.40 [1.05-1.69], and 1.32 [1.05-1.63] at T0, T1, T2 and T3 timepoints, respectively.
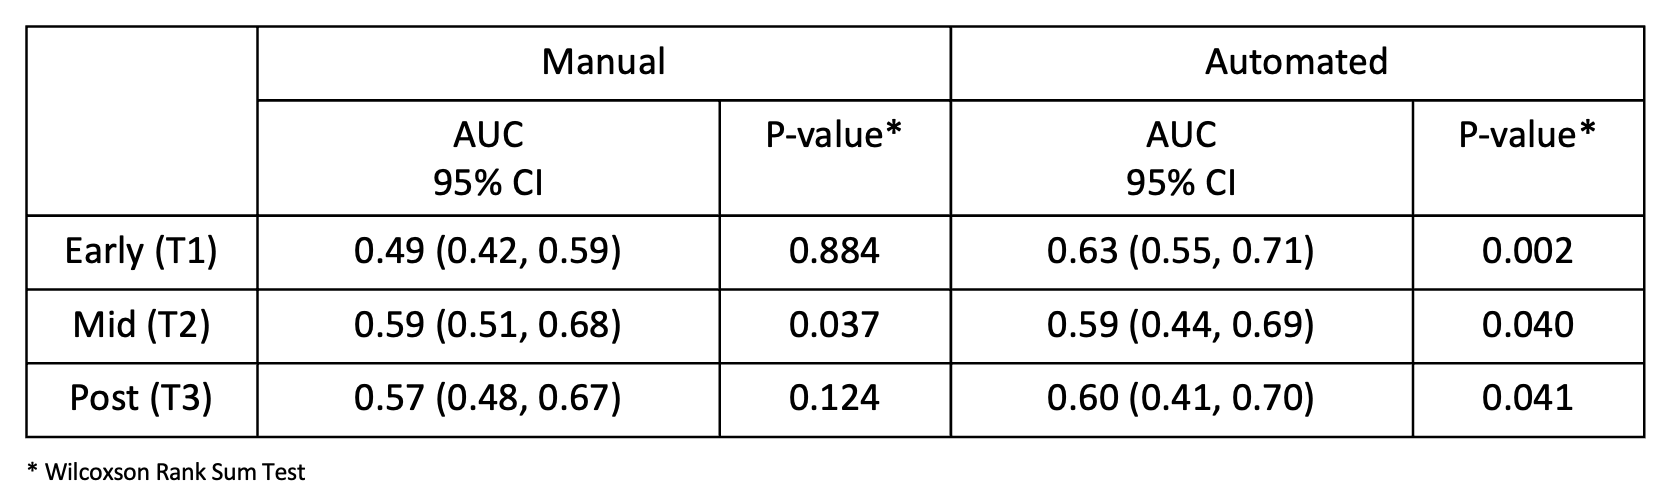
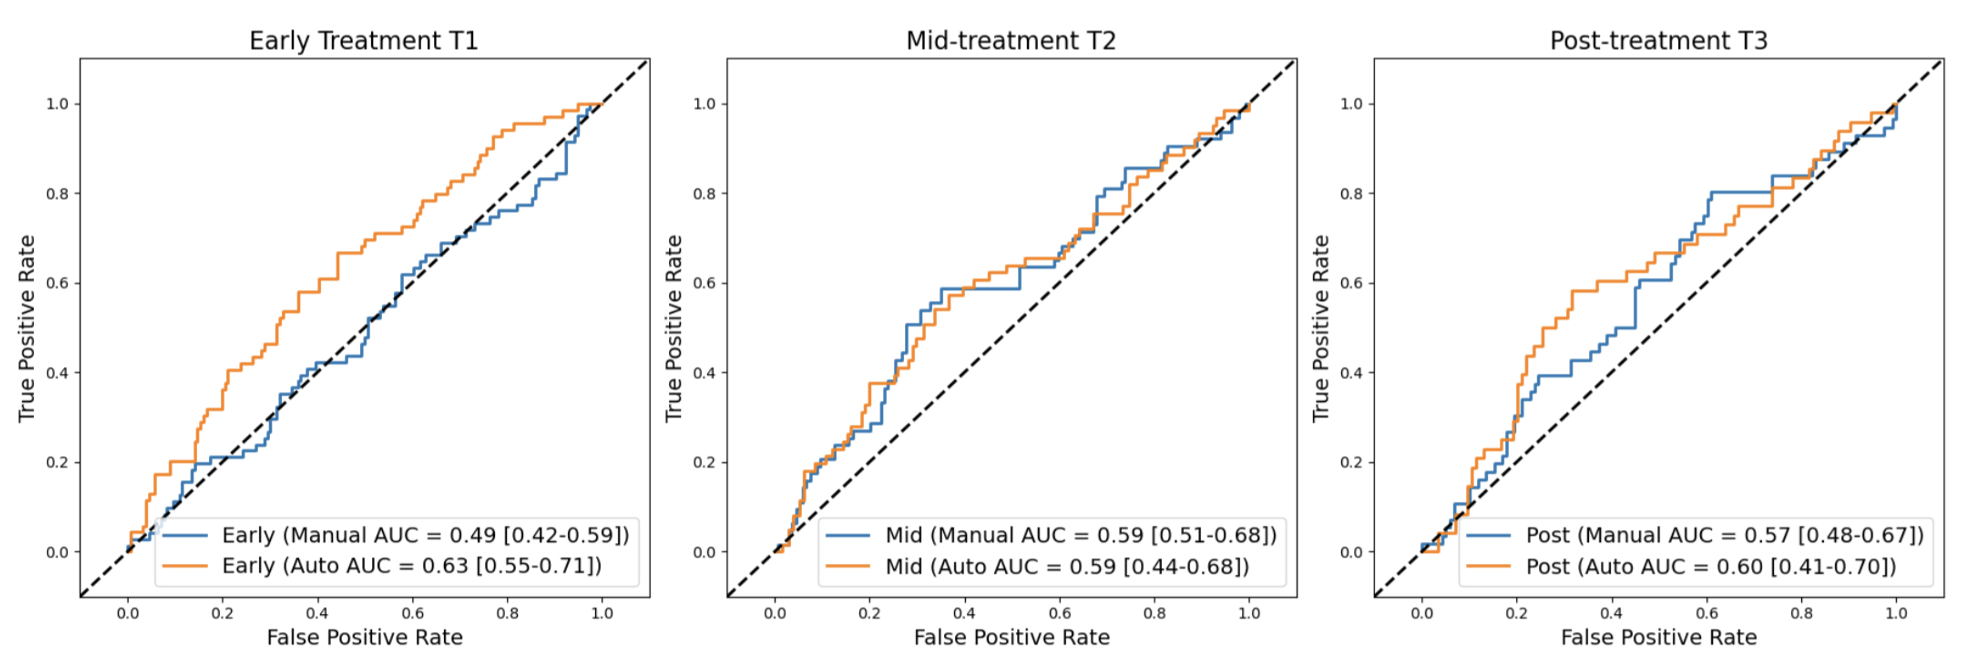
Table 1 summarizes the AUC values of pCR prediction. At T1, manual mean ΔADC was not predictive of pCR (AUC = 0.49; 95% CI: [0.42, 0.59]; p=0.88) but automated mean ΔADC based on the transformed ROI was found to be predictive (AUC = 0.63; 95% CI: [0.55, 0.71]; p= 0.002). By T2, manual mean ΔADC achieved AUC of 0.59 (95% CI: [0.51, 0.68]; p=0.037) and automated mean ΔADC achieved AUC = 0.59 (95% CI: [0.44, 0.69]; P = 0.040), respectively. Manual mean ΔADC at T3 has AUC of 0.57 (95% CI: [0.48, 0.67], p = 0.12) while automated mean ΔADC has AUC of 0.60 (95% CI: [0.41, 0.70], p = 0.041). AUC values were overall close between the two methods at T2 and T3. ROC curves for pCR prediction from ∆ADC at T1, T2, T3 are shown in Figure 1.
Discussion
In this study, automated ADC values were computed using transformed ROIs from image registration between pre-contrast DCE and DWI (b=0). Changes in these values at T1, T2, and T3 were used to predict pCR. Predictive performance improved with automated ADC values at T1 and remained similar at T2 and T3. Limitations include image quality variations affecting registration accuracy and potential segmentation issues due to different b-values. FTV segmentation quality can impact predictive performance, especially when poorly segmented FTV ROIs are transformed onto the ADC map. Future work will build a predictive model incorporating automated ADC, tumor subtype, and FTV to enhance pCR prediction.Conclusion
In conclusion, we automated ADC calculation using image registration from pre-contrast DCE and b=0 DWI MRI data, providing a practical solution. Results indicate improved enhanced pCR prediction over manual method at early treatment timepoint.Acknowledgements
NIH/NCI U01 CA225427, P01 CA210961, R01 CA255442, R01 CA190299References
1. Nu N Le, David C Newitt, Wen Li, Deep Hathi, Jiachao Liang, Lisa J Wilmes, et al. Automated breast tumor segmentation in DWI using multi-modality image registration: a feasibility study using multi-center data. In: ISMRM [Internet]. Public Library of Science; 2023 [cited 2023 Nov 6]. Available from: https://submissions.mirasmart.com/ISMRM2023/Itinerary/Files/PDFFiles/ViewAbstract.aspx
2. Partridge SC, Zhang Z, Newitt DC, Gibbs JE, Chenevert TL, Rosen MA, et al. Diffusion-weighted MRI Findings Predict Pathologic Response in Neoadjuvant Treatment of Breast Cancer: The ACRIN 6698 Multicenter Trial. Radiology. 2018 Dec;289(3):618–27.
3. Study Details | DWI in Assessing Treatment Response in Patients With Breast Cancer Receiving Neoadjuvant Chemotherapy | ClinicalTrials.gov [Internet]. [cited 2023 Nov 6]. Available from: https://clinicaltrials.gov/study/NCT01564368
4. Klein S, Staring M, Murphy K, Viergever MA, Pluim JPW. Elastix: a toolbox for intensity-based medical image registration. IEEE Trans Med Imaging. 2009;29(1):196–205.
5. Newitt DC, Aliu SO, Witcomb N, Sela G, Kornak J, Esserman L, et al. Real-time measurement of functional tumor volume by MRI to assess treatment response in breast cancer neoadjuvant clinical trials: validation of the aegis SER software platform. Transl Oncol. 2014;7(1):94–100.
6. Hylton NM. Vascularity assessment of breast lesions with gadolinium-enhanced MR imaging. Magn Reson Imaging Clin N Am. 1999;7(2):411–20.
Figures