4308
Vasculature Assessment of Rhesus Macaque Placental Injury using Variable Flip Angle T1-Mapping and Dynamic Contrast Enhanced MRI1Medical Physics, University of Wisconsin - Madison, Madison, WI, United States, 2Wisconsin National Primate Research Center, University of Wisconsin - Madison, Madison, WI, United States, 3Obstetrics & Gynecology, University of Wisconsin - Madison, Madison, WI, United States, 4Radiology, University of Wisconsin - Madison, Madison, WI, United States, 5Comparative Biosciences, University of Wisconsin - Madison, Madison, WI, United States
Synopsis
Keywords: Placenta, Placenta
Motivation: A combination of DCE and fractional blood volume analysis could enable better evaluation of local placental injury.
Goal(s): To generate and assess local placental injury for rhesus macaques using Tisseel (fibrin sealant) injections and co-registered contrast arrival time maps and fractional blood volume maps.
Approach: Three rhesus macaques received intraplacental injections of Tisseel to potentially cause tissue ischemia. DCE imaging and variable flip angle T1 mapping were registered and compared qualitatively and quantitatively on a local level.
Results: Possible local placental ischemia observed in both the DCE signal and the blood volume maps. Lower circulating blood volume corresponded regionally to longer arrival times.
Impact: This study successfully creates local placental ischemia that potentially mimics clinical cases seen with fetal growth restriction. The local ischemia could be better visualized using two co-registered MRI methods, thus helping future clinical diagnosis.
Introduction
Proper development of maternal placental vasculature during pregnancy plays a crucial role in a successful gestational outcome1–3, but lacks adequate tools for assessment in the clinic. Ferumoxytol is an FDA-approved iron supplement used off-label as an MRI contrast agent and has been shown to provide useful depiction of maternal placental architecture and structure in the diagnosis of placenta accreta spectrum4–6. Preclinical ferumoxytol studies have demonstrated the feasibility of dynamic contrast enhanced (DCE) MRI7–9 to measure placental blood flow, and maternal placenta blood volume measurements via variable flip angle (VFA) T1 mapping10,11. Here we introduce a modified preclinical model to generate local placental ischemia in the rhesus macaque and use this model to compare co-registered ferumoxytol contrast arrival time maps and blood volume maps.Methods
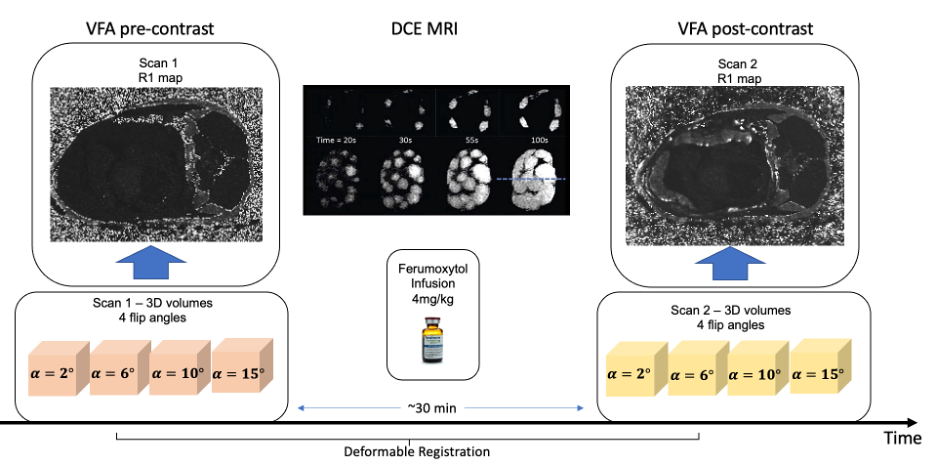
Subjects: At around gestation day 100, three rhesus macaque subjects received Tisseel (Baxter Healthcare Corp) injections in the anterior placental disc under ultrasound guidance. Tisseel is an FDA-approved fibrin sealant that could induce local placental thrombosis, ischemia, and infarction (necrosis). One subject received a single dose of 0.5ml, whereas the other two received total of three doses in multiple separate locations on the lobe. All animals received MRI exam at gestation days ~145.Imaging: All scans were performed on a 3.0T system (GE Healthcare) with a 32-channel phase array coil. The subjects were sedated with isoflurane and imaged in right-lateral position. Ferumoxytol contrast agent (4mg/kg) was intravenously infused during DCE imaging. Figure 1 shows the imaging workflow.
DCE Imaging and Processing8,9: A T1-weighted spoiled gradient echo product sequence (DISCO, TR=4.8ms, TE=1.8ms, spatial resolution=0.86x0.86x1.00mm3, temporal resolution=4.5~7.7s, number of timeframes=40) was used. Semi-manual segmentation (ITK-SNAP12) was performed on the last timepoint of DCE sequence. The arrival time maps were obtained by fitting pixel-wise DCE signal to a sigmoid model and finding the inflection point7.
VFA Imaging and Processing10,13: A 3D radial spoiled gradient echo sequence (TR=6.0ms, TE=1.2ms, scan time=525.9s, spatial resolution=0.87×0.87×1.00mm3) was performed at four different flip angles (2°, 6°, 10°, 15°) before and 30 minutes after ferumoxytol infusion. Pixel-wise signal intensity of each flip angle datapoint was fitted via monoexponential fit to obtain pre- and post-contrast R1 maps. Maternal fractional blood volume (FBV) was calculated as the ratio between ΔR1 (difference between pre- and post-contrast R1 maps) in the placenta and ΔR1 in maternal blood.
Data Analysis: Registration between the 15° flip angle T1 anatomical image (moving) and time-averaged DCE image (fixed) were accomplished using deformable registration (ANTS14). The same placental mask was applied to the averaged DCE signal, blood volume maps, and the arrival time maps for pixel-wise comparison.
Results
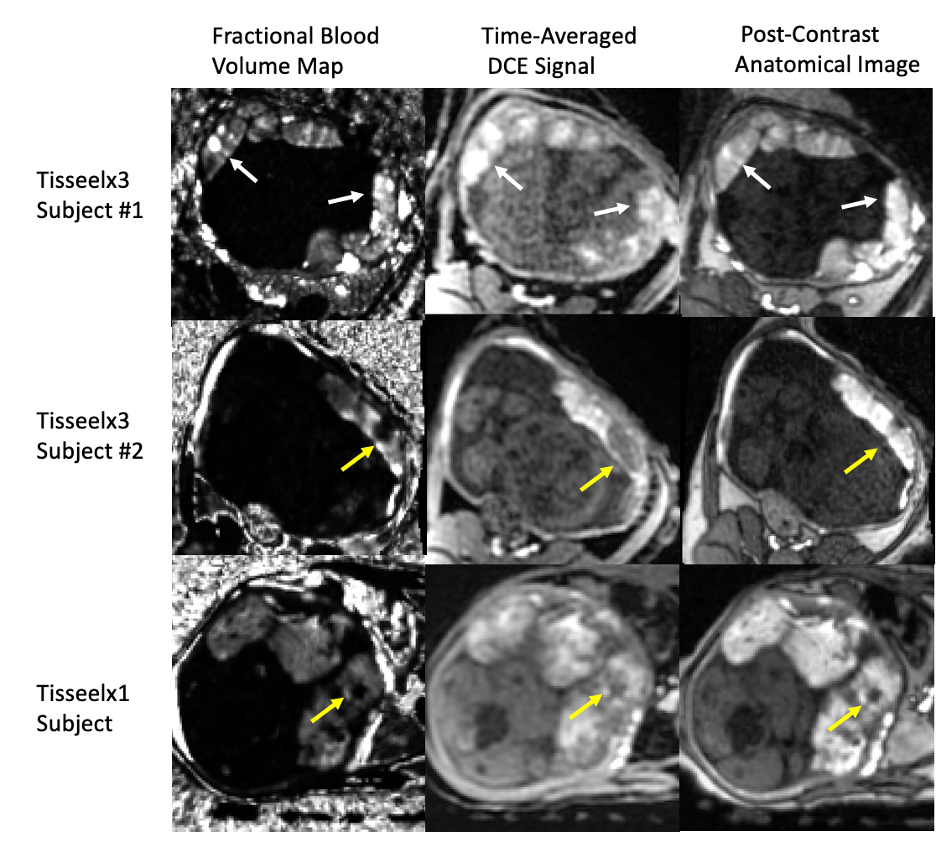
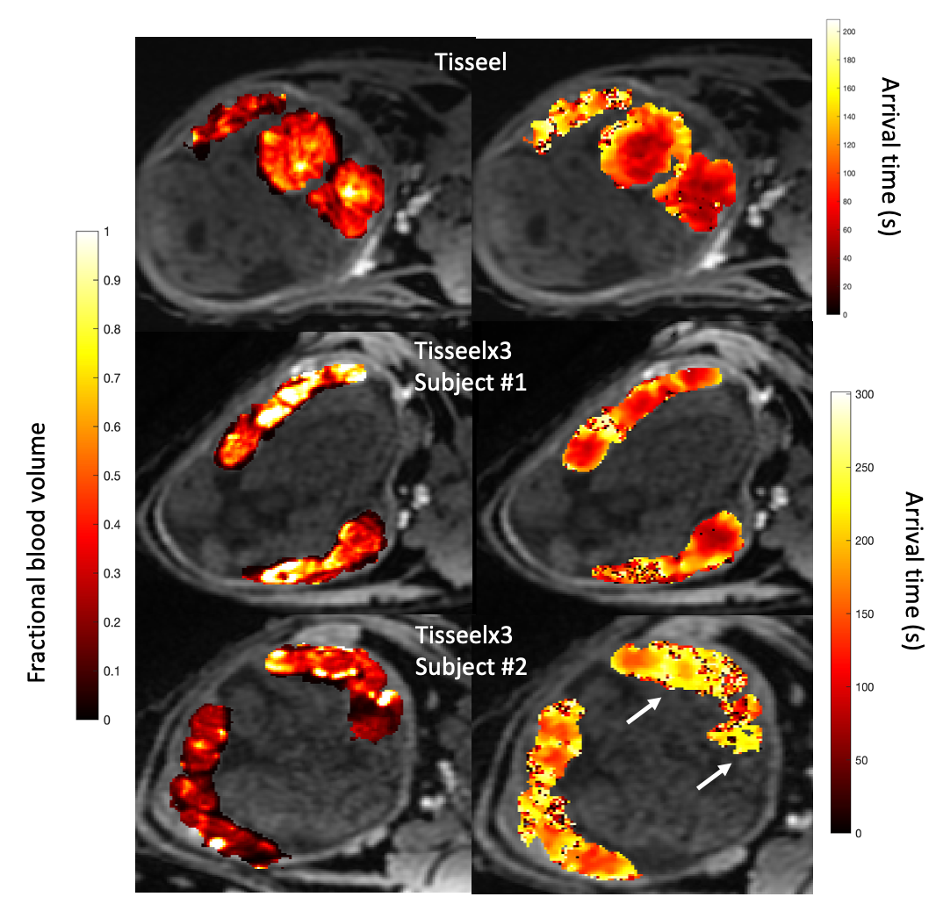
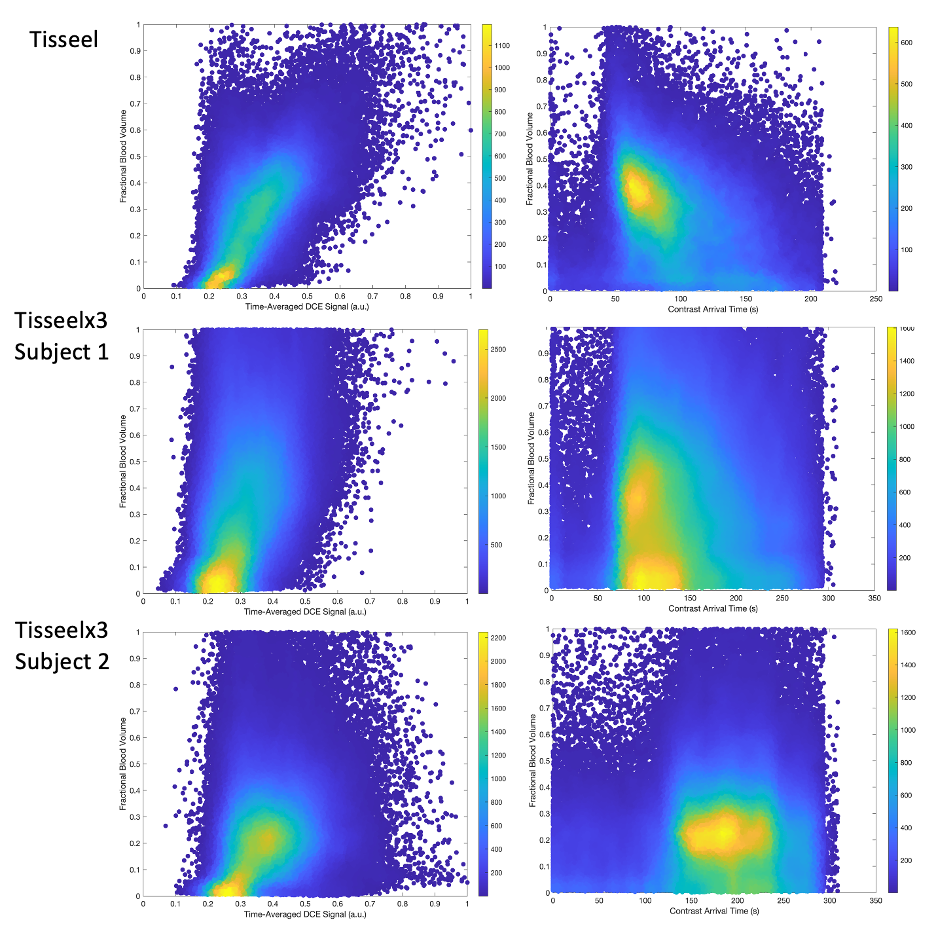
For all three subjects, figure 2 shows co-registered Fractional blood volume maps (left column), time-averaged dynamic contrast enhanced (DCE) signal (middle column), and T1-weighted post-contrast anatomical images (right column) used for blood volume calculation. White arrows show areas of enhanced signal, whereas the yellow arrows show lower image signal and lower blood volume, suggesting tissue hypoperfusion. Figure 3 shows heat maps of fractional blood volume (left column) and contrast arrival time maps (right column) of the three subjects. Generally, regions of high blood volumes correspond to regions of short arrival time. The Tisseelx3 subject #2 has lower blood volume in the slice shown, and the corresponding arrival times are longer. Tisseelx3 subjects have longer arrival times than the Tisselx1 subject. Figure 4 shows density maps of pixel-wise locally corresponding fractional blood volume (FBV) vs. normalized time-averaged DCE signal (left column) and vs. contrast arrival time (right column). The scale bar on the right shows the density of the scatter plots. There is a generally positive correlation between FBV and the DCE signal; two subjects show a negative trend between FBV and arrival time.Discussion and Conclusion
This study assesses local placental injury of Tisseel-treated rhesus macaques by co-registering averaged DCE images and fractional blood volume maps. We observe local correlations between the DCE signal and blood volume in regions with hypoperfusion, which could be ischemia seen through histopathological analysis done previously15. Local increases in contrast arrival time areas also corresponded with lower blood volume, increasing confidence in both methods. Globally across all pixels, this trend was reflected in FBV vs. DCE plots but not as strongly in the arrival time vs. DCE plots. This could be because for some Tisseel-injected regions without ischemia, the arrival time can be substantially prolonged due to impeded flow, but the contrast may eventually be present at the time of post-contrast imaging for the FBV calculation, resulting in unaffected FBV measurement. Future studies will include similar analysis and comparison with the control subjects.Acknowledgements
We gratefully acknowledge GE Healthcare for research support of UW-Madison, and AMAG Pharmaceuticals for providing ferumoxytol used in our imaging procedures. We also thank the Wisconsin National Primate Research Center (WNPRC) Veterinary, Scientific Protocol Implementation, and Animal Services staff for providing animal care, and assisting in procedures including breeding, pregnancy monitoring, and sample collection. Grant support: R01HD103443 and #T32 HD1013840.References
1. Brosens I, Puttemans P, Benagiano G. Placental bed research: I. The placental bed: from spiral arteries remodeling to the great obstetrical syndromes. Am J Obstet Gynecol. 2019;221(5):437-456. doi:10.1016/j.ajog.2019.05.044
2. Qu H, Khalil RA. Vascular mechanisms and molecular targets in hypertensive pregnancy and preeclampsia. Am J Physiol Heart Circ Physiol. 2020;319(3):H661-H681. doi:10.1152/ajpheart.00202.2020
3. Aplin JD, Myers JE, Timms K, Westwood M. Tracking placental development in health and disease. Nat Rev Endocrinol. 2020;16(9):479-494. doi:10.1038/s41574-020-0372-6
4. Kliewer MA, Bockoven CG, Reeder SB, Bagley AR, Fritsch MK. Ferumoxytol-enhanced magnetic resonance imaging with volume rendering: A new approach for the depiction of internal placental structure in vivo. Placenta. 2023;131:104-110. doi:10.1016/j.placenta.2022.12.001
5. Kliewer MA, Bagley AR, Reeder SB, Iruretagoyena JI, Bockoven CG, Fritsch MK. Normal placental structural anatomy: ultrasound and doppler features elucidated with US-MR image fusion and ferumoxytol-enhanced MRI. Abdom Radiol (NY). 2023;48(2):744-751. doi:10.1007/s00261-022-03758-0
6. Kliewer MA, Bockoven CG, Reeder SB, et al. Ferumoxytol-enhanced MR demonstration of changes to internal placental structure in placenta accreta spectrum: Preliminary findings. Placenta. 2023;134:1-8. doi:10.1016/j.placenta.2023.02.003
7. Ludwig KD, Fain SB, Nguyen SM, et al. Perfusion of the placenta assessed using arterial spin labeling and ferumoxytol dynamic contrast enhanced magnetic resonance imaging in the rhesus macaque. Magn Reson Med. 2019;81(3):1964-1978. doi:10.1002/mrm.27548
8. Seiter DP, Nguyen SM, Morgan TK, et al. Ferumoxytol Dynamic Contrast Enhanced Magnetic Resonance Imaging Identifies Altered Placental Cotyledon Perfusion in Rhesus Macaques. Biol Reprod. Published online August 26, 2022. doi:10.1093/biolre/ioac168
9. Frias AE, Schabel MC, Roberts VHJ, et al. Using dynamic contrast-enhanced MRI to quantitatively characterize maternal vascular organization in the primate placenta. Magn Reson Med. 2015;73(4):1570-1578. doi:10.1002/mrm.25264
10. Chen R, Nguyen S, Murphy M, et al. Longitudinal Placental Blood Volume Measurements on Zika-Infected Rhesus Macaques Using Variable Flip Angle T1 Mapping. In: Proc 29th Annual Meeting ISMRM. ; 2021.
11. Badachhape AA, Devkota L, Stupin I v, et al. Nanoparticle Contrast-enhanced T1-Mapping Enables Estimation of Placental Fractional Blood Volume in a Pregnant Mouse Model. Sci Rep. 2019;9(1):18707. doi:10.1038/s41598-019-55019-8
12. ushkevich PA, Piven J, Hazlett HC, et al. User-guided 3D active contour segmentation of anatomical structures: significantly improved efficiency and reliability. Neuroimage. 2006;31(3):1116-1128. doi:10.1016/j.neuroimage.2006.01.015
13. Chen R, Fain S, Magness R, et al. Maternal Blood Volume Measurements of Human Placenta with Fetal Growth Restriction using Ferumoxytol-Enhanced MRI. In: Proc 30th Annual Meeting ISMRM. ; 2022.
14. Avants BB, Tustison NJ, Stauffer M, Song G, Wu B, Gee JC. The Insight ToolKit image registration framework. Front Neuroinform. 2014;8:44. doi:10.3389/fninf.2014.00044
15. Chen R, Keding L, Vazquez J, et al. Vascular Assessment of Rhesus Macaque Placental Injury through Maternal Intervillous Blood Volume Measurement. In: Proc 31st Annual Meeting ISMRM (2023).
Figures