4306
Repeatability of Cervix Restriction Spectrum Imaging Outputs in Healthy Cervix1Radiology, University of California, San Diego, San Diego, CA, United States, 2Bioengineering, University of California, San Diego, San Diego, CA, United States
Synopsis
Keywords: Pelvis, Pelvis, Cervix RSI Repeatability
Motivation: The American College of Radiology advocates the integration of DW-MRI in the assessment and post-treatment monitoring of cervical cancer. Restriction Spectrum Imaging (RSI) is an advanced diffusion model which has the potential to separate active malignancy from post treatment changes.
Goal(s): Investigate the repeatability of cervix-specific RSI outputs (C1, C2, C3) in healthy cervix.
Approach: Performed ‘test’ and ‘retest’ scans of a multi-shell diffusion sequence on nine subjects. Intraclass correlation coefficients (ICC) were calculated for each C-compartment.
Results: C1 showed poor agreement, while C2 and C3 showed high agreement.
Impact: Cervix-specific RSI outputs C2 and C3 showed high agreement, making steps towards repeatable DW-MRI associated biomarkers. Ensuring their repeatability is crucial for their practical application in clinical settings.
INTRODUCTION:
The American College of Radiology advocates the integration of DW-MRI in the assessment and post-treatment monitoring of cervical cancer1. Restriction Spectrum Imaging (RSI) [ref prostate, ref breast] is an advanced diffusion model which has the potential to separate active malignancy from post treatment changes [2], an important part in identifying residual disease in radiation treated cervical cancer. Last year, a cervix-specific RSI (CS-RSI) model was presented [3], and separates signal in 3 diffusion biomarkers (C-compartments C1, C2, C3). Ensuring their repeatability is crucial for their practical application in clinical settings.While research extensively investigates ADC repeatability [4], RSI models repeatability needs to be investigated to strengthen its potential as an extensive tool for cervical cancer assessment. This study aims to characterize the repeatability of RSI outputs in healthy cervical tissue using a test-retest paradigm within a single scan session.
METHODS:
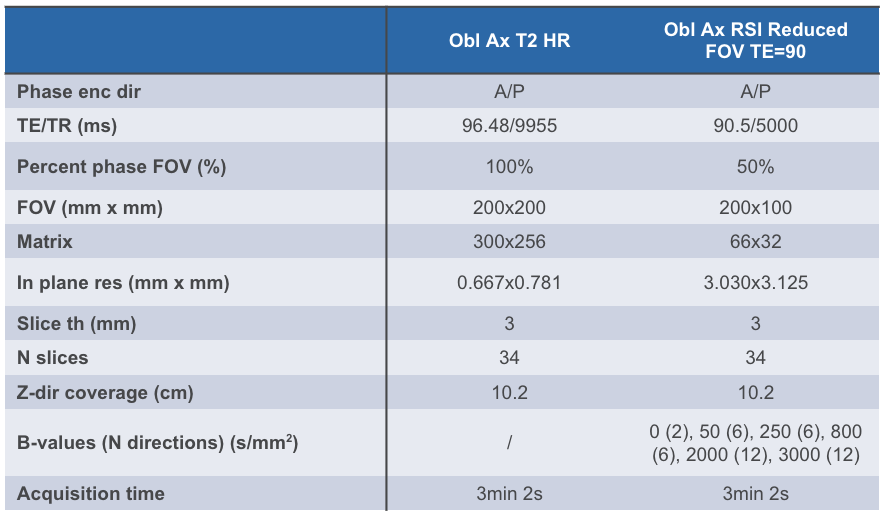
Nine women (44.5 ± 7.8 years old) underwent pelvic MRI on a 3.0T scanner (GE Healthcare, USA) with a 32-channel body surface coil array. A multi-shell diffusion sequence (Table 1) was collected twice during a single scan session: once during the beginning of the scan (the ‘test’ scan) and again toward the end of the scan (the ‘retest’ scan). Before retest scan, subjects were temporarily taken out of the scanner for a five-minute interval. Subsequently, they were positioned back into the scanner to acquire the imaging data for the second iteration.Images were processed using MATLAB (R2022a, MathWorks, USA). Corrections for noise and eddy currents were performed and images were normalized by the 95th percentile of signal intensity value in the b=0 s/mm2 volume.5,6 Pre-processed images were then fitted into the CS-RSI model:
$$S(b) = C_1 + C_{2}e^{-b×2.0×10^{-3}} + C_{3}e^{-b×22.4×10^{-3}}$$
The outputs correspond to restricted (C1), hindered (C2), and free/low (C3) diffusion. Regions of interest (ROIs) were drawn (Osirix, Pixmeo, Switzerland) under the supervision of an expert radiologist on b=0 s/mm2 images on the cervix at both scan timepoints for each subject. ROIs were used to extract the median of each C-compartment for each subject/scan. C-compartment values were normalized by the median signal of urine in the bladder in the corresponding b=0 volume.
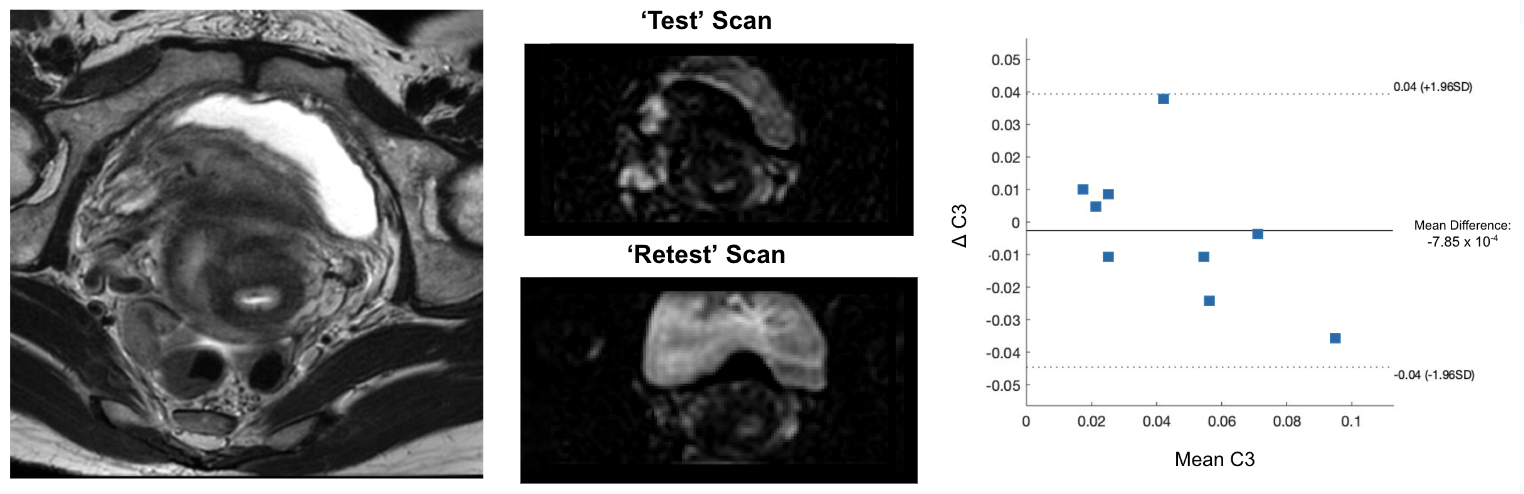
All statistical analyses were performed in R (Rstudio, Boston, USA). The intraclass correlation coefficient (ICC) was computed to assess the variability of the outputs of CS-RSI model between the two timepoints, in accordance with guidelines set forth by the Quantitative Imaging Biomarkers Alliance.7 The ICCs are calculated based on a one-way ANOVA model with subjects as random effects. Bland-Altman plots were also used to assess median C output agreement between the test and retest scans for each C-compartment.
Of note, the average Field-of-View (FOV) absolute shift between test and retest scan in regard to the isocenter of the scanner was also calculated.
RESULTS:
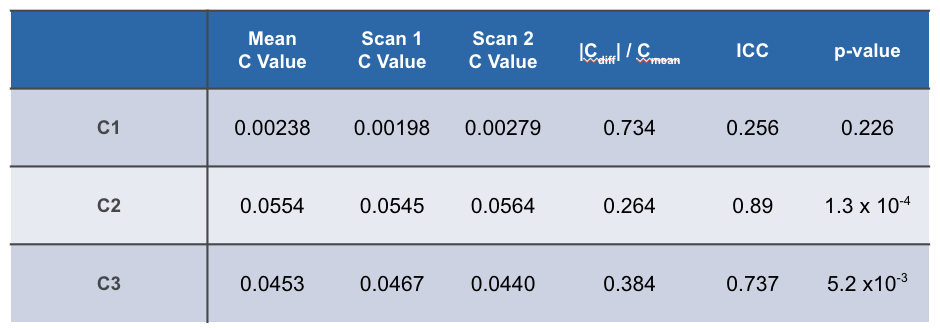
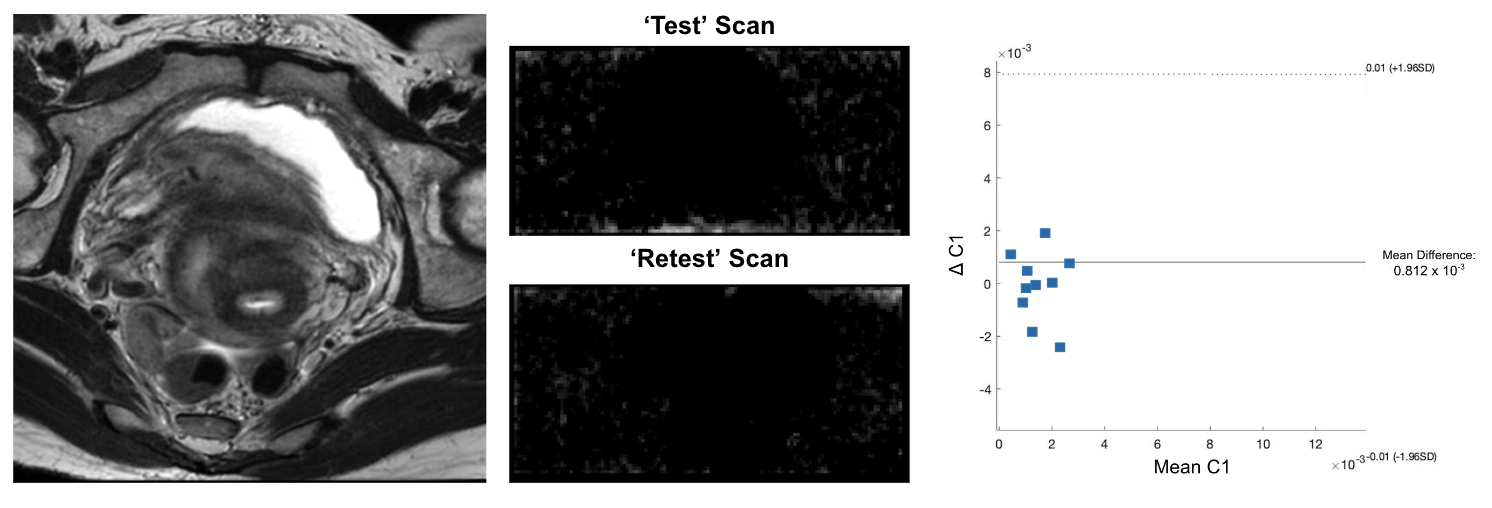
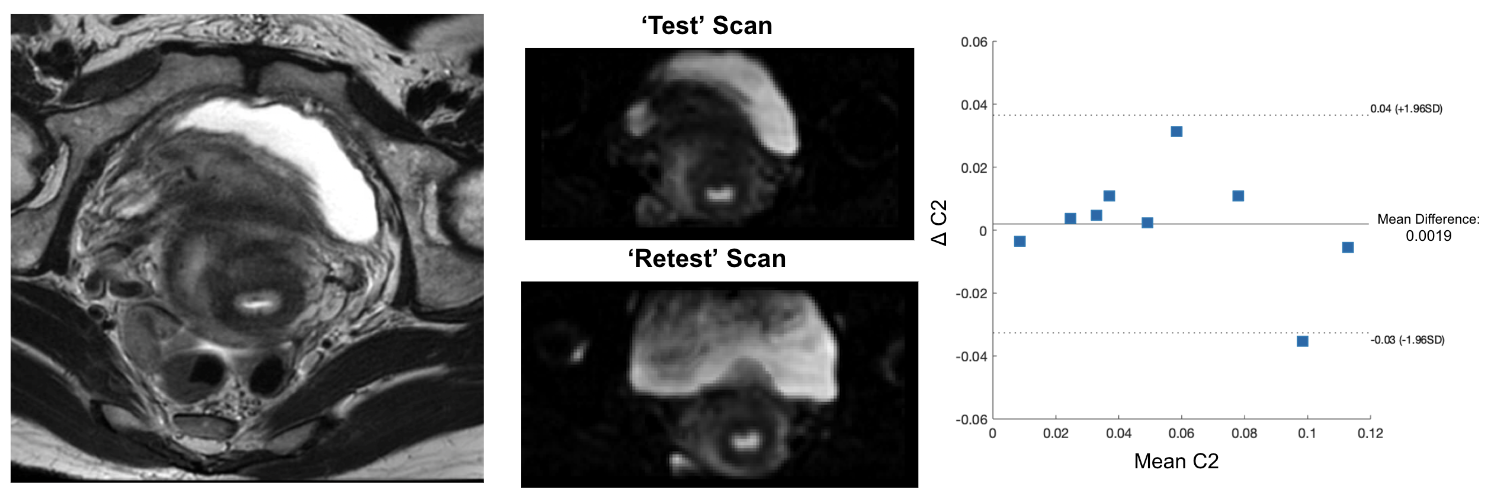
Repeatability metrics are summarized in Table 2. ICC values were 0.256, 0.89 and 0.737 for C1, C2 and C3, respectively. Associated p-values were 0.226, 1.3 x 10⁻⁴, and 5.2 x 10⁻³. Bland-Altman plots and examples of C-maps for each C-compartment are shown in Figure 1-3.The average FOV absolute shift between test and retest scans were 21.8, 9.0, 41.9 (in mm) in each direction (read, phase and slice, respectively).
DISCUSSION & CONCLUSIONS:
In this study, we investigate the repeatability of CS-RSI model outputs in a test-retest paradigm. C2 and C3 had high agreement, while C1 did not. This can be attributed to the intrinsic diffusion characteristics of healthy cervix, which do not yield restricted diffusion. Consequently, C1 values are at the noise range level and the Bland Altman plot for C1 shows the low range of values. (Figure 1). The CS-RSI model appears to be robust, as C2 and C3 Bland Altman data are generally centered around zero (Figure 2-3) as expected in healthy cervical tissue.Of note, C2 and C3 values from the test-retest scans yielded high agreement despite significant shifts in the FOV, especially in the slice direction (41.9 mm) where the z-coverage is 102 mm.
Future work involves collecting more test-retest data for both healthy and cancer patients.
Acknowledgements
Supported by NIH R37CA249659 and a research grant from General Electric Healthcare.References
[1] Siegel CL, Andreotti RF, Cardenes HR, Brown DL, Gaffney DK, Horowitz NS, Javitt MC, Lee SI, Mitchell DG, Moore DH, Rao GG, Royal HD, Small W Jr, Varia MA, Yashar CM; American College of Radiology. ACR Appropriateness Criteria® pretreatment planning of invasive cancer of the cervix. J Am Coll Radiol. 2012 Jun;9(6):395-402. doi: 10.1016/j.jacr.2012.02.021.
[2] McDonald CR, Delfanti RL, Krishnan AP, Leyden KM, Hattangadi-Gluth JA, Seibert TM, Karunamuni R, Elbe P, Kuperman JM, Bartsch H, Piccioni DE, White NS, Dale AM, Farid N. Restriction spectrum imaging predicts response to bevacizumab in patients with high-grade glioma. Neuro Oncol. 2016 Nov;18(11):1579-1590. doi: 10.1093/neuonc/now063. Epub 2016 Apr 21. PMID: 27106406; PMCID: PMC5063514.
[3] Rodríguez-Soto AE, Lundström E, Besser A, et al. Multi-exponential model of diffusion signal with fixed ADCs in healthy and cancerous cervix tissues. Proceedings of the International Society for Magnetic Resonance in Medicine 31st Annual Meeting; 2023.
[4] Newitt DC, Zhang Z, Gibbs JE, Partridge SC, Chenevert TL, Rosen MA, Bolan PJ, Marques HS, Aliu S, Li W, Cimino L, Joe BN, Umphrey H, Ojeda-Fournier H, Dogan B, Oh K, Abe H, Drukteinis J, Esserman LJ, Hylton NM; ACRIN Trial Team and I-SPY 2 TRIAL Investigators. Test-retest repeatability and reproducibility of ADC measures by breast DWI: Results from the ACRIN 6698 trial. J Magn Reson Imaging. 2019 Jun;49(6):1617-1628. doi: 10.1002/jmri.26539. Epub 2018 Oct 22.
[5] Holland D, Kuperman JM, Dale AM. Efficient correction of inhomogeneous static magnetic field-induced distortion in echo planar imaging. Neuroimage. 2010;50:175-183.
[6] White NS, McDonald CR, Farid N, et al. Diffusion-weighted imaging in cancer: Physical foundations and applications of restriction spectrum imaging. Cancer Res. 2014;74:4638-52.
[7] Shukla-Dave A, Obuchowski NA, Chenevert TL, et al. Quantitative imaging biomarkers alliance (QIBA) recommendations for improved precision of DWI and DCE-MRI derived biomarkers in multicenter oncology trials. J Magn Reson Imaging. 2019;49:e101-21.
Figures