4301
Late-term Prenatal MRI for Evaluating Maternal Changes and their Correlation with Supine Hypotension Syndrome for Cesarean Section1Department of Anesthesiology, International Peace Maternity and Child Health Hospital, School of Medicine, Shanghai Jiao Tong University, ShangHai, China, 2Department of Radiology, International Peace Maternity and Child Health Hospital, School of Medicine, Shanghai Jiao Tong University, ShangHai, China, 3Siemens Healthineers, MR Research Collaboration, ShangHai, China
Synopsis
Keywords: Uterus, Prenatal, Supine hypotension syndrome, Gynecology
Motivation: Effectively preventing supine hypotension syndrome (SHS) is difficult due to the lack of sufficient in vivo abdominal MRI data.
Goal(s): This study aimed to retrospectively analyze the changes in the quantitative parameters of maternal MRI in late pregnancy to identify potential predictors of SHS.
Approach: By examining late-term prenatal MRI scans, we observed changes in several quantitative parameters.
Results: The abdominal–right uterine surface area ratio, dural sac anteroposterior diameter, ratio of epidural space anteroposterior diameter to dural sac, anteroposterior diameter, and left and right vertebral vein short-axis measurements were found to be helpful in determining SHS.
Impact: Late-term prenatal MRI can fully display the changes in maternal structure, providing a method for preoperative prediction of SHS after anesthesia.
Introduction
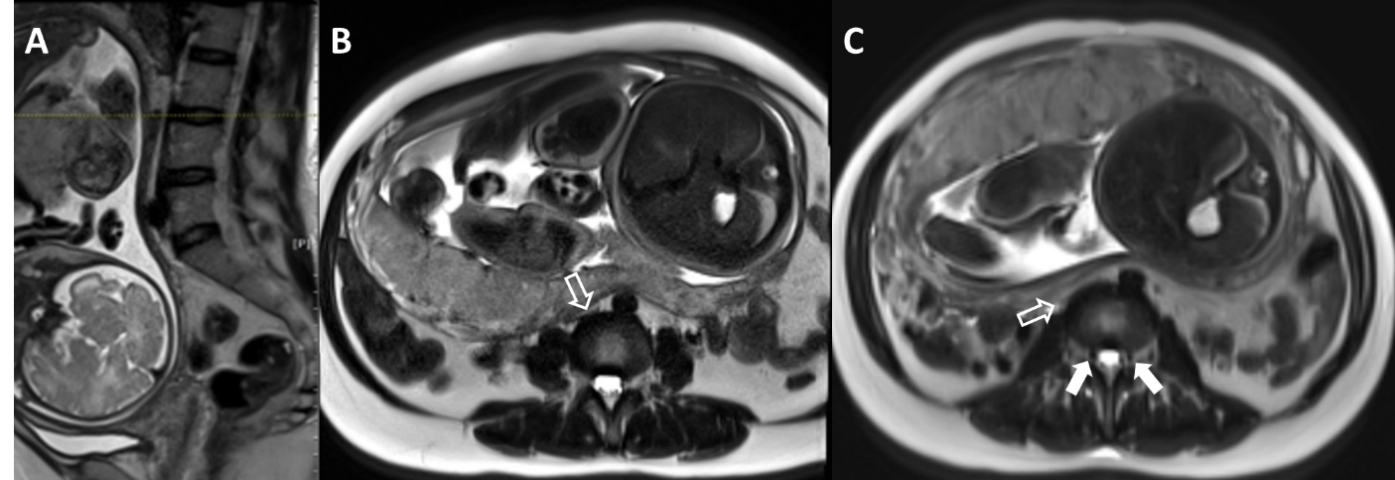
Supine hypotension syndrome (SHS) poses maternal and fetal health risks, but effective predictive methods are lacking. It results from maternal structural changes, yet in vivo evidence is insufficient. Late-term prenatal MRI can fully display these changes in the maternal structure of the uterus, surrounding abdomen, and spine1-2, allowing for retrospective analysis and potential preoperative prediction of SHS.Methods
From 2020 to 2022, 69 pregnant women who had cesarean sections within 14 days of late-term prenatal MRI MRI at our hospital were involved. Patients were divided into 2 groups based on SHS experience: SHS (n = 27) and asymptomatic (n = 42), and their clinical and imaging data were compared.Examinations were performed on a 1.5T system (MAGNETOM Aera, Siemens Healthineers AG, Erlangen, Germany) in a free-breathing supine position. The measurements were made on maternal axial sagittal and coronal T2W HASTE images, with parameters: TR = 1400 ms; TE = 152 ms; matrix size = 256 x 256; FOV = 400 x 400 mm, and slice thickness = 6 mm.
Measurements included maternal abdominal aorta (AA), inferior vena cava (IVC), uterus, abdomen, vertebral veins (left and right), dural sac, and epidural space at L3/4 intervertebral disc. Cross-sectional areas of these structures were measured, and ratios were calculated to eliminate heterogeneity. Uterine tilt (left, right, middle) and placenta position (left, right, anterior, posterior) from MRI scans were noted. Clinical data (age, height, weight, gestational age) were recorded. Clinical data and MR parameters were compared to SHS incidence.
Results
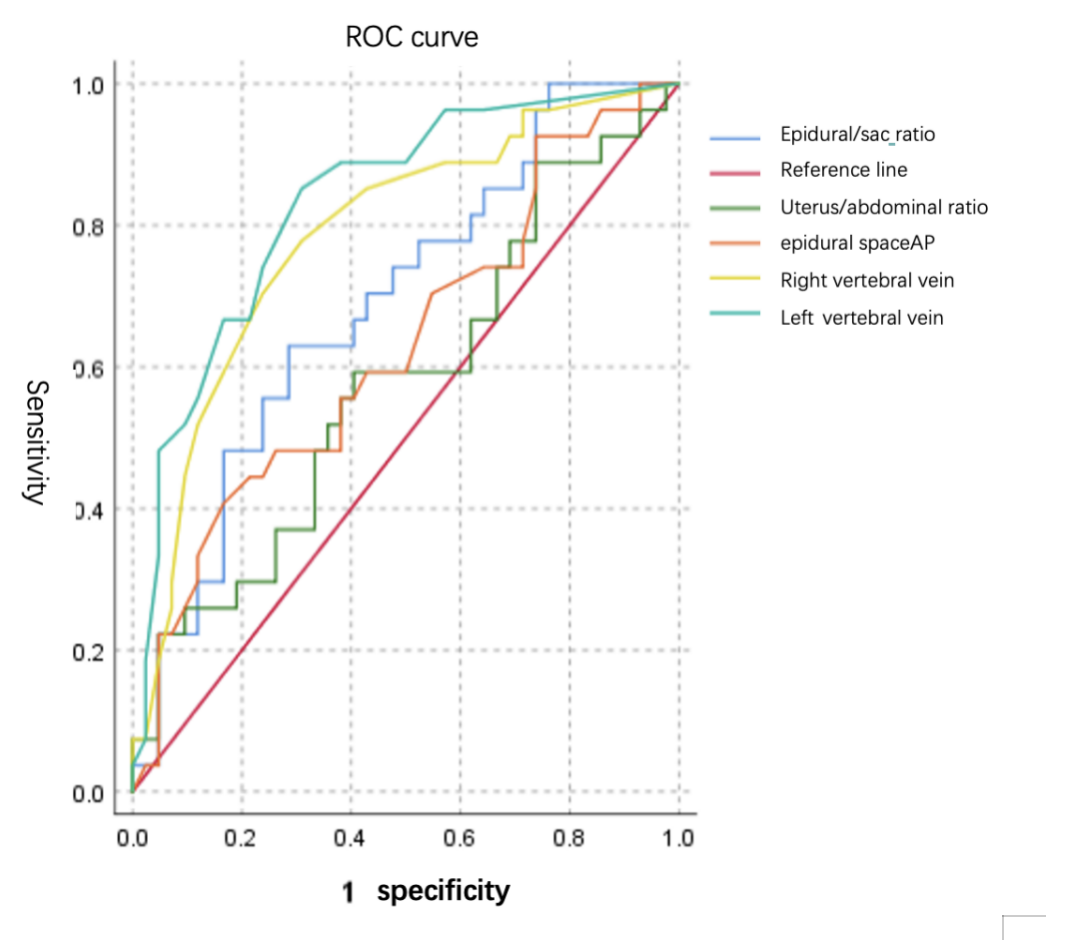
The clinical conditions of patients is in table1. No statistically significant differences were observed in the clinical condition. MRI findings revealed no statistically significant differences in the uterine and abdomen measurements. However, statistically significant differences were noted in IVC anteroposterior diameter (IVCAP), IVC area, AA short-axis (AAsa), AA area (AAarea), left vertebral vein short-axis and right vertebral vein short-axis (P <.05), and also in the epidural space anteroposterior diameter, dural sac anteroposterior diameter(AP) and IVC–spine distance between the 2 groups (P <.05). In the asymptomatic group, uterine size and MR gestational age((GA))were correlated, whereas intra-abdominal IVC, AA dimensions, vertebral veins, epidural space, dural sac, and IVC–spine distance remained consistent with GA. (table2,finger1)Notably, the abdominal-uterine ratio, dural sac diameter, epidural space-to-dural sac ratio, and vertebral vein dimensions exhibited excellent diagnostic performance (Area Under Curve(AUC) values: 0.578, 0.628, 0.689, 0.785, 0.832, respectively). Among these, the right vertebral vein short-axis had the highest sensitivity (0.852, cutoff value = 1.75 mm)and the dural sac anteroposterior diameter had the highest specificity (0.833, cutoff value = 7.6 mm).Discussion
Fetal MRI observes uterine cavity, vessels, and structures in pregnant women, aiding SHS understanding and preventive measures for anesthesiologists. An enlarged uterus often compresses IVC and AA in late pregnancy, but few exhibit symptoms. The IVCAP (1.80 vs 2.90 mm) and AAsa (10.5 vs 11.66 mm) considerably reduced in the symptomatic group, indicating IVC and AA compression severity links to SHS. Paraspinal vein diameter was larger in the SHS vs. asymptomatic group. In the asymptomatic group, the left vertebral vein (1.49 mm) significantly exceeded the right (2.28 mm), possibly due to left-side resting during pregnancy.The collateral venous system expanded due to the compression of the IVC and AA. An MRI study reported3. An increase in blood flow in the azygos vein. Our study revealed a parallel compensatory response in vertebral veins, reflecting the extent of IVC and AA compression and its strong association with SHS. The right vertebral vein's short diameter is a highly sensitive predictor of SHS.
The enlarged uterus and higher intra-abdominal pressure can compress other abdominal organs. Our MRI study confirmed this. In the symptomatic group, the inferior vena cava cross-sectional area (IVC-S) and dural sac were smaller than in the asymptomatic group (0.54 vs. 1.44 mm; 7.20 vs. 6.42 mm). Additionally, changes in the extradural sac outside the abdominal cavity were also noted. Hogan4 noted a narrowed lumbosacral lateral extradural sac in pregnant women and lower cerebrospinal fluid (CSF) volume in obese vs. lean individuals. Smaller dural sac results in faster and wider intrathecal anesthesia spread. Our study identified a strong correlation between the dural sac to extradural sac ratio and SHS, marking its first clinical recommendation for MRI-based prediction. Fetal MRI data offer crucial anatomical evidence for comprehending supine hypotension after intrathecal anesthesia.
Conclusions
Prenatal MRI identifies abdominal structural changes associated with SHS.Anesthesiologists can choose the appropriate amount of anesthesia and take preventive measures in advance based on the relevant fetal MRI reports of pregnant women.Acknowledgements
No acknowledgement found.References
1. Nemec U, Nemec SF, Bettelheim D.etal.Ovarian cysts on prenatal MRI.Eur J Radiol. 2012 Aug;81(8):1937-44].
2. Leyendecker JR, Gorengaut V, Brown JJ.MR imaging of maternal diseases of the abdomen and pelvis during pregnancy and the immediate postpartum period.Radiographics. 2004 Sep-Oct;24(5):1301-16
3. Humphries A, Mirjalili SA, Tarr GP, et al. The effect of supine positioning on maternal hemodynamics during late pregnancy. J Matern Fetal Neonatal Med 2019; 32:3923–3930.
4. Hogan QH, Prost R, Kulier A, Taylor ML, Liu S, Mark L.Magnetic resonance imaging of cerebrospinal fluid volume and the influence of body habitus and abdominal pressure.Anesthesiology 1996; 84: 1341–1349.
Figures
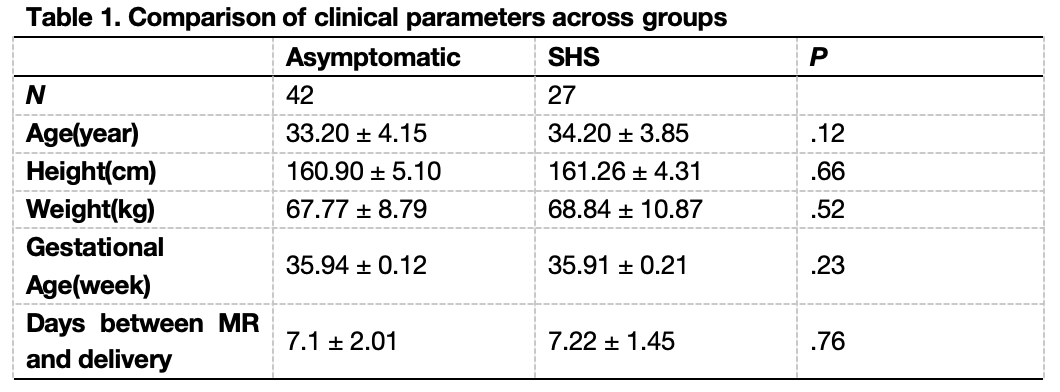
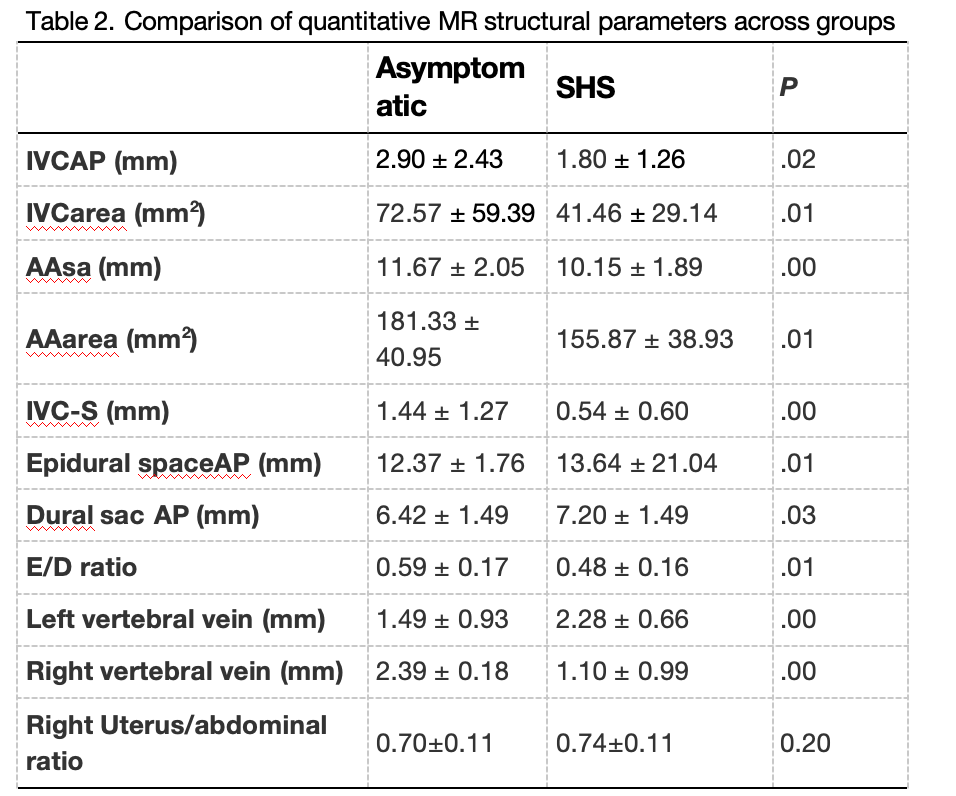
Table 2. Comparison of quantitative MR structural parameters across groups
*Abbreviations: AAarea, Abdominal aorta area, AAsa, abdominal aorta short-axis; dural sac AP, dural sac anteroposterior diameter; epidural spaceAP, epidural space anteroposterior diameter; E/D ratio, epidural spaceAP/dural sacAP ratio; IVC area, inferior vena cava area; IVCAP, inferior vena cava anteroposterior diameter; IVC-S, inferior vena cava to the spine diameter.