4300
Characterising placental contractions1Sir Peter Mansfield Imaging Centre, School of Physics and Astronomy, University of Nottingham, Nottingham, United Kingdom, 2School of Medicine, University of Nottingham, Nottingham, United Kingdom, 3School of Computer Science, University of Nottingham, Nottingham, United Kingdom, 4National Institute for Health Research, Biomedical Research Centre, Hospital NHS Trust and University of Nottingham, Nottingham, United Kingdom, 5Faculty of Engineering, University of Nottingham, Nottingham, United Kingdom
Synopsis
Keywords: Placenta, Placenta
Motivation: We have previously observed placental contractions and now want to charcterise them further.
Goal(s): To characterise placental contractions (frequency, amplitude and length) in normal pregnancy.
Approach: Dynamic respiratory gated multislice EPI scans acquired for 30 minutes across the pregnant uterus, analyzed by automatic segmentation.
Results: Placental contractions lasting several minutes and sometimes causing very large changes in placental volume, were found in every woman studied.
Impact: Further work will investigate the function of contractions and whether they are altered in compromised pregnancies.
Introduction
We recently observed the new phenomenon of placental contractions in utero [1] distinct from uterine (Braxon Hicks) contractions, although this contractile function had previously been postulated in the biology literature [2]. However, since placental contractions are not periodic, we were unable to determine how frequently they occurred. This study involves scanning healthy pregnant women for about 30 minutes to characterise placental contractions using automatic segmentation of the images.Method
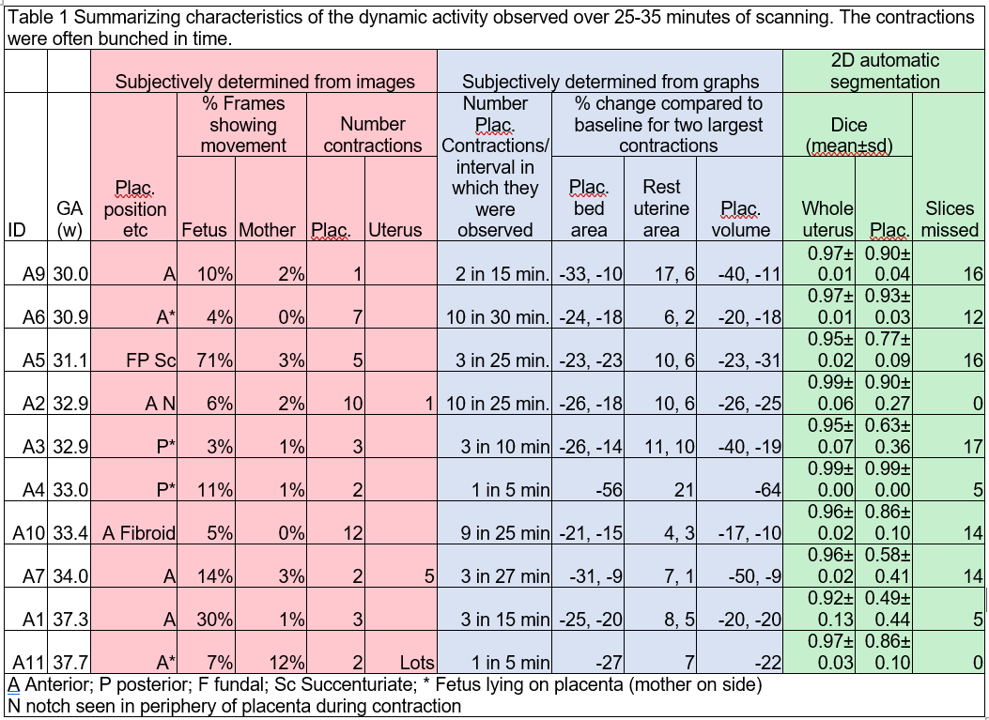
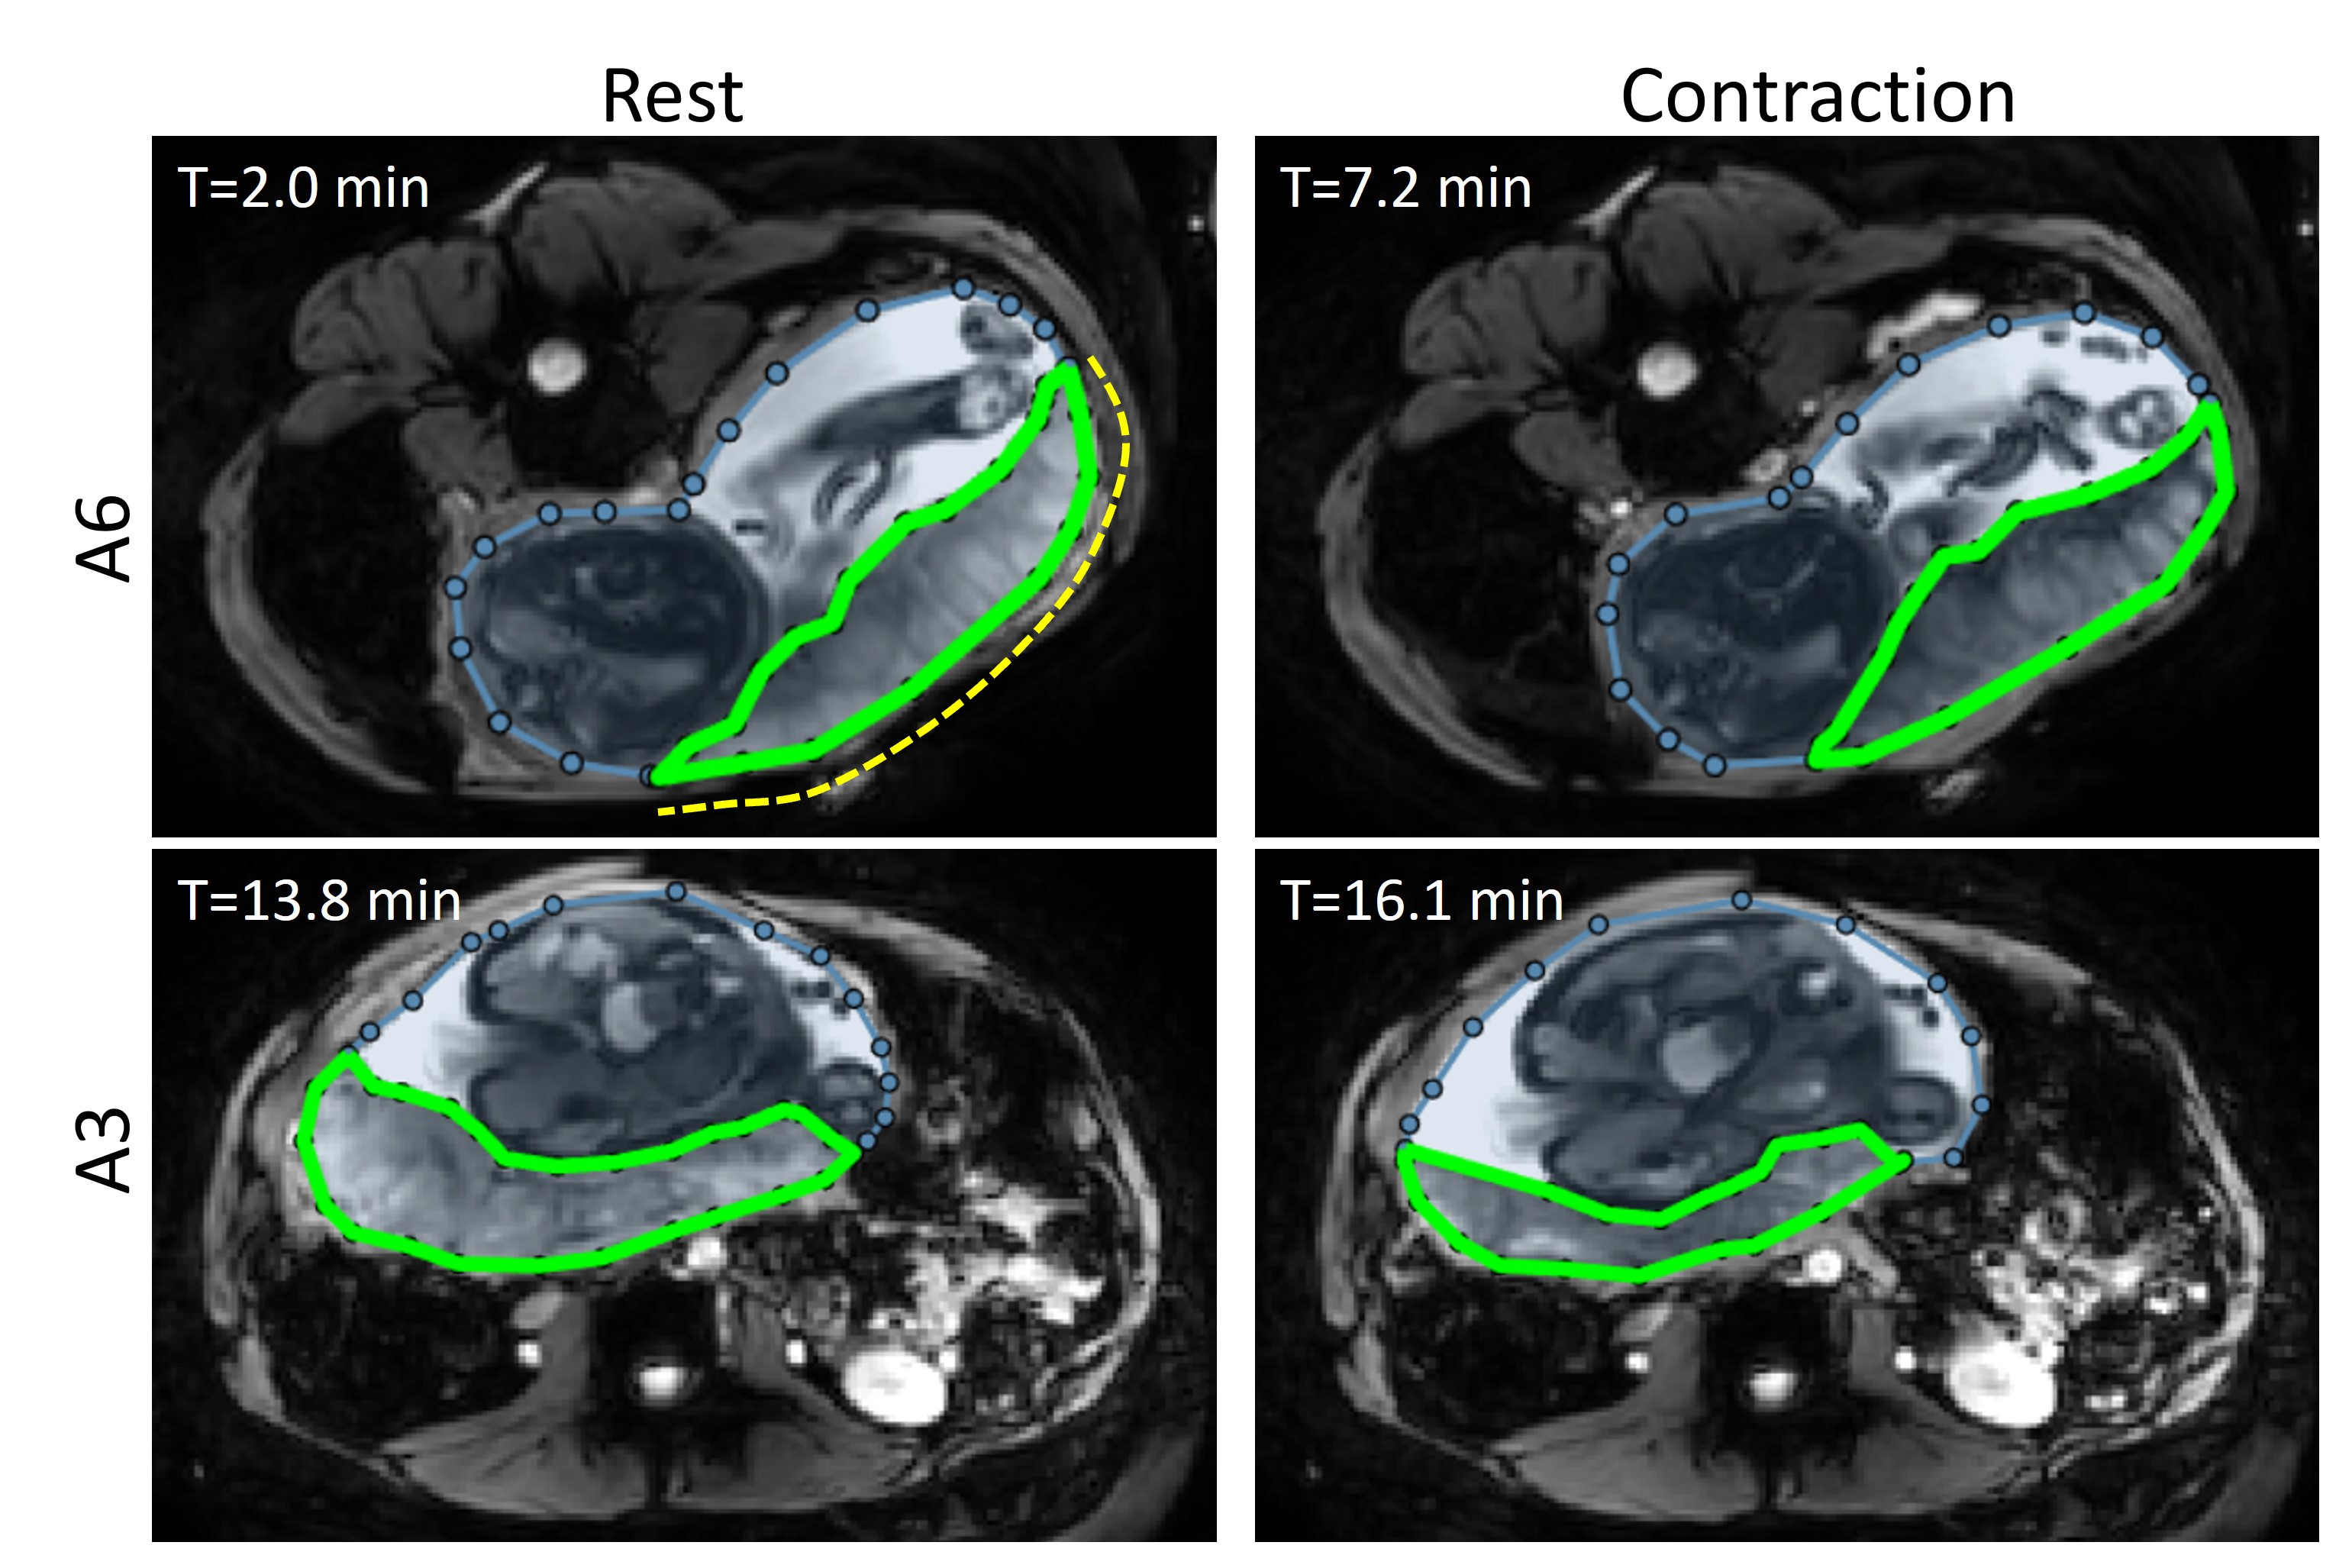
Ethics approval was obtained from a regional ethics committee. 10 women with healthy pregnancies (gestational ages shown in Figure 1) were consented and scanned once, with a left lateral tilt in a 3T Philips Ingenia scanner limited to normal operating mode. Dynamic MRI was acquired for up to 30 minutes using multislice (NSL=32) single shot EPI (TE 25ms, voxel 1.56x1.56x4 mm3, FOV 400x400x316mm3 Sense 3), gated to the maternal breathing (minimum TR of 9s). The flip angle was adjusted to maximize signal in the placenta (usually 110o).Images were segmented to outline the uterine sac and placenta (Figure 2). This was done manually for some slices/volumes of all subjects, and also using a convolutional neural network method, known as nnunet [3]. The model was pre-trained on a different manually segmented dataset [1] and refined on manually segmented data from this study. Due to the current scarcity of 3D masks, the model was trained and validated on 2D slices. At this initial stage the segmentation results were post-processed by discarding small mis-segmented regions (end slices) while retaining slices with the largest contiguous regions for each of the two classes (slices missed indicated in Figure 1).
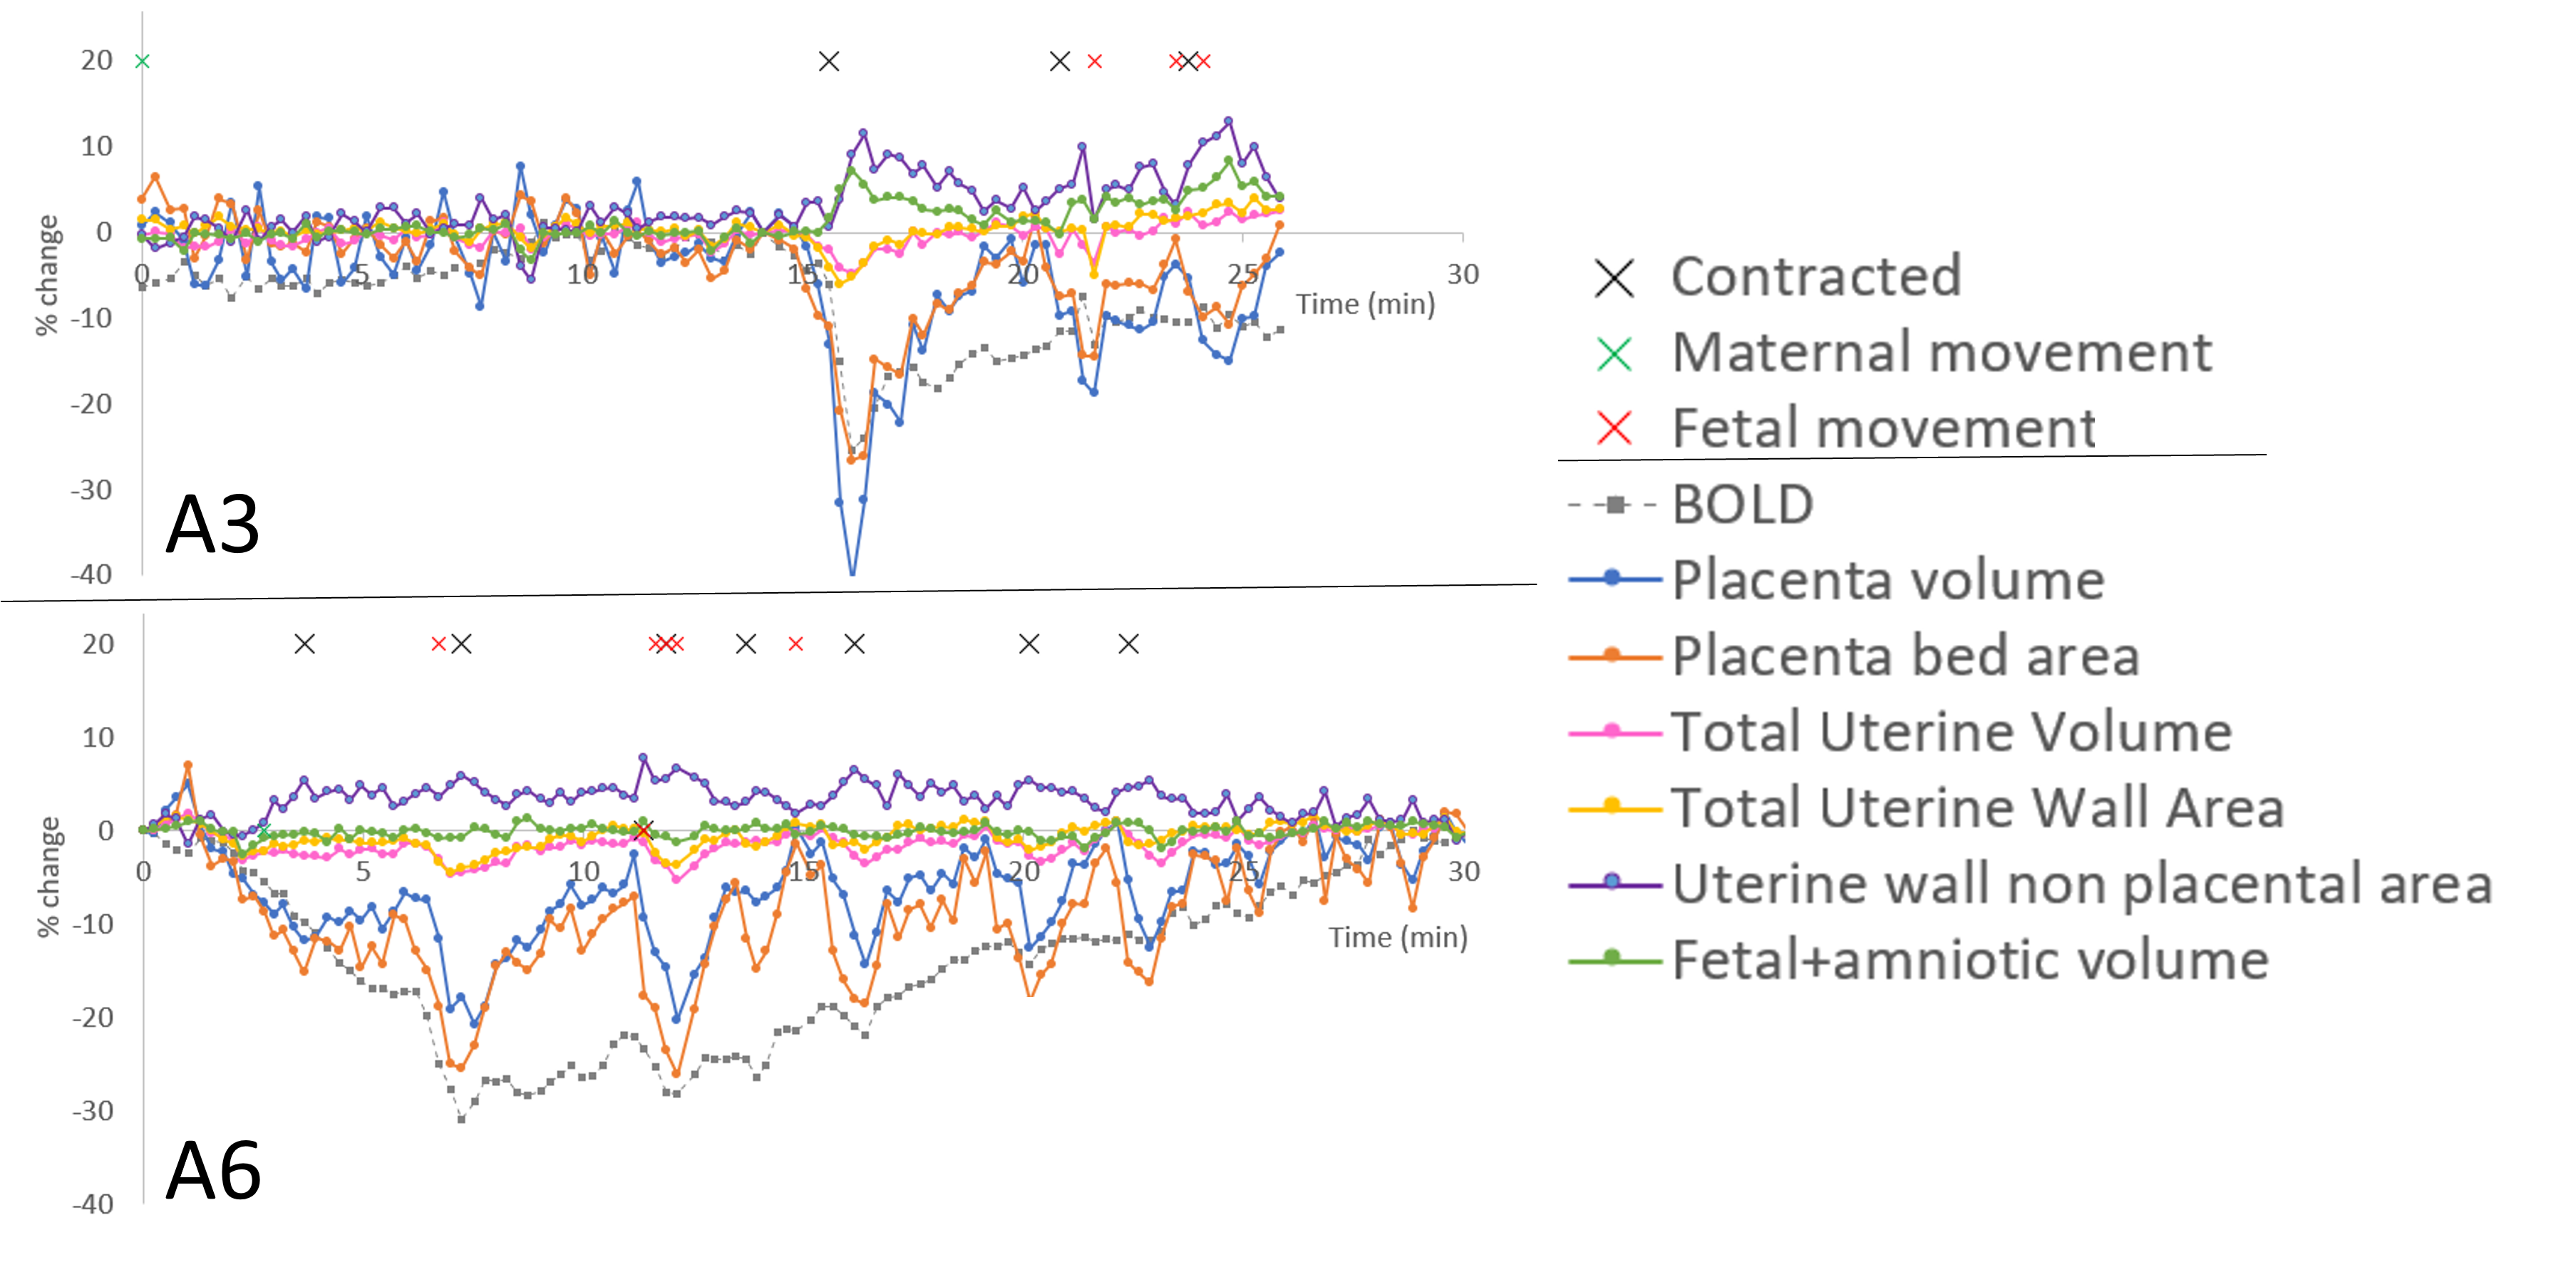
The volume of the placenta, and area of placental bed and remainder of the uterine wall were plotted against time (Figure 3). Placental contractions were defined as a decrease in placental bed area of 10% below current baseline with a concomitant increase in area of the rest of the uterine wall, lasting more than two time points.
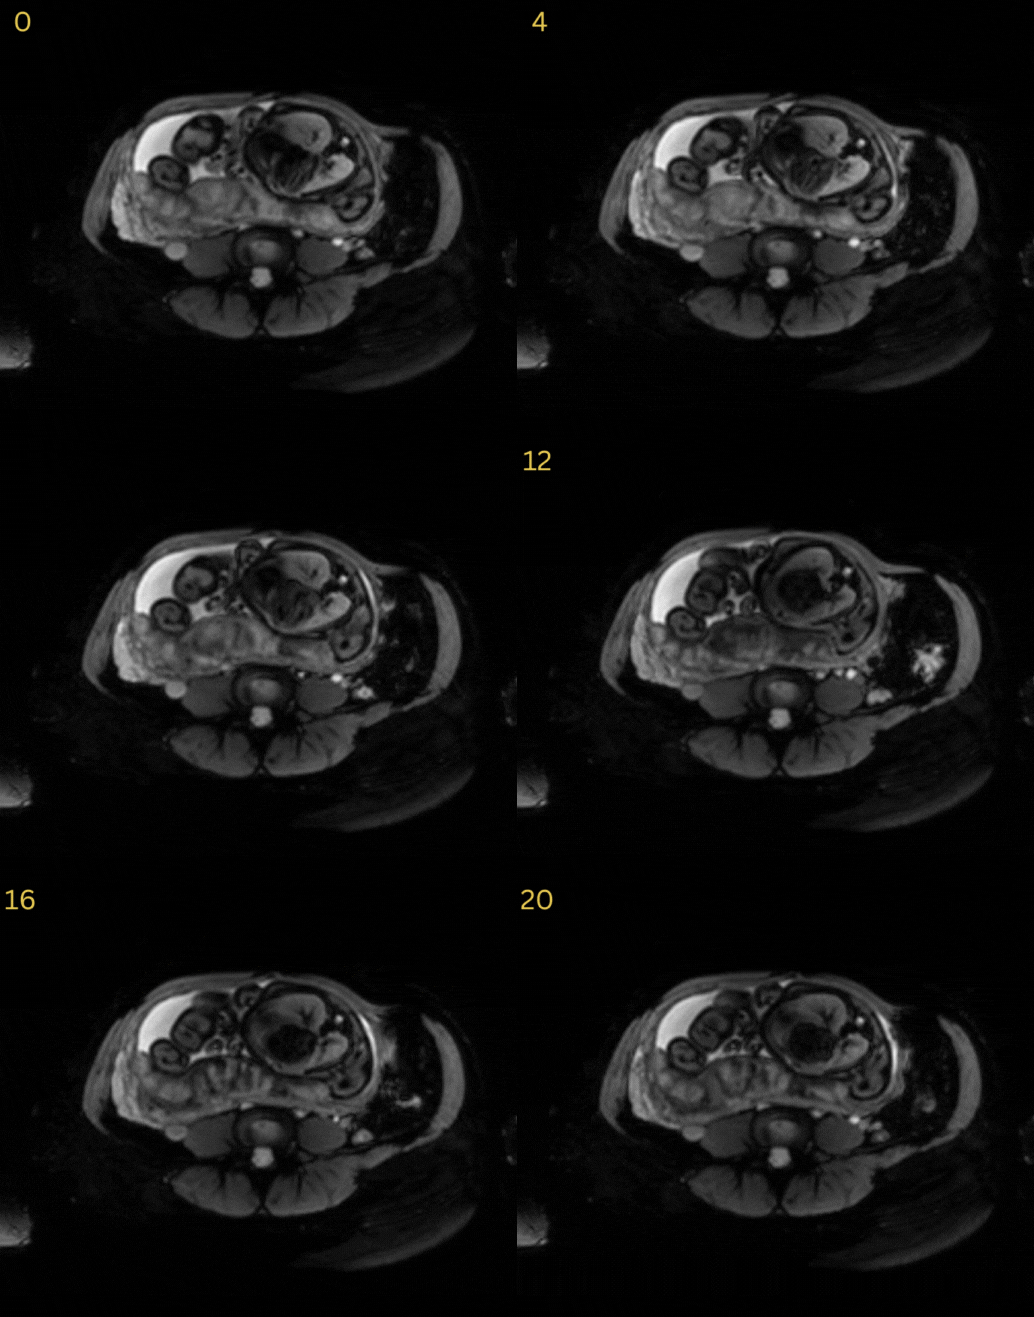
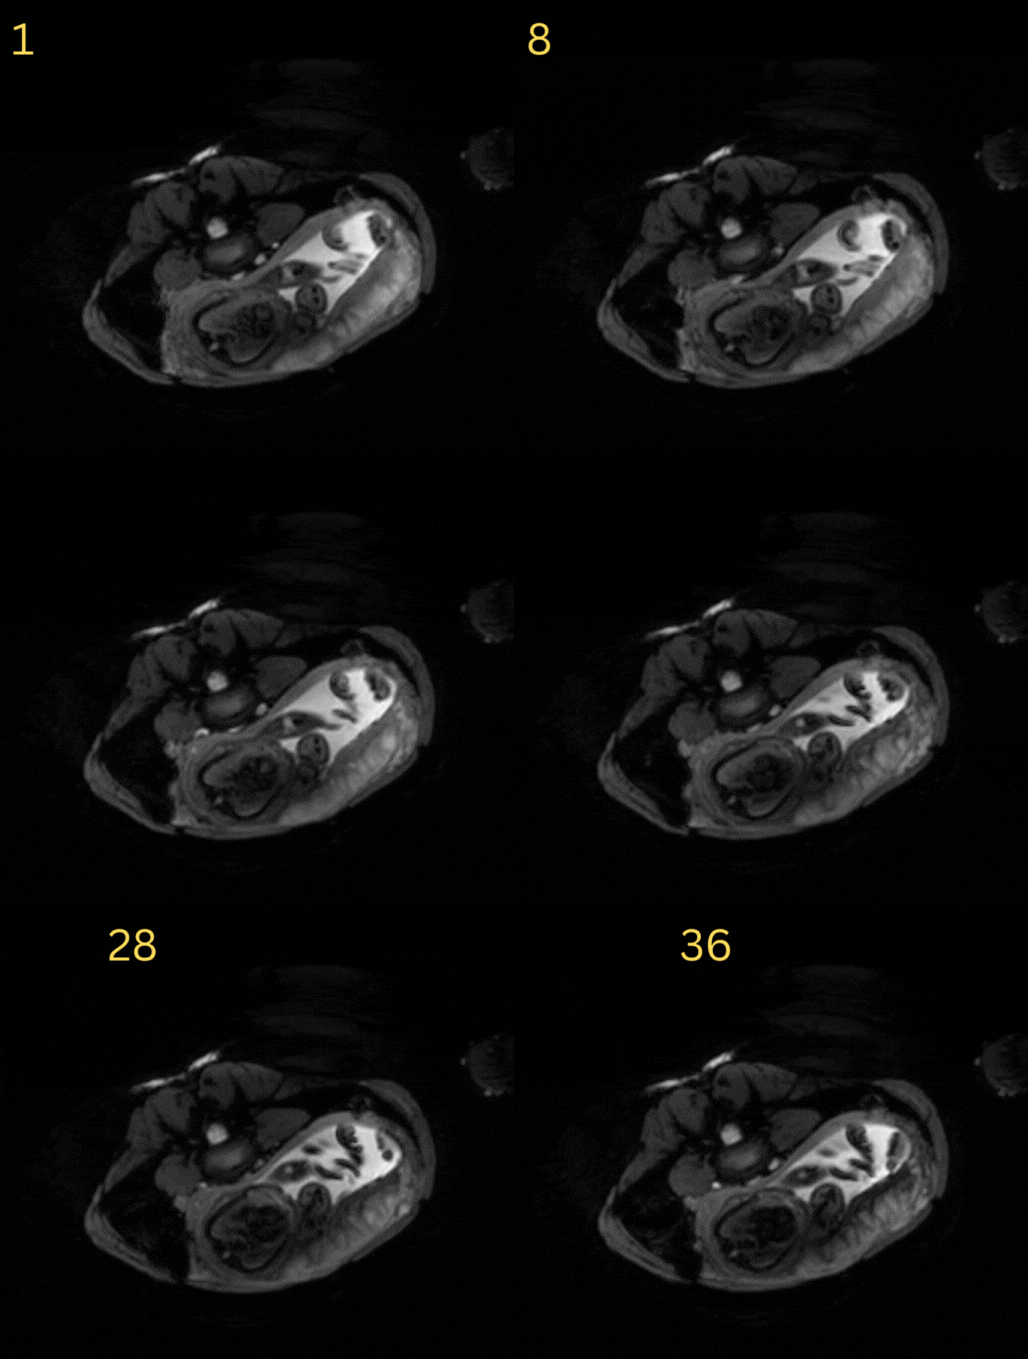
Cine images (Figure 4&5) were visually inspected for apparent maternal motion, fetal movements that distorted the placenta, and uterine and placental contractions (crosses in Figure 2). Placental contractions appeared as a shortening and change in shape of the placenta. Uterine contractions were defined as either (1) extensive wall thickening usually localised to one area of the uterus not under placental bed or (2) changes in shape of the uterus.
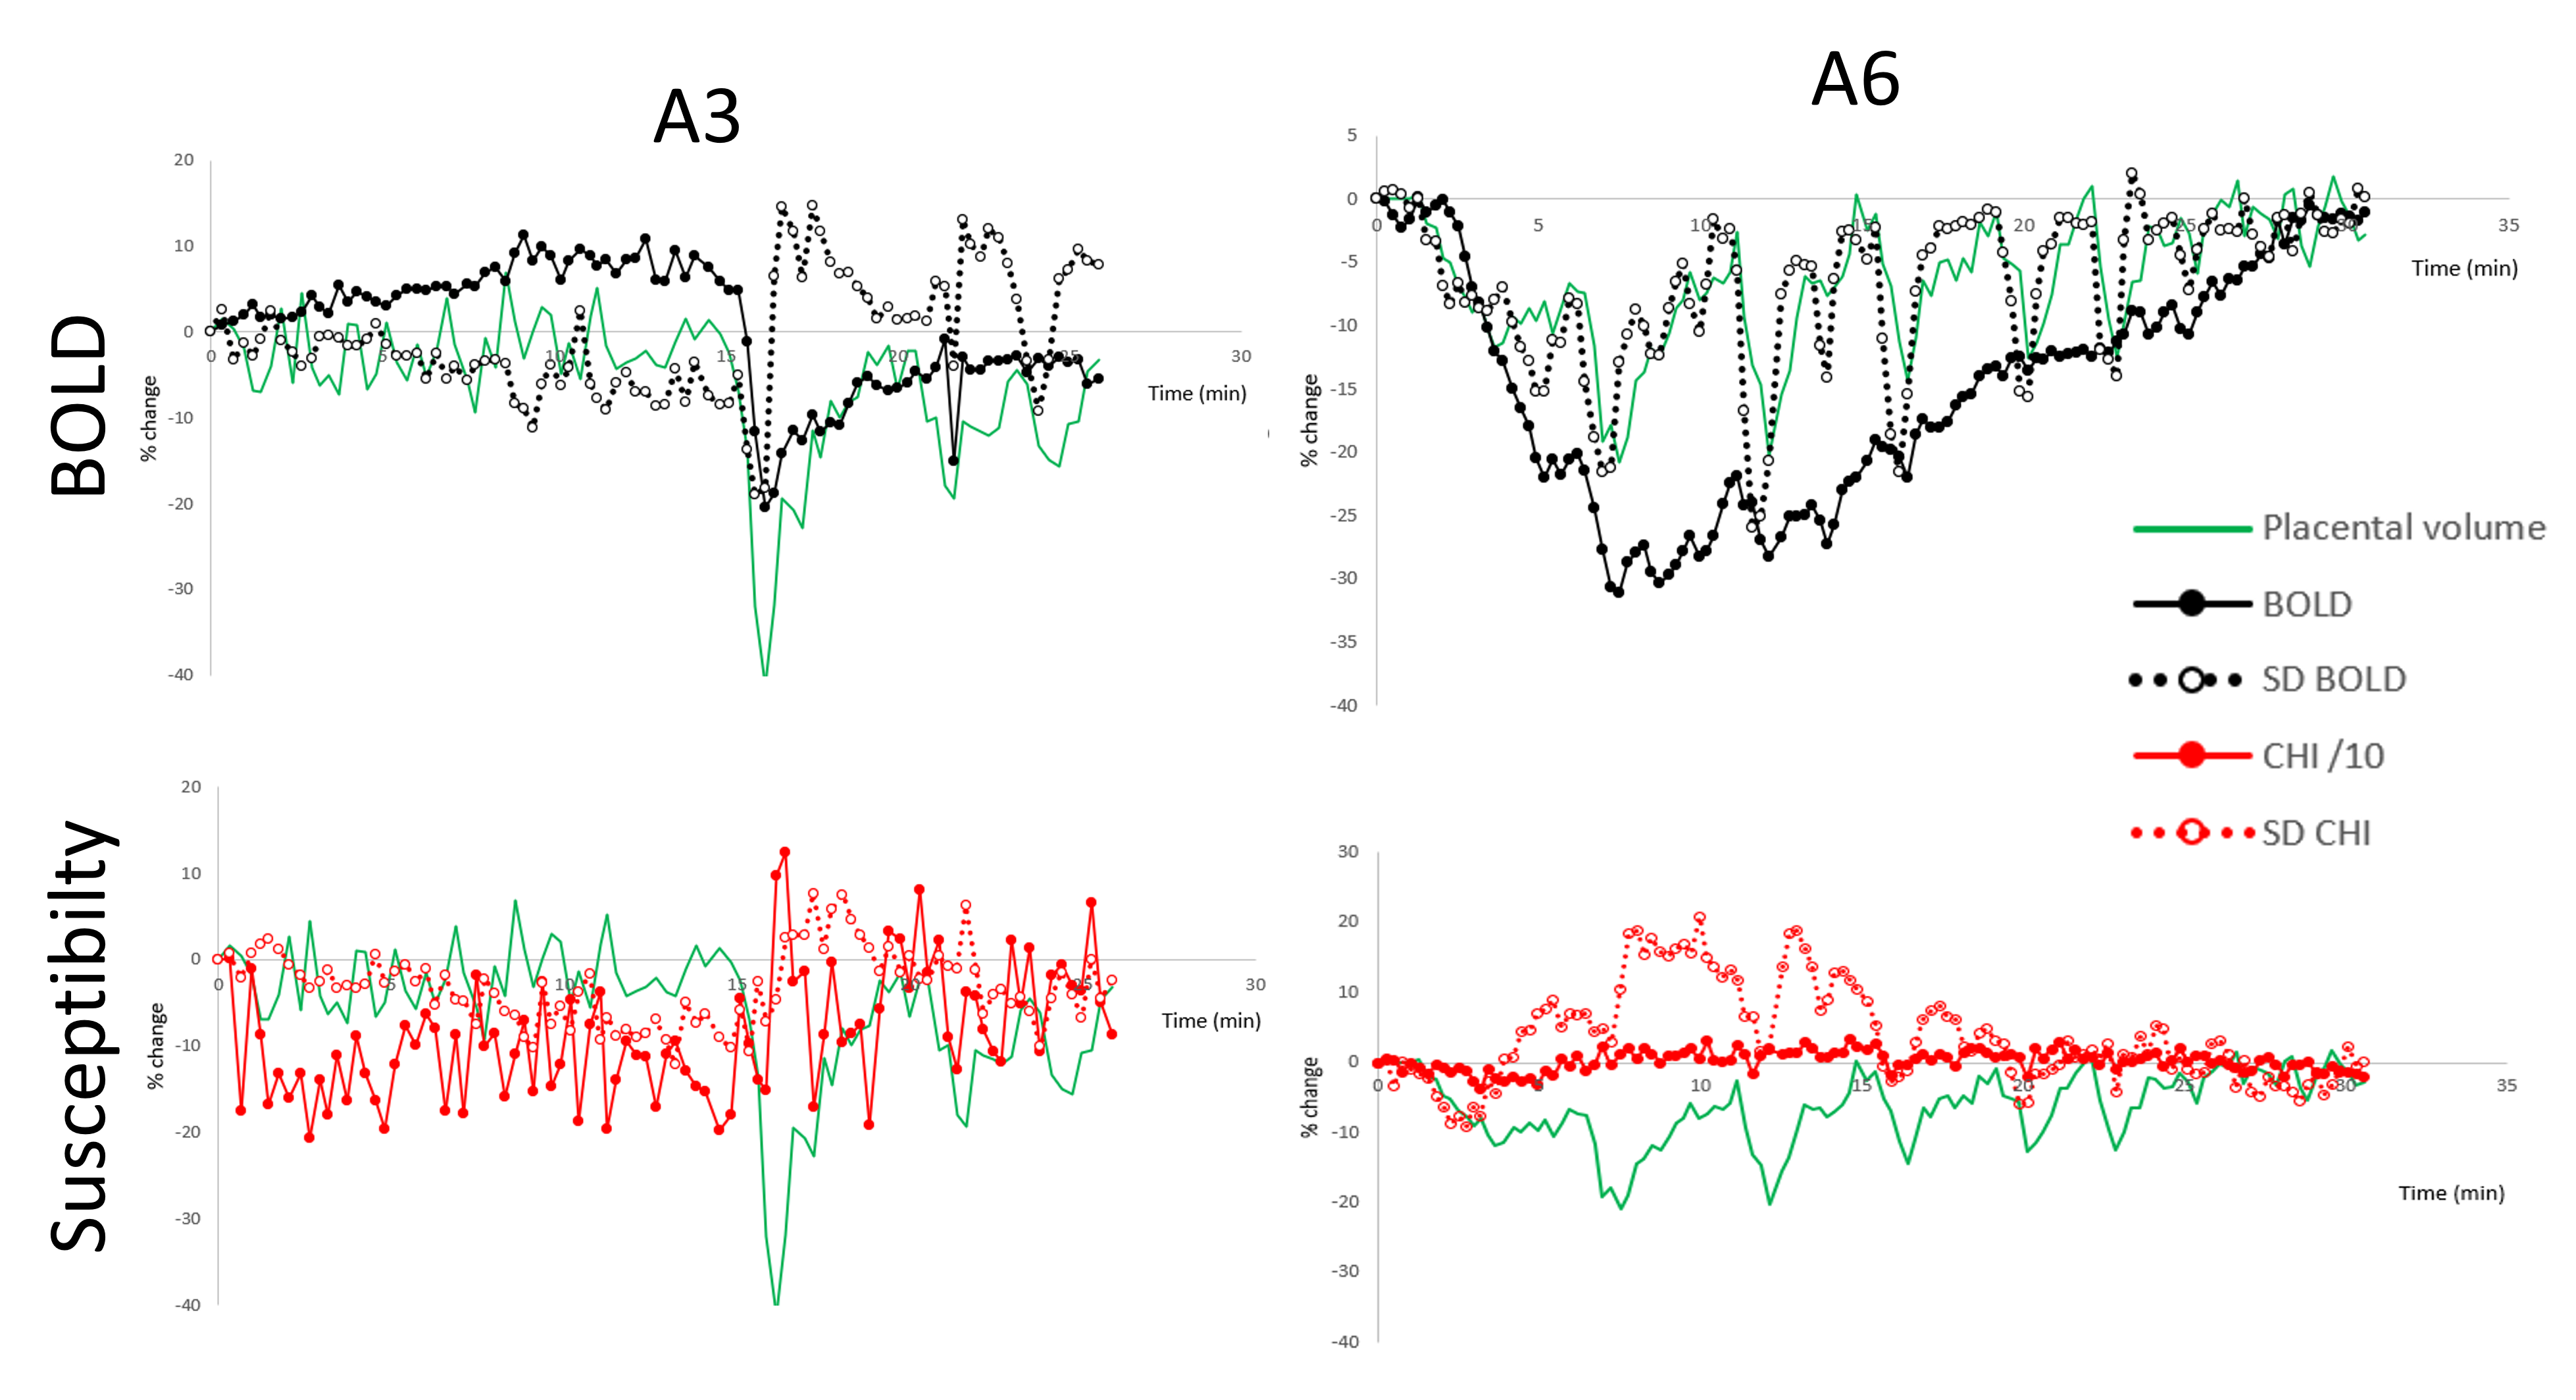
Dynamic susceptibility maps have been produced from this data for some subjects at this stage (Figure 6).
Results
Figure 4&5 shows gifs of two placental contractions. The segmentation model underwent a 5-fold cross-validation on the 10 4D datasets, with each fold encompassing 2 subjects. For each subject, the evaluation was conducted on the annotated 2D slices. The averaged Dice coefficients between prediction and ground truth are in Figure 1 (green columns).Figure 3 plots the variations volume and surface area of the uterus, area of the placental bed, volume of placenta, and average placental T2*wt BOLD signal. Figure 1 summarizes the results obtained from viewing the cine image (pink columns) and from the time courses in Figure 3 (blue columns). Apparent uterine contractions were observed later in pregnancy in this group.
Figure 6 shows the signal time course for mean and standard deviation of BOLD and susceptibility for the same two subjects.
Discussion
Placental contractions lasting several minutes and sometimes causing very large changes in placental volume, were found in every woman studied. In half the women contractions occurred repeatedly, and the other half showed periods of no contractions.Similar numbers of contractions were identified from inspecting the segmentation graphs and the cine images. Automatic segmentation generally achieved acceptable results but did not always preserve consistent anatomical structure and often failed in end slices (less represented in training data). In future, we aim to leverage the unique attributes of 4D datasets and incorporate an image alignment method to retain geometrical information across time points, thereby improving segmentation performance.
In future we will develop methods for automatically detect placental and uterine contractions from the time series of signals, areas and volumes (Figure 3) and images.
We also plan to investigate the function of placental contractions. The BOLD signal generally decreases during and after contractions. For the limited number of susceptibility maps produced so far, the mean susceptibility is variable but the standard deviation of susceptibility increases following a contraction (Figure 6). Together these early results might indicate a reduction in blood oxygenation, a mismatch in oxygenation between compartments and/or increased variability within the placenta. We will investigate this further including with mathematical placental models.
Acknowledgements
This work was funded by the Wellcome Leap In Utero Program.References
[1] Dellschaft, N.S., Hutchinson, G., Shah, S., Jones, N.W., Bradley, C., Leach, L., Pratt., Bowtell, R., Gowland P., The haemodynamics of the uman placental in utero, P PLOS Biology 18(5): e3000676, 2020.
[2] Kato, Y., Oyen, M.L., and Burton, G.J. Villous tree model with active contractions for estimating blood flow conditions in the human placenta. Open Biomed Eng J, 11, 36-48m 2017.
[3] Isensee, F., Jaeger, P. F., Kohl, S. A., Petersen, J., & Maier-Hein, K. H. (2021). nnU-Net: a self-configuring method for deep learning-based biomedical image segmentation. Nature methods, 18(2), 203-211.
Figures