4280
Automatically Quantitative Intra-tumoral susceptibility Signal and R2 star in discriminating subtype of ovarian cancer1Radiology, The First Affiliated Hospital, Dalian Medical University, Dalian, China, 2Radiology, The First Affiliated Hospital of Dalian Medical University, Dalian, China, 3Radiology, Dalian Municipal Central Hospital, Dalian, Liaoning, China, Dalian, China, 4School of Biomedical Engineering, Faculty of Medicine, Dalian University of Technology, Dalian, China, 5Liaoning Key Laboratory of Integrated Circuit and Biomedical Electronic System, Dalian, China
Synopsis
Keywords: Pelvis, Blood vessels
Motivation: It is important to quantitatively analyze the subtype of epithelial ovarian cancer using oxygen content, neovascularization, intra-tumoral hemorrhage.
Goal(s): To investigate the R2* value of ESWAN and quantitative ITSS obtained automatically in discriminating subtype of epithelial ovarian cancer.
Approach: R2* value of ESWAN sequence and ITSS ratio of ovarian cancer lesion were measured, and the value of R2* and ITSS in discriminating subtype of EOC was analyzed.
Results: The area ITSS ratio and volume ITSS ratio of type II ovarian cancer were significantly higher than those of type I EOC. There was no significant difference between type I and type II EOC.
Impact: The area ITSS ratio and volume ITSS ratio have certain value in discriminating type I from type II EOC. The value of R2* value in the differentiation of subtype of epithelial ovarian cancer need to be further explored.
Introduction
Epithelial ovarian cancers (EOCs) were classified into type I and type II with the dualistic model according to different pathogenesis information [1,2]. Enhanced T2 star weighted angiography (ESWAN) sequence can obtain quantitative parameters such as magnitude value, phase value, transverse relaxation ratee (R2*) value and T2* value according to the difference of magnetic sensitivity between tissues, thus reflecting the change of tissue blood oxygen content [4]. R2* is a sensitive index for quantitative evaluation of local tissue oxygen content. Heterogeneous ITSS was significantly associated with tumor hemorrhage, necrosis, diffusion restriction. Intra-tumoral susceptibility signals (ITSS) mainly reflect microhemorrhage and neovascularization within the tumor [5], which presented continuous dotted or linear low signal area within the tumor on the phase map. There was no research evaluated the value of R2*, ITSS in discriminating type I from type II EOC. This study was to investigate the feasibility of R2*, ITSS in discriminating type I from type II EOC.Methods
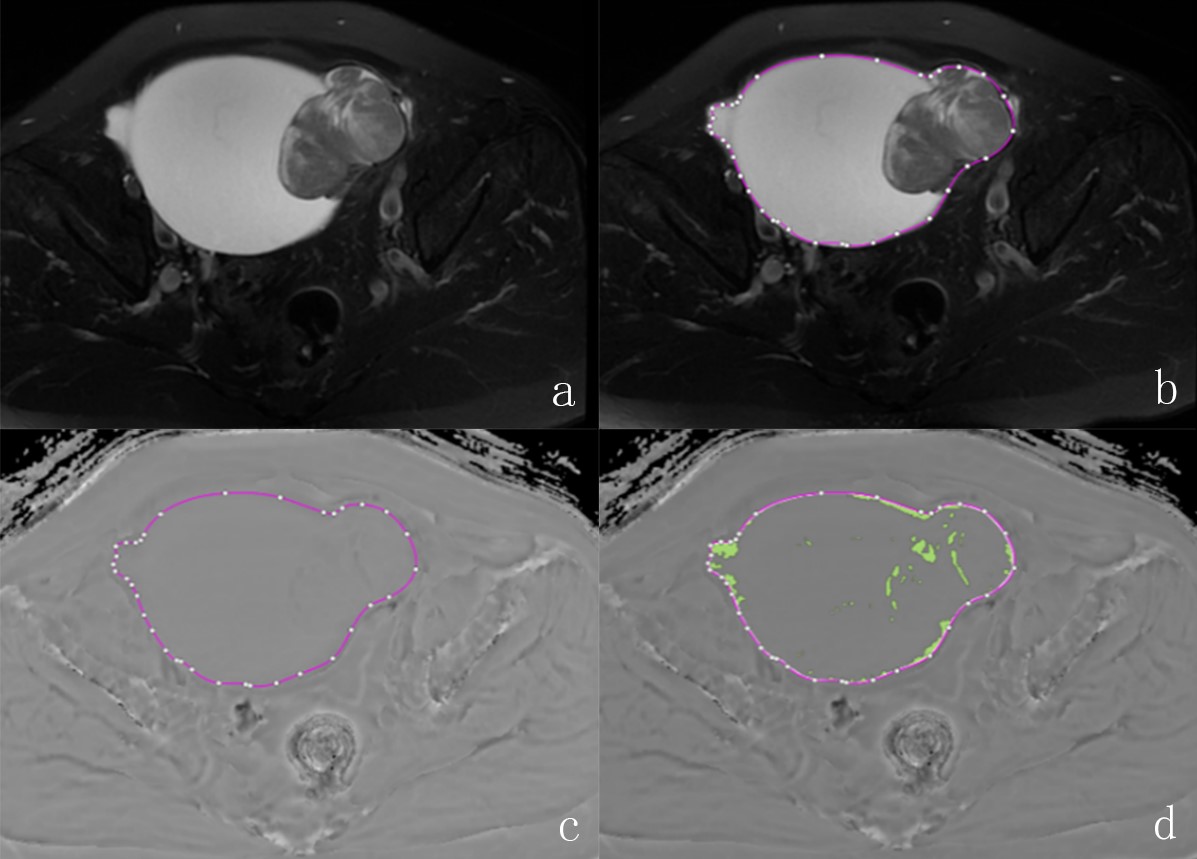
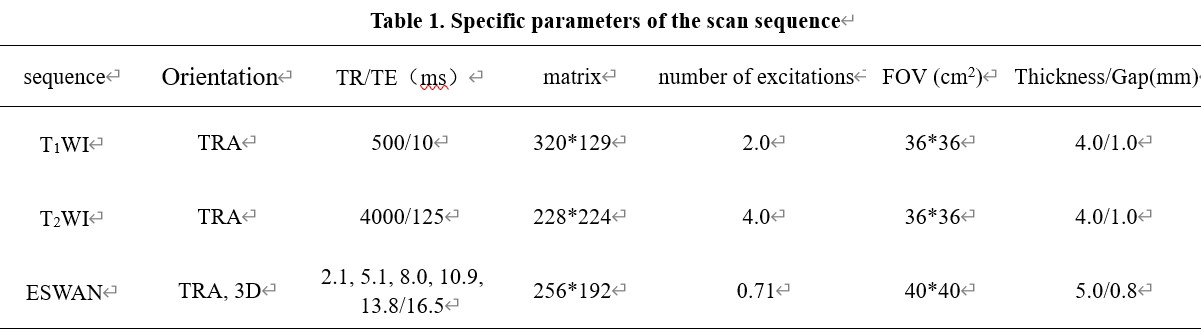
38 ovarian cancer patients with 44 pathologically confirmed lesion were included in this study. MR examinations included T1W, T2W, ESWAN sequences were performed within two weeks before surgery. Patients were grouped into type I and type II groups. All patients were scanned using a 1.5 T MR scanner (GE Signa HDXT) with eight-channel body matrix coil. The specific scanning parameters are shown in Table 1. The ESWAN sequence images are transmitted to the GEADW4.6 workstation, and the R2*, magnitude and phase images are obtained by Functool software processing. Because the banded artifacts in the phase image will seriously affect the measurement of ITSS, python was used to remove the artifacts before measurement. After removing the artifacts, the phase diagram of the batch processing program is exported to NII format and transmitted to the special software Anatomy Sketch for tumor drawing. Two observers blinded to the clinical information manually draw the ROIs. The ROI of the lesion was delineated along the contour of the solid portion of tumor at the largest slice in the T2W sequence and its adjacent upper and lower multiple layers (Figure 1). After the completion of the delineation, ROIs were automatically mapped to the phase map, and the lesion ITSS ratio of the phase map was calculated. The area ITSS ratio and the volume ITSS ratio were obtained. Area ITSS ratio is defined as the ratio of the ITSS area to the tumor area in the section with the largest ITSS area. Volume ITSS ratio is the ratio of the ITSS volume to the tumor volume. Intraclass correlation coefficient was used to evaluate the inter-observer reliability of the R2*, ITSS measurement from two observers. The independent sample t-test or Mann-Whitney U test were used to compare the differences in the parameter values between the two groups. ROC curve was used to calculate the R2* and ITSS ratio with the statistical difference to evaluate the performance of subtype of EOC.Results
The area ITSS, volume ITSS and R2* values of the lesions measured by the two observers were consistent (ICC=0.937, 0.920, 0.813, respectively). The area ITSS ratio and volume ITSS ratio of type II EOC were significantly higher than those of type I EOC (0.149 vs. 0.741, P<0.001; 0.140 vs. 0.084, P=0.004, respectively). There was no significant difference between type I and type II epithelial ovarian cancer (P=0.435). the AUC of area ITSS ratio in discriminating type I from type II EOC was 0.853, with sensitivity 89.29%, and specificity 68.75%. the AUC of volume ITSS ratio was 0.759, with sensitivity 71.43%, and specificity 68.75%.Discussion
The results of this study showed that ITSS ratio of type II EOC were significantly higher than those of type I EOC. The results suggested that type II EOC were more susceptible to generate neovascularization than type I EOC, which was consistent with the higher aggressiveness of type II EOC. furthermore, there may be more invisible intra-tumoral hemorrhage lesions in type II EOC than type I EOC. However, there was no difference in R2* value between the two groups, which reveals that the oxygen content can not be charactered by R2* in this study. The reason might be the small number of the cohort in this study. More patients should be enrolled in the further study to verify the results of the present study.Conclusion
The area ITSS ratio and volume ITSS ratio have certain value in discriminating type I from type II epithelial ovarian cancer. The value of R2* value in the differentiation of subtype of epithelial ovarian cancer need to be further explored.Acknowledgements
No acknowledgement found.References
1. Karnezis AN, Cho KR, Gilks CB, Pearce CL, Huntsman DG: The disparate origins of ovarian cancers: pathogenesis and prevention strategies. Nature reviews Cancer 2017, 17(1):65-74.
2. Kurman RJ, Shih Ie M: Pathogenesis of ovarian cancer: lessons from morphology and molecular biology and their clinical implications. International journal of gynecological pathology: official journal of the International Society of Gynecological Pathologists 2008, 27(2):151-160.
3. McCluggage WG: Morphological subtypes of ovarian carcinoma: a review with emphasis on new developments and pathogenesis. Pathology 2011, 43(5):420-432.
4. Chen XQ, Niu JP, Peng RQ, Song YH, Xu N, Zhang YW. The early diagnosis of Parkinson's disease through combined biomarkers. Acta Neurol Scand. 2019 Oct;140(4):268-273.
5. Gaudino S, Marziali G, Pezzullo G, Guadalupi P, Giordano C, Infante A, Benenati M, Ramaglia A, Massimi L, Gessi M, Frassanito P, Caldarelli M, Colosimo C. Role of susceptibility-weighted imaging and intratumoral susceptibility signals in grading and differentiating pediatric brain tumors at 1.5 T: a preliminary study. Neuroradiology. 2020 Jun;62(6):705-713.
Figures