4277
Pixel SNR, pixel density, detection, estimation, and the advantages of red noise1Department of Radiology, University of Wisconsin, Madison, WI, United States
Synopsis
Keywords: Data Acquisition, Data Acquisition, Noise, SNR, detectability, estimation
Motivation: Pixel SNR is a common metric for sequence design and scan implementation, however it is not ideal for detectability and estimation.
Goal(s): To take and modify an existing noise measure from the literature and test it against pixel SNR for both white and red (high spatial frequency) noise.
Approach: Ten individuals performed a detection task on 100 synthetic low SNR images with white or red noise.
Results: The new metric was more predictive of detection than pixel SNR or circle radius. Images with red noise had worse pixel SNR but better detection rates.
Impact: A proposed SNR metric is more relevant than pixel SNR for both detection and estimation, and consistent with our findings of better detectability in red noise over white noise. This is important for the design of clinical pulse sequences.
Introduction
Pixel Signal-to-Noise Ratio (SNRpixel) is a commonly used in MRI as a metric for designing pulse sequences and choosing scan parameters. It is relevant for two common imaging tasks, detection and estimation. For this discussion, we conflate contrast to noise ratio CNR with SNR for simplicity and generally assume wide sense stationary noise. As discussed by Constable and Henkleman1, detection of an image object with an area of n pixels against a constant background is related to$$detectability \propto SNR_{pixel} \ \sqrt{n} \tag{1}$$
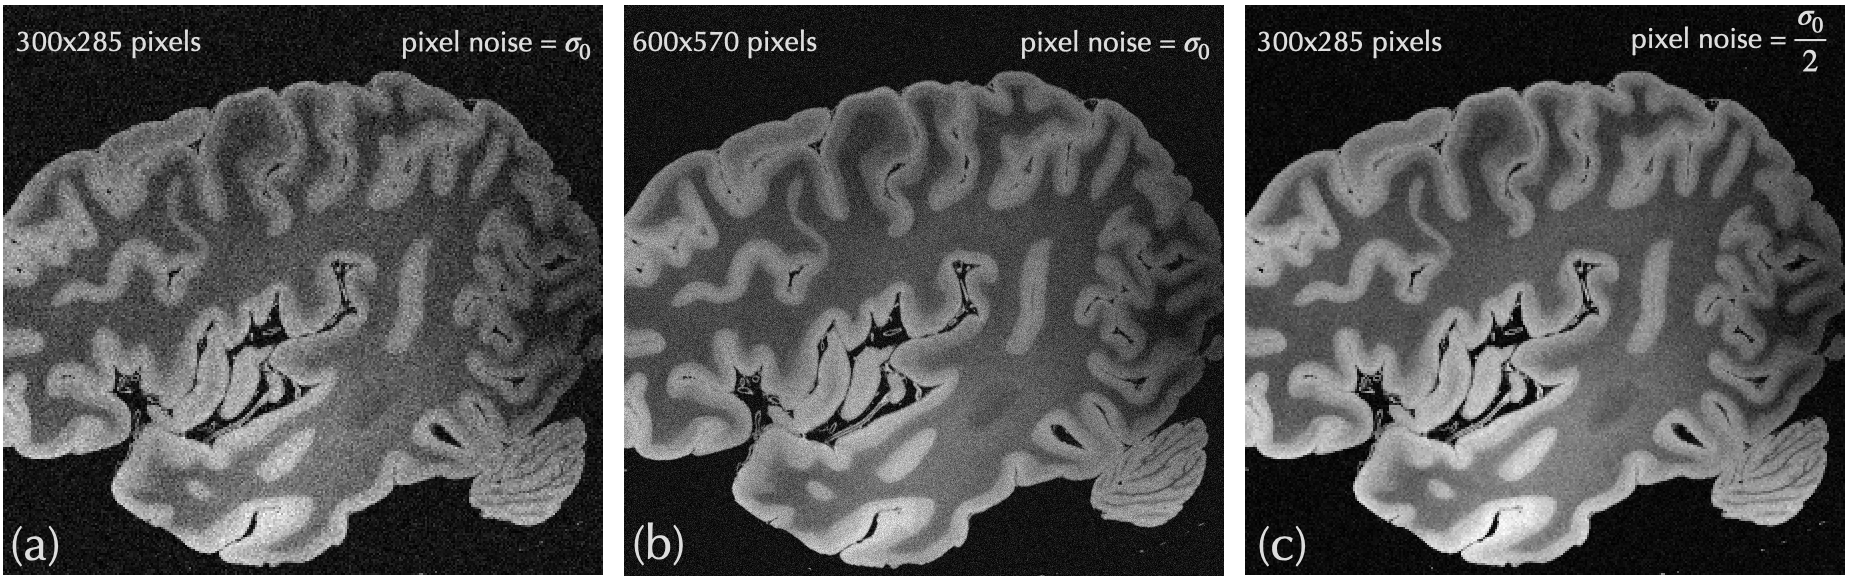
This is consistent with the inference from the Rose model2 to MRI3. The standard error for the estimated (averaged) signal strength in a given area is also given by the right hand side of Eq. [1]. In fact, the perceived SNR of an image is also related to both pixel SNR and pixel density, as illustrated in Figure 1 (image used from ref 4). One may then consider a new SNR metric that - compared to pixel SNR - is more directly related to detection, estimation, and perceived SNR, given by
$$SNR_{norm}\ =\ SNR_{pixel} \sqrt{pixel\ density} \ =\ \frac{SNR_{pixel}}{\sqrt{voxel\ volume}} \tag{2}$$
Consideration of Eq. [1] for detection, standard error of estimation, and (presumably) perception suggests that for all objects larger than a pixel, there is a pixel averaging of sorts (literal or perceptual) for these tasks. Such averaging has no effect on the value of Eqs. [1,2] and thus, presumably, on detection, estimation, or perceived SNR, at least in the presence of white noise. This does, however, suggest that the noise of low spatial frequencies may be more important than that of high spatial frequencies for these tasks. If true, then MRI sequences employing (e.g.) radial, spiral, and PROPELLER sampling methods may have some advantage in detection, estimation, and perceived SNR due to their concentration of noise power in the high frequencies (aka "red noise"). This is in spite of the known property that the nonuniform weighting of k-space data all of these sequences all employ decreases pixel SNR5.
METHODS
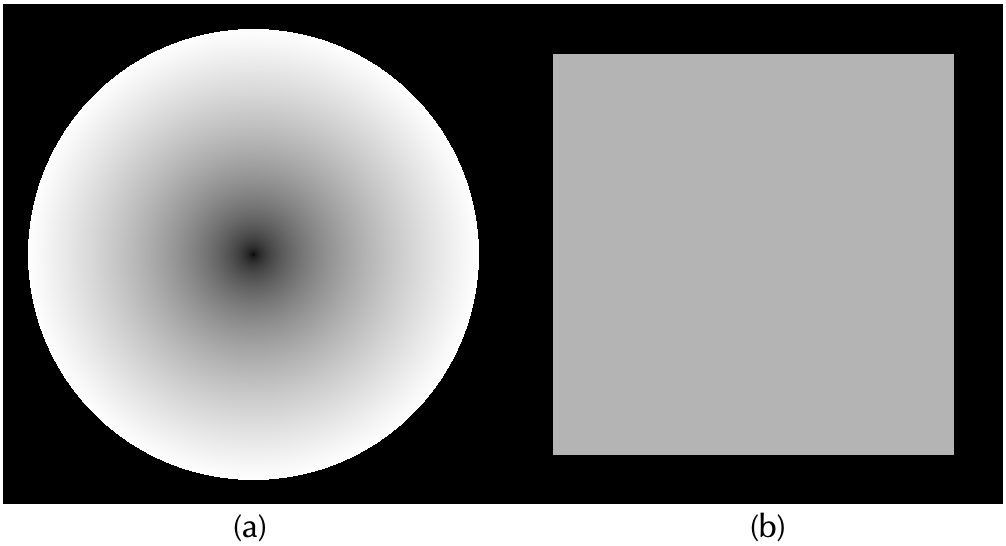
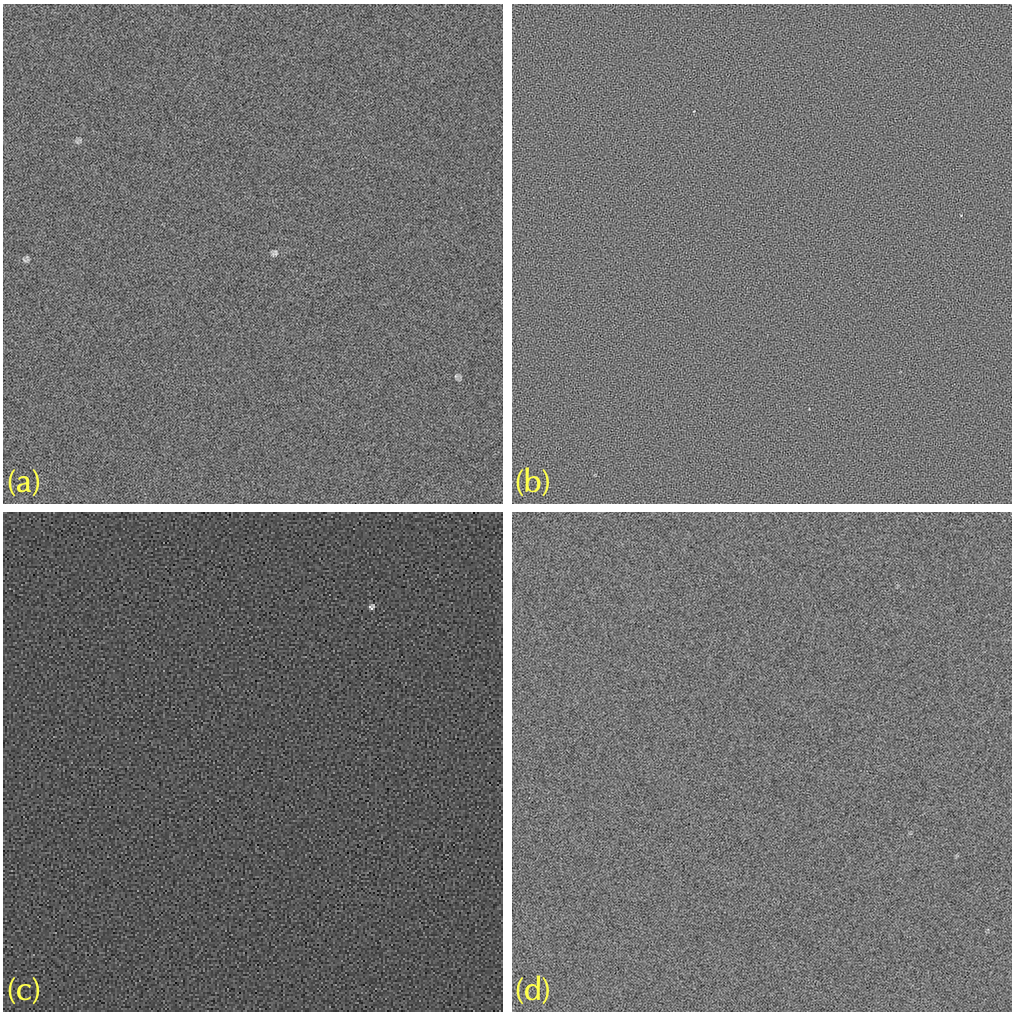
We synthesized 25 sets of 500x500 images with 1-6 circles. For each image, all circles had the same radius (1-4 pixels) and signal (1-4 units higher than the background signal of 5 units). We multiplied complex gaussian noise in k-space by masks corresponding to radial and Cartesian sampling with the same number of sampled lines, of equal durations (Fig. 2). The sampling areas were equal to simulate comparable resolution6, however these masks were not applied to the signal (circles). Cartesian noise was scaled to have a standard deviation of 1 unit in image space, and the radial noise (due to non-uniform sampling) had an image space standard deviation of 1.15 units. Twenty five pairs (radial and Cartesian) of 500x500 noise data were added to the circle images, and these 50 images were cropped in k-space to create 50 pixel-averaged 250x250 images. The four image sets were flipped and rotated differently and then combined in pseudorandom order. Ten volunteers inspected each of these 100 images (see Fig. 3) and reported how many circles they could confidently detect.RESULTS
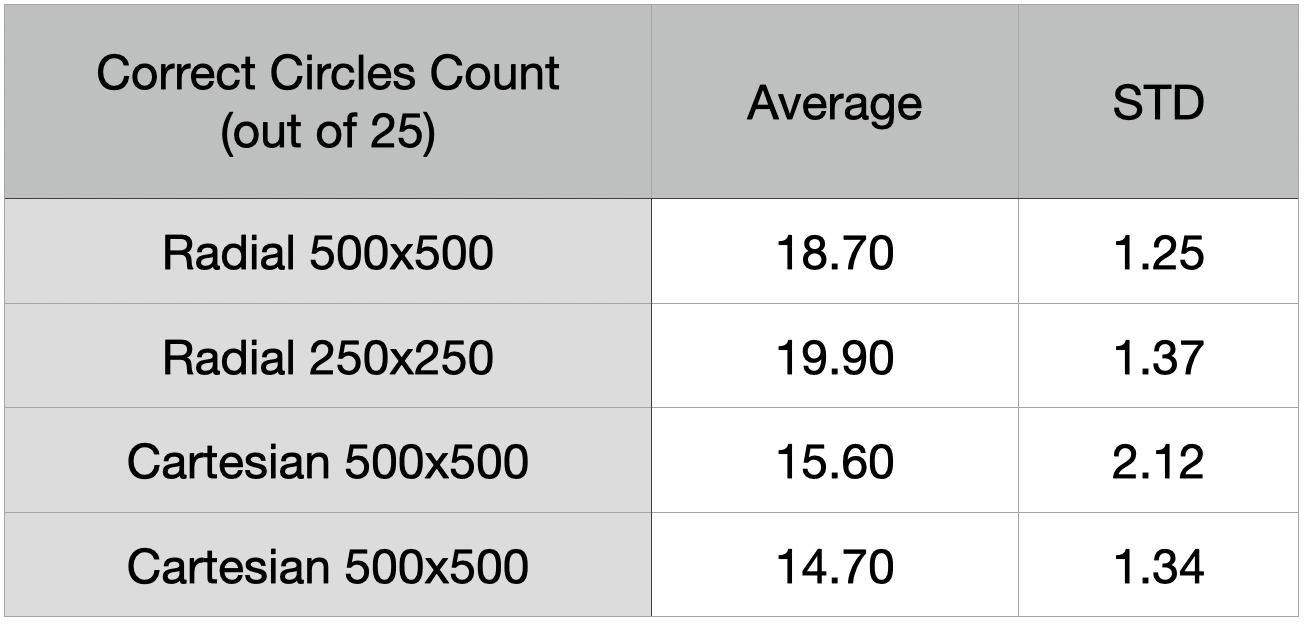
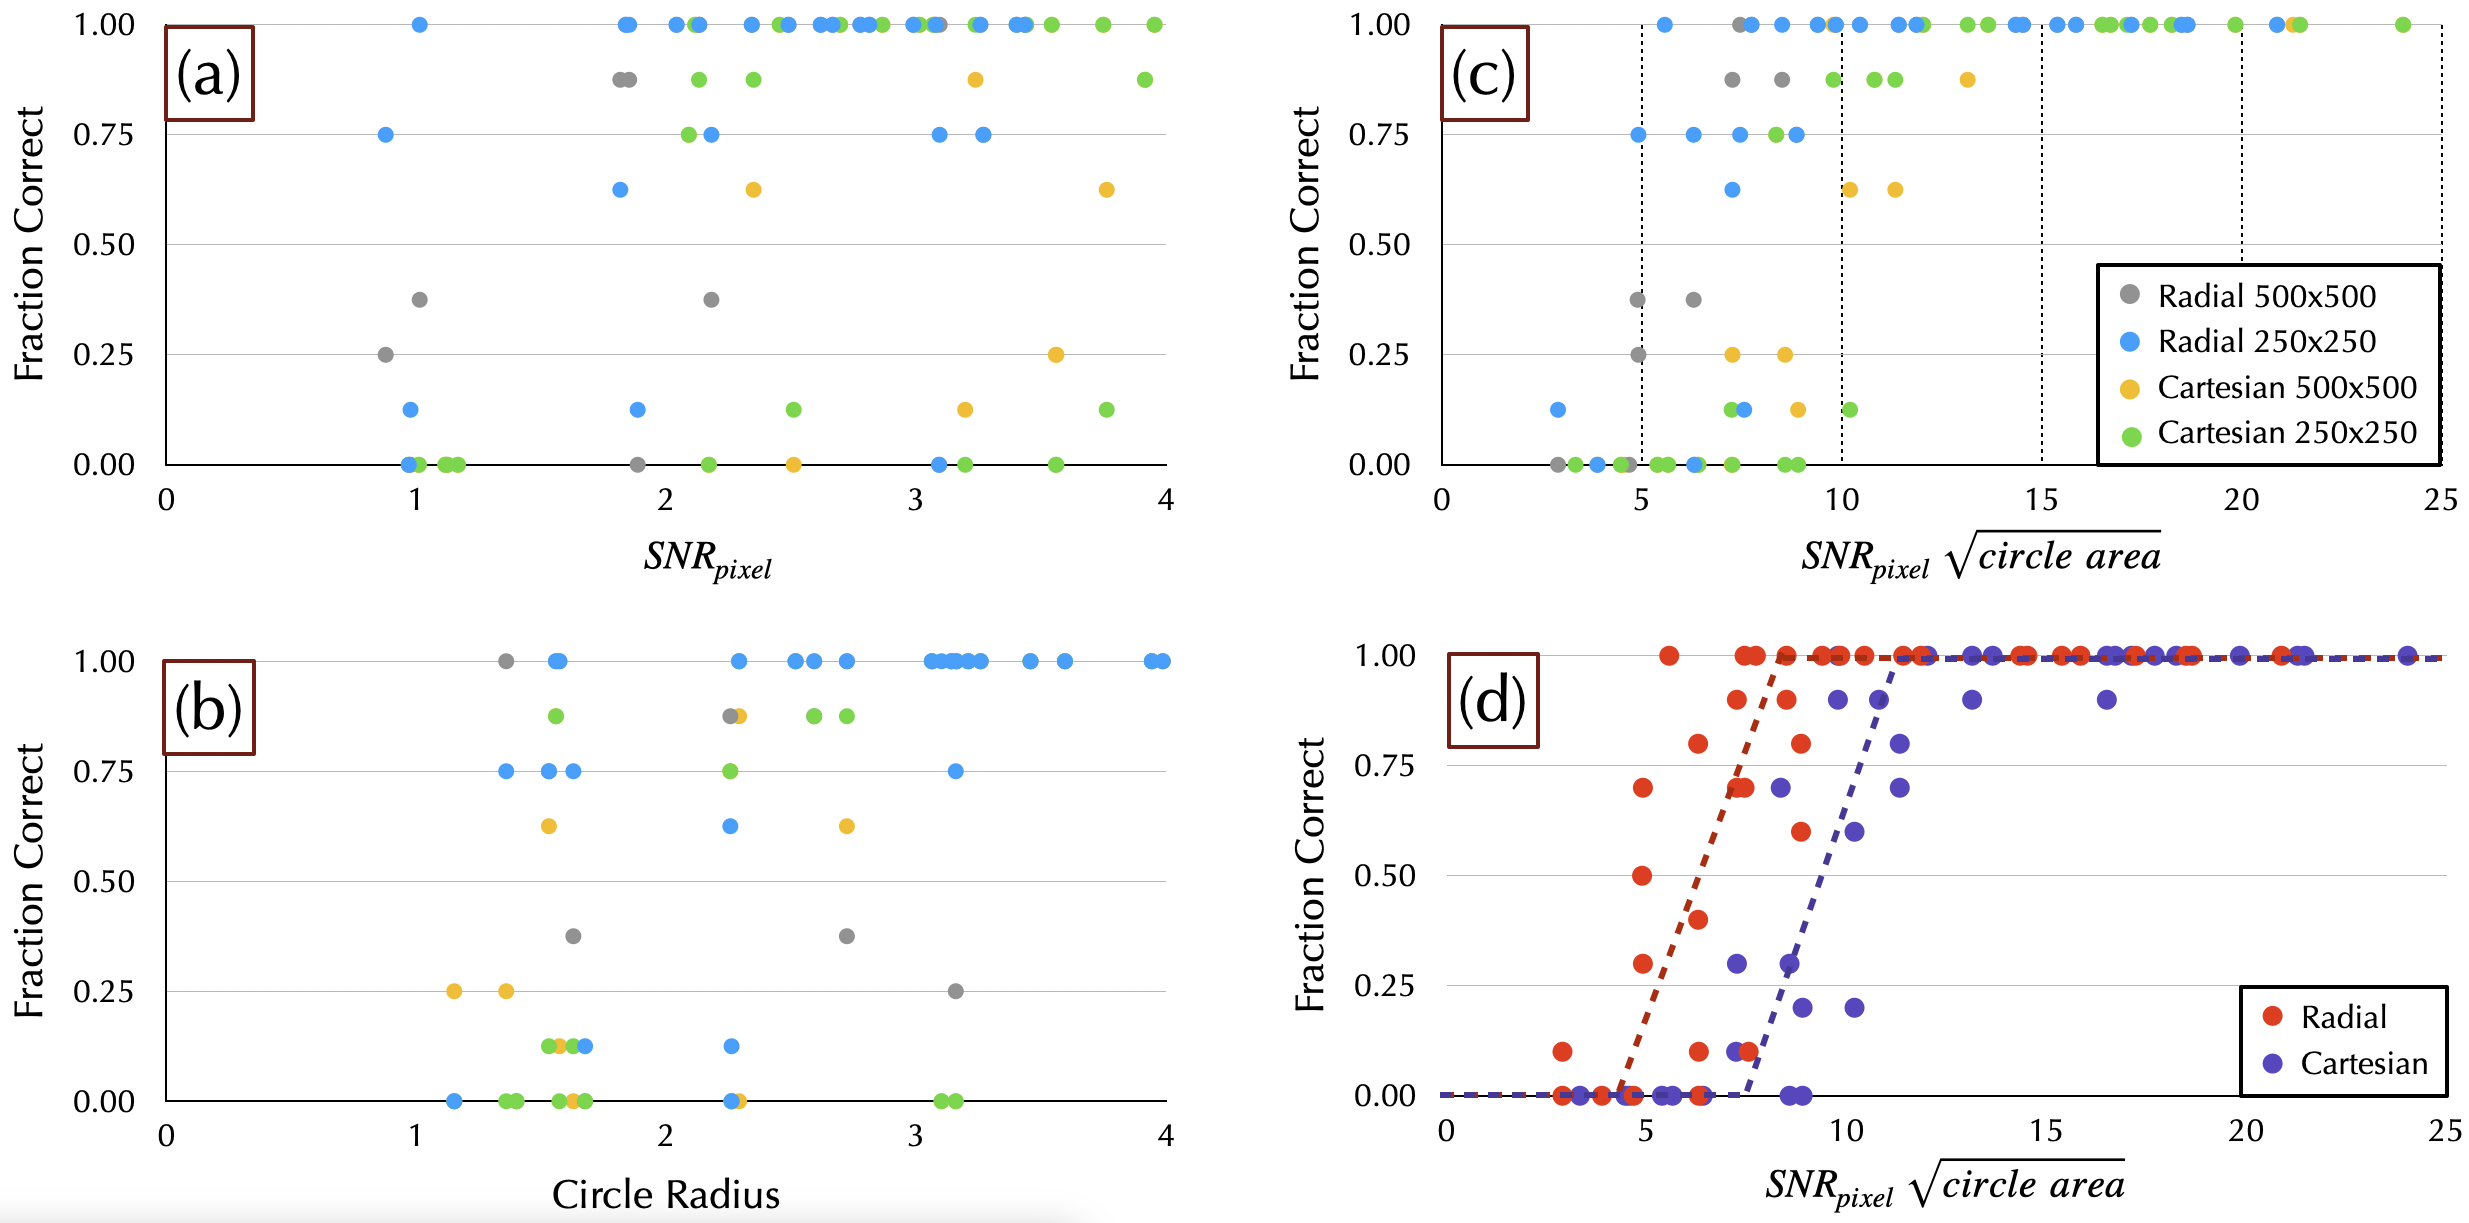
Table 1 shows the answer statistics for correct circle count between the 10 observers. Every observer gave more correct answers for either radial imaging set than for either Cartesian imaging set. Using a T-test, detection was significantly higher for radial than cartesian for 500x500 images (p=0.0009). Cropping to 250x250 produced slightly increased detection than 500x500 for radial images (p=0.056) and slightly decreased detection for Cartesian images (p=0.27). Figure 4 shows that detection rates had little correlation with pixel SNR alone, or circle radius alone, however they did have a strong dependence on the metric of Eq. [1].DISCUSSION & CONCLUSION
Our results agree with previous findings that Eq. [1] is a better predictor of detection than pixel SNR, as well as giving the standard error in signal estimation. We also assert that it is a better predictor of perceived SNR. The new SNR metric of Eq. [2] may be much more relevant and more decoupled from resolution than pixel SNR. It does not yet reflect noise color, which is important. Despite having worse pixel SNR, the red noise structure of radial imaging significantly improved detection over the white noise of Cartesian sampling. It seems likely that the optimal noise k-space variance for a given feature may be inversely proportional to the k-space energy profile, acting as a matched filter. If true, how this may be optimized for a wide range of features for human perception, nonlinear reconstruction, and computer-based analysis will be the subjects of future studies.Acknowledgements
The author is grateful to Rianne Van Der Heijden, Sheena Chu, Thekla Oechtering, Srijyotsna Volety, Garrett Fullerton, Julia Velikina, Jessica Robbins, Diego Hernando, Ali Pirasteh, and Scott Reeder for acting as observers and sparking interesting conversations.
References
1. Constable RT, Henkelman RM. Contrast, resolution, and detectability in MR imaging. Journal of Computer Assisted Tomography. 1991 Mar-Apr;15(2):297-303. DOI: 10.1097/00004728-199103000-00021. PMID: 2002111.
2. Burgess AE. The Rose model, revisited. J Opt Soc Am A Opt Image Sci Vis. 1999 Mar;16(3):633-46. doi: 10.1364/josaa.16.000633. PMID: 10069050.
3. Watts R, Wang Y. k-space interpretation of the Rose Model: noise limitation on the detectable resolution in MRI. Magn Reson Med. 2002 Sep;48(3):550-4. doi: 10.1002/mrm.10220. PMID: 12210924.
4. Edlow, B.L., Mareyam, A., Horn, A. et al. 7 Tesla MRI of the ex vivo human brain at 100 micron resolution. Sci Data 6, 244 (2019). https://doi.org/10.1038/s41597-019-0254-8
5. Pipe JG, Duerk JL. Analytical resolution and noise characteristics of linearly reconstructed magnetic resonance data with arbitrary k-space sampling. Magn Reson Med. 1995 Aug;34(2):170-8. doi: 10.1002/mrm.1910340207. PMID: 7476075.
6. Van Gelderen P. Comparing true resolution in square versus circular k-space sampling. In: Proceedings of the Anunual Meeting of ISMRM. Sydney, Australia; 1998:424.
Figures