4276
An Updated Quality Assurance Pipeline Addressing Nyquist Ghosting for 7T fMRI1Center for MRI Research, Peking University, Beijing, China
Synopsis
Keywords: Artifacts, High-Field MRI, Quality Assurance, 7T fMRI, phantom
Motivation: The quality of the high-resolution fMRI relies on the stability and high-performance of the ultra-high field scanners. A standardized quality assurance (QA) pipeline for 7T scanners is urgently needed.
Goal(s): We aimed to establish a comprehensive QA pipeline for 7T fMRI to monitor the stability and performance of scanners.
Approach: First, we designed an agar phantom for 7T fMRI. Second, we optimized the scanning parameters for high-resolution fMRI. Third, we developed an analysis program for QA report addressing Nyquist ghosting.
Results: The Nyquist ghosting rate reflected the phase error during acquisition. The QA metrics described the stability and performance of the scanner.
Impact: We firstly provide the QA pipeline for 7T high-resolution fMRI. The daily QA scanning routine serves as a valuable tool to monitor the stability and high-performance of the scanners, thereby contributing to the overall quality control of fMRI data.
Introduction
Ultra-high field functional MRI (fMRI) could achieve higher spatial resolution and increased signal-to-noise ratio (SNR) in neuroscience research, enabling a deeper exploration of brain function 1,2. The quality of the fMRI data heavily relies on the stability and high-performance of the scanners. A standardized QA pipeline for 7T high-resolution fMRI is urgently needed. Previous research has developed a QA protocol in 1.5T/3T systems 3. In 7T systems, Nyquist ghosting is more serious due to the phase error during data acquisition. However, Nyquist ghosting is not a concern in previous research. The aim of the study is to provide a QA pipeline addressing Nyquist ghosting for 7T fMRI, including the recipe of the agar phantom, the configuration of scanning protocol, and the analysis of acquisition data to quantify the hardware performance.Methods
Agar PhantomWe designed a 3D-printed 17-cm-diameter sphere shell with resin (https://github.com/byronphy/QA-7T-fMRI/blob/main/sphere_phantom.stl). To mimic the T1, T2, and RF load of the brain at 7T (where T1 values for white and gray matter are approximately 1220 ms and 2132 ms 4, and T2 values are about 45.9 ms and 55.0 ms, respectively 5), we experimented with different concentrations of NaCl and NiCl2 in agar. Measurements of T1 and T2 were done by the inversion recovery spin echo sequence and the multi-echo spin echo sequence.
QA Protocol
The QA fMRI data was acquired using 7T MRI (MAGNETOM Terra, Siemens Healthcare, Erlangen, Germany) with the Nova Medical 8Tx/32Rx head coil at the Center for MRI Research, Peking University. The parameters of the gradient-echo echo planar imaging (GE-EPI) protocol can be found on GitHub (https://github.com/byronphy/QA-7T-fMRI/blob/main/QA_7T_fMRI_protocol.pdf). The resolution is 1.5 mm × 1.5 mm × 1.5 mm.
QA Metrics
We developed a Python program (https://github.com/byronphy/QA-7T-fMRI/blob/main/QA_Report.py) to analyze the data automatically and generate a QA report within 30 seconds. The detailed definitions of the QA metrics and the abbreviations are listed in Table 1.
Results
Agar PhantomThe measurements of the relaxation time in the human brain and different phantoms are shown in Figure 1. In the human brain, the T1 values for white and gray matter are approximately 1094.24 ms and 1911.23 ms, and T2 values are about 52.61 ms and 55.90 ms, respectively. To best simulates the relaxation time in the human brain, the recipe consists of agar at a concentration of 3 g per 100 mL H2O and NaCl at 85.54 mM, without the addition of NiCl2.
QA Metrics
The overall QA metrics are shown in Figure 2. In 7T fMRI, the artifacts mainly come from the inhomogeneities of the B0/B1 field and the Nyquist ghosting due to phase error, which might be caused by eddy currents. In this experiment, the Nyquist ghosting rate was about 3.4% and increased along scanning time as shown in Figure 4. TFN should ideally be minimized to less than 20. Higher SFNR and tSNR indicate a more favorable temporal fluctuation limit. The SSN map, which characterizes spatial noise, should show no discernible structures or geometry, because it represents the spatially random noise.
The detail of other maps and analysis is shown in Figure 3 and Figure 4. The observed signal drift in the time-series arises from the heating of the gradient coils 6. The drifted B0 field leads to reduced efficiency of the excitation pulse and the shift of the fat-suppression pulse towards the water peak, ultimately causing a decrease in the magnetization of excited spins. Percent fluctuation less than 0.10% is acceptable, falling below the expected BOLD changes which can range up to several percent 3. The fluctuation distribution should resemble a normal distribution when the scanner is stable. The Fourier spectrum could identify the specific instabilities, such as the cold head running at 1 to 2 Hz.
Discussion
In 7T systems, Nyquist ghosting is serious, and it reflects the phase error during acquisition. In our approach to QA analysis, we are concerned about the Nyquist ghosting in 7T. We update the recipe by comparing the relaxation time between the agar phantoms and the human brain. These improvements make the QA pipeline more practical in 7T fMRI. Future research should be concerned about more quantities such as the inhomogeneity of the mean signal intensity image.Conclusion
This study provides a comprehensive QA pipeline for 7T fMRI, enabling systematic monitoring of scanner performance. The pipeline has been shared the pipeline on GitHub (https://github.com/byronphy/QA-7T-fMRI/tree/main) for broader accessibility and future research endeavors.Acknowledgements
No acknowledgement found.References
1. Bandettini P A, Bowtell R, Jezzard P, et al. Ultrahigh field systems and applications at 7 T and beyond: progress, pitfalls, and potential. Magnetic Resonance in Medicine, 2012, 67(2): 317-321.
2. Yacoub E, Shmuel A, Pfeuffer J, et al. Imaging brain function in humans at 7 Tesla. Magnetic Resonance in Medicine: An Official Journal of the International Society for Magnetic Resonance in Medicine, 2001, 45(4): 588-594.
3. Friedman L, Glover G H. Report on a multicenter fMRI quality assurance protocol. Journal of Magnetic Resonance Imaging: An Official Journal of the International Society for Magnetic Resonance in Medicine, 2006, 23(6): 827-839.
4. Rooney W D, Johnson G, Li X, et al. Magnetic field and tissue dependencies of human brain longitudinal 1H2O relaxation in vivo. Magnetic Resonance in Medicine: An Official Journal of the International Society for Magnetic Resonance in Medicine, 2007, 57(2): 308-318.
5. Yacoub E, Duong T Q, Van De Moortele P F, et al. Spin‐echo fMRI in humans using high spatial resolutions and high magnetic fields. Magnetic Resonance in Medicine: An Official Journal of the International Society for Magnetic Resonance in Medicine, 2003, 49(4): 655-664.
6. Vos S B, Tax C M W, Luijten P R, et al. The importance of correcting for signal drift in diffusion MRI. Magnetic resonance in medicine, 2017, 77(1): 285-299.
Figures
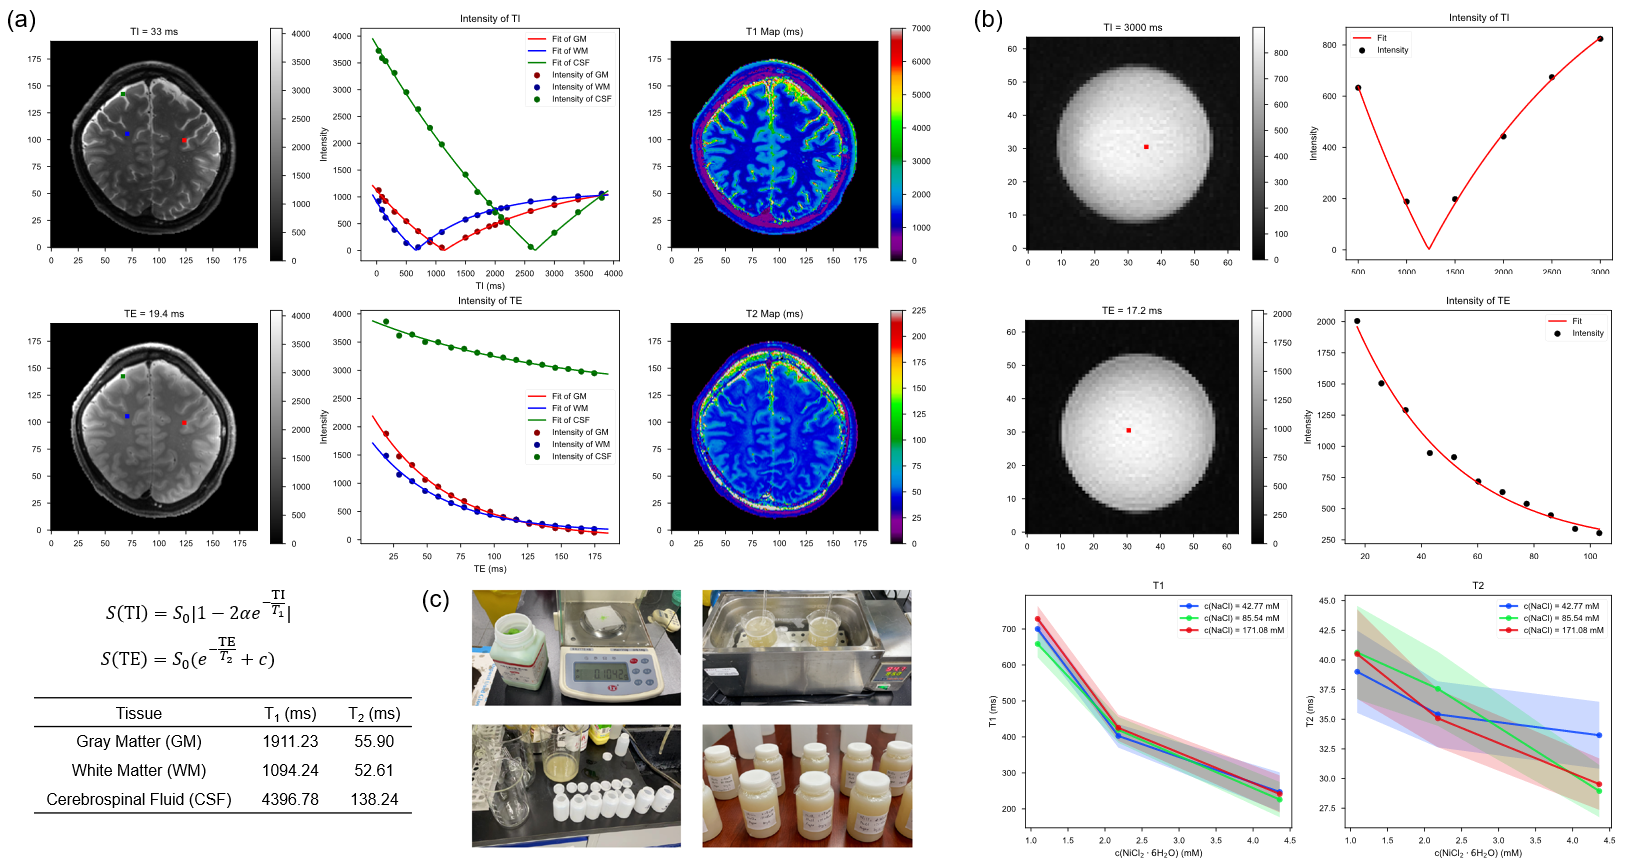
Figure 1: Relaxation time measurement of the human brain and phantom with different concentrations of NaCl and NiCl2. (a) T1 and T2 map of a slice of human brain. (b) T1 and T2 fitting in the phantom. (c) Making different phantoms. T1 and T2 are varied by the concentrations of NaCl and NiCl2.
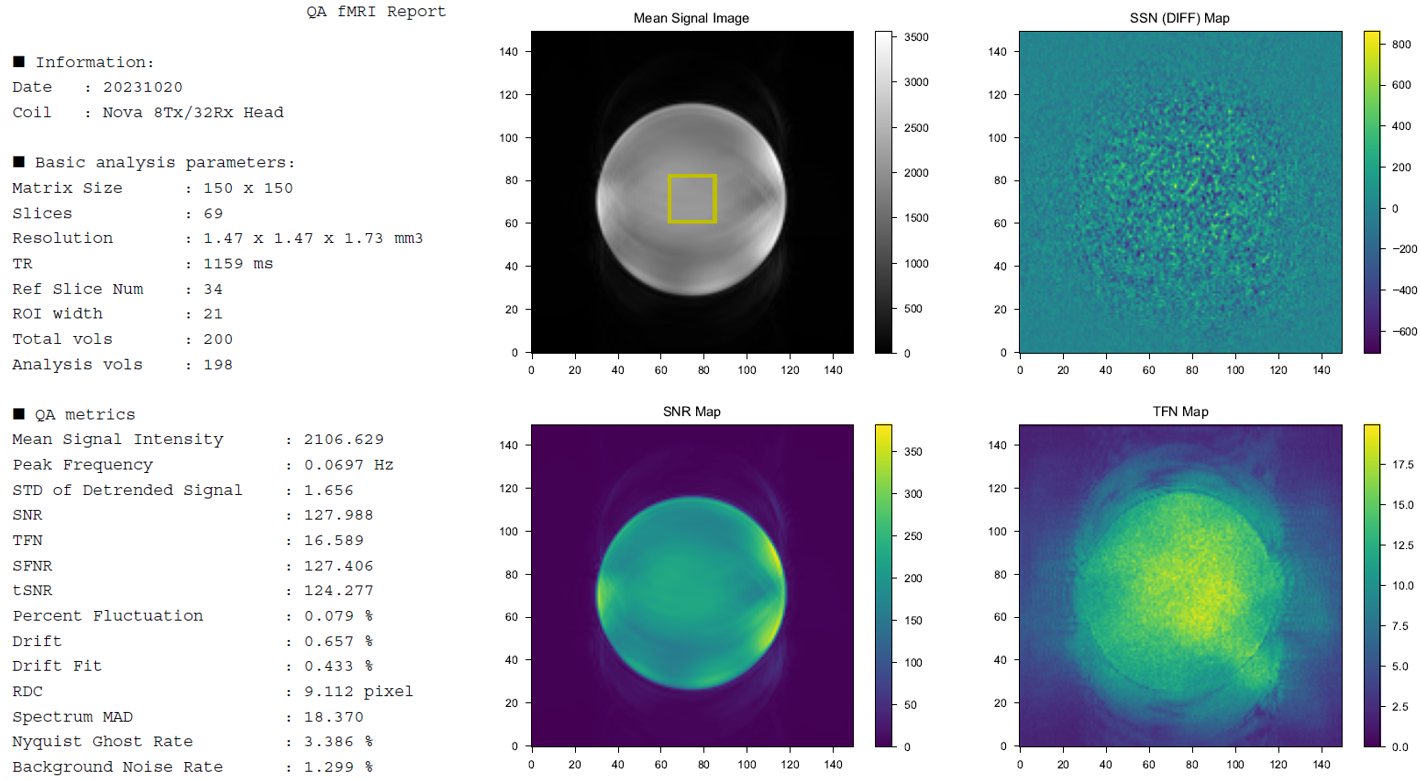
Figure 2: Left: Calculated QA metrics (Mean Signal Intensity, Peak Frequency, STD of Detrended Signal, SNR, TFN, SFNR, tSNR, Percent Fluctuation, Drift, Drift Fit, RDC, Spectrum MAD, Nyquist Ghost Rate, and Background Noise Rate). Right: mean signal image, SSN map, SNR map, and TFN map.
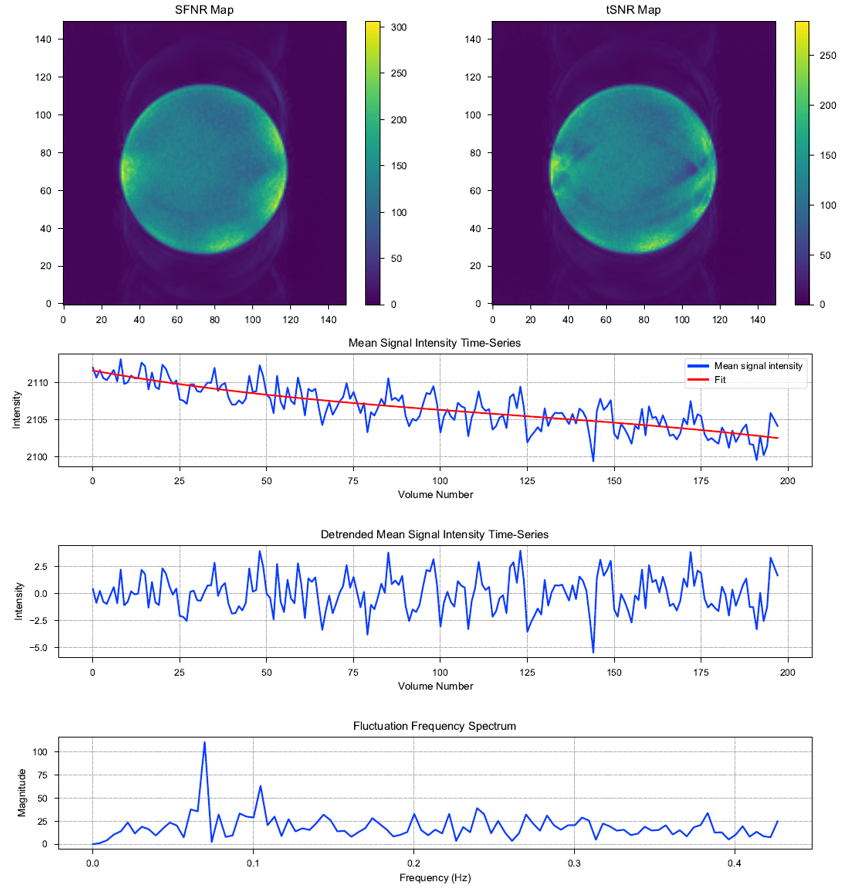
Figure 3: Top: SFNR map, and tSNR map. Down: line charts of analyzed data, including mean signal intensity time-series and its trend fitting, detrended mean signal intensity time-series, the fluctuation frequency spectrum from FFT of the time-series.
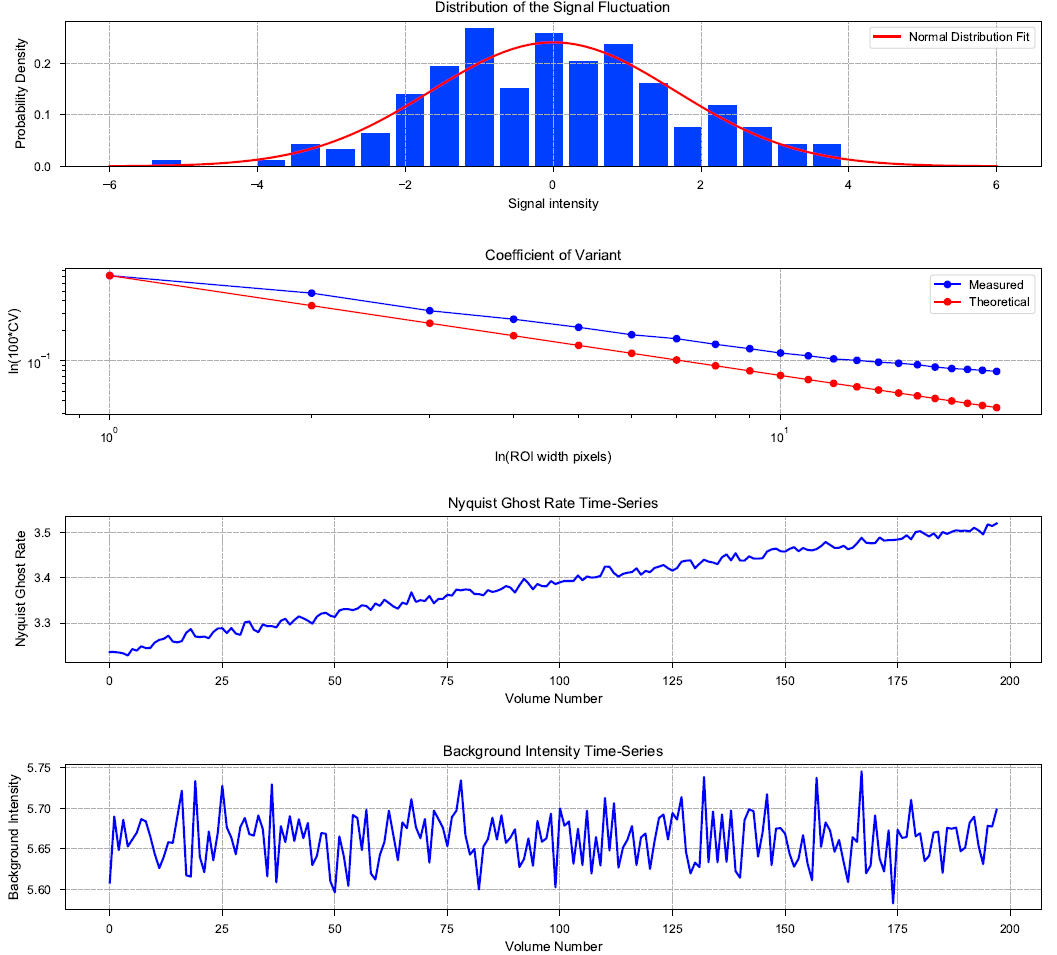
Figure 4: Line charts of analyzed data, including the distribution of the signal fluctuation that should be well-fitted to normal distribution, the Weisskoff analysis, Nyquist ghost rate time-series, and background intensity time-series. Weisskoff analysis shows that the CV varies as the ROI width increases, indicating the intervoxel correlations. The Nyquist ghosting rate increases over time, while still below 5%, indicating the phase error from the scanner.
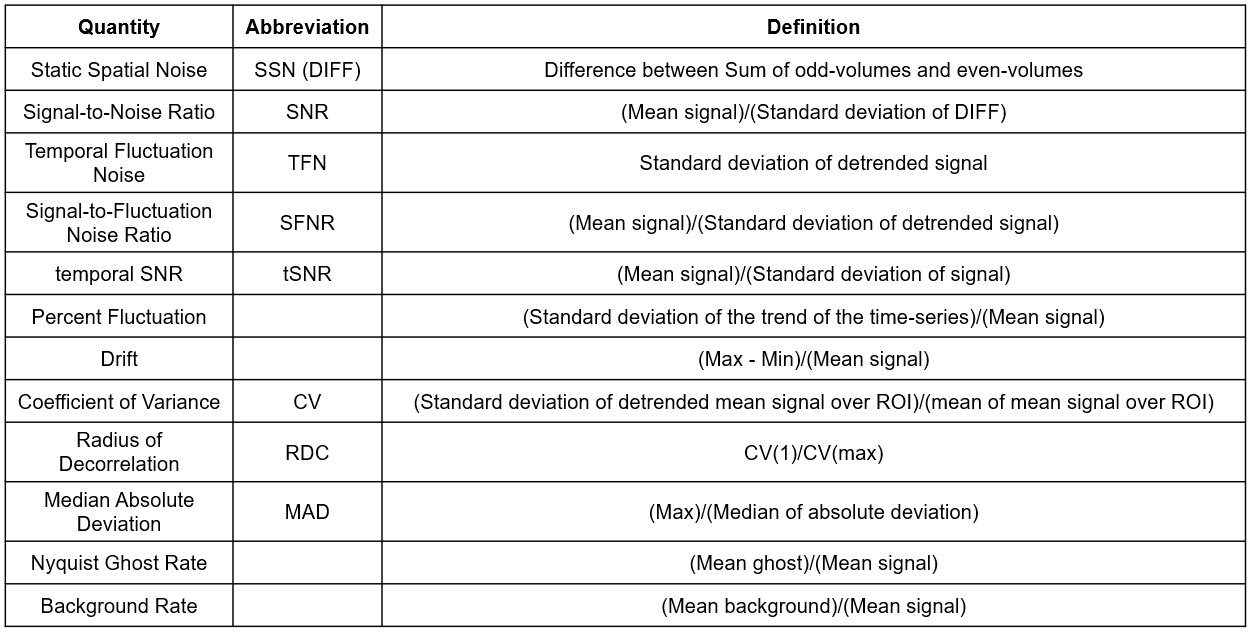
Table 1: The definitions of the QA metrics.