4268
RESOLVE for simultaneous mapping high-frequency conductivity and micro-structure parameters in conductivity tensor imaging (CTI)1Shenzhen University, Shenzhen, China, 2Radiology Department, Shenzhen University General Hospital and Shenzhen University Clinical Medical, Shenzhen University General Hospital, Shenzhen, China, 3Siemens Healthineers, Guangzhou, China, Siemens Healthineers, Shenzhen, China
Synopsis
Keywords: Quantitative Imaging, Electromagnetic Tissue Properties, Biomarkers
Motivation: Conventional two sequences acquisition in conductivity tensor imaging (CTI) can cause geometric mismatch between two acquisition data which may influence subsequent reconstruction.
Goal(s): We aim to simultaneously reconstruct the high-frequency conductivity and to fit microstructure parameters with data from single sequence.
Approach: We propose a novel data acquisition strategy which reconstructs the high-frequency conductivity from the phase of non-diffusion weighted data of RESOLVE.
Results: The reconstructed high-frequency conductivity and fitted microstructure parameters has matched geometric images, and the low-frequency conductivity can be successfully reconstructed.
Impact: We show the conventional two sequence acquisition is reduced to the single sequence acquisition which avoids the geometric mismatch and obtains higher precision of low-frequency conductivity.
Introduction
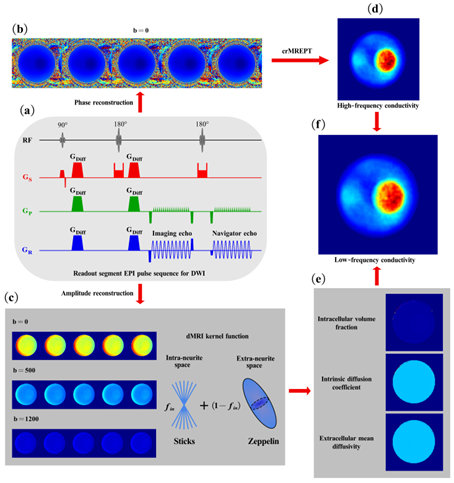
Electrical conductivity characterizes how electrical currents propagate in biological tissues. and it is influenced by the frequency, ion mobility, ion concentration, and cell shapes, and cell membranes [1]. The property of electrical conductivity may be altered in the presence of pathological conditions, such as stroke and tumors [2, 3]. Meanwhile, the low-frequency conductivity tensor of human brain can realize patient-specific volume conductor models for neuroimaging and electrical stimulation. Recently, a novel low-frequency conductivity tensor imaging (CTI) technique [4], which combined MREPT measurement with multi-b-valued DWI data had been proposed. In previous studies [5, 6], the high-frequency conductivity was reconstructed from the transceive phase acquired by fast spin-echo (FSE) sequence, while the micro-structure parameters were fitted to diffusion-weighted data acquired by the single-shot diffusion-weighted EPI sequence. However, it is sometimes difficult to guarantee matched geometric distortion between transceive phase and diffusion-weighted images. We proposed a novel data acquisition strategy which simultaneously mapped the high-frequency conductivity and micro-structure parameters with the RESOLVE sequence in CTI. With proposed method, the geometric mismatch in conventional acquisition strategy could be eliminated.Methods
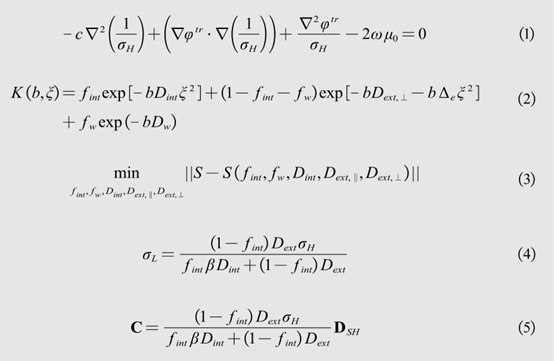
High-frequency conductivity reconstruction with cr-MREPTThe phase-based cr-MREPT formula is given in Figure 1.(1) [7], where φtr = φ+ + φ- is the transceive phase. The artificial diffusion term c is added to the convection reaction equation-based MREPT formula.
Multi-compartment microscopic diffusion imaging model
We use the standard three-compartment model [8], whose kernel functional is shown in Figure 1.(2) where fint is the intra-neurite volume fraction, fw is the free water volume fraction, Dint is the intrinsic diffusion coefficient, Δe=Dext,∥-Dext,⊥,Dext,∥ is the extra-neurite parallel diffusivity, Dext,⊥ is the extra-neurite perpendicular diffusivity. ξ2 = cos2θ. Using nonlinear least square fitting (see Figure 1.(3)), micro-structure parameters fint,fw,Dint,Dext,∥ ,Dext,⊥ can be obtained.
Low-frequency mean conductivity
According to the literature [6], the low-frequency mean conductivity can be expressed by Figure 1.(4), where Dext is the extracellular mean diffusivity, β is the ion concentration ratio of intracellular and extracellular spaces.
Low-frequency anisotropic conductivity tensor
Similar to the literature [6], the low-frequency anisotropic conductivity tensor can be expressed as by Figure 1.(5), where Dsh denotes the spherical harmonic (SH) coefficients of ODF. The overview of the proposed algorithm is shown in Figure 2.
Hollow Polypropylene fibre phantom experiment
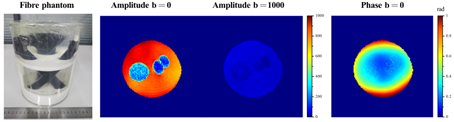
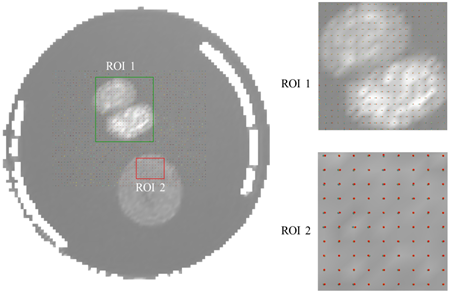
Hollow Polypropylene yarns were used to fabricate the fibre buddle. Three fibre buddles are immersed in the 0.8% NaCl solution shown in figure 2. Imaging experiment was performed using a Siemens Prisma scanner equipped with 64-channel head-neck coil. The MR data was acquired by RESOLVE with the following parameters: TR/TE = 5640 / 44ms; in-plane FOV = 220 mm × 220 mm; voxel size = 1.7×1.7×3 mm3; number of slices =35; number of shot = 5; 1 b0 image; diffusion-weighting images with b-values of 1000, 2000 s/mm2 and 30 gradient directions per b-value. The amplitude and phase data were reconstructed from vendor retrospective reconstruction software tool.
Results
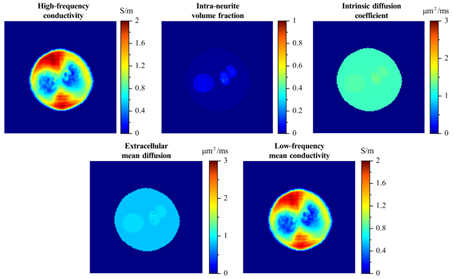
The amplitude image of b = 0, 1000 s/mm2 is shown in the middle panel of figure 3. while the phase image of b = 0 s/mm2 is shown in right panel of figure 2. High-frequency conductivity, micro-structure parameters, low-frequency mean conductivity are respectively shown in Figure 4. The intra-neurite volume fraction of fibre is slightly larger than the free water, which may lead to the lower low-frequency conductivity than high-frequency conductivity. The conductivity orientation distribution function (ODF) is shown in Figure 5.Discussion
In the conventional method, multi-echo spin echo and single-shot EPI sequences were respectively used to acquire phase and diffusion weighted data, which may lead to geometric mismatch in the final low-frequency conductivity. Compare to the conventional method, the proposed method only utilized single multi-shot EPI sequence. The phase is reconstructed from the complex image of b0, thus the phase and amplitude images had the matched geometric distortion. Moreover, we designed a fibre phantom aimed to map the anisotropic distribution. Instead of using second order tensor, we used truncated two order SH coefficient which could reconstruct fibre crossing with four or six order.Conclusion
The performance of a novel data acquisition method to produce the low-frequency conductivity is validated using an anisotropic fibre conductivity phantom. The proposed method has the advantages of simple post-processing and higher potential clinical application.Acknowledgements
No acknowledgement found.References
1 Grimnes, S., and Martinsen, Ø.G.: ‘Chapter 7 - Electrodes’, in Grimnes, S., and Martinsen, Ø.G. (Eds.): ‘Bioimpedance and Bioelectricity Basics (Third Edition)’ (Academic Press, 2015), pp. 179-254
2 Shin, J., Kim, M.J., Lee, J., Nam, Y., Kim, M.-o., Choi, N., Kim, S., and Kim, D.-H.: ‘Initial study on in vivo conductivity mapping of breast cancer using MRI’, Journal of Magnetic Resonance Imaging, 2015, 42, (2), pp. 371-378
3 Jensen-Kondering, U., Shu, L., Böhm, R., Jansen, O., and Katscher, U.: ‘In-vivo pilot study at 3 Tesla: Feasibility of Electric Properties Tomography in a rat model of stroke’, Physics in Medicine, 2020, 9, pp. 100024
4 Sajib, S.Z.K., Kwon, O.I., Kim, H.J., and Woo, E.J.: ‘Electrodeless conductivity tensor imaging (CTI) using MRI: basic theory and animal experiments’, Biomedical Engineering Letters, 2018, 8, (3), pp. 273-282
5 Katoch, N., Choi, B.K., Sajib, S.Z.K., Lee, E., Kim, H.J., Kwon, O.I., and Woo, E.J.: ‘Conductivity Tensor Imaging of In Vivo Human Brain and Experimental Validation Using Giant Vesicle Suspension’, IEEE Transactions on Medical Imaging, 2019, 38, (7), pp. 1569-1577
6 Jahng, G.-H., Lee, M.B., Kim, H.J., Je Woo, E., and Kwon, O.-I.: ‘Low-frequency dominant electrical conductivity imaging of in vivo human brain using high-frequency conductivity at Larmor-frequency and spherical mean diffusivity without external injection current’, NeuroImage, 2021, 225, pp. 117466
7 Gurler, N., and Ider, Y.Z.: ‘Gradient-based electrical conductivity imaging using MR phase’, Magnetic Resonance in Medicine, 2017, 77, (1), pp. 137-150
8 Novikov, D.S., Veraart, J., Jelescu, I.O., and Fieremans, E.: ‘Rotationally-invariant mapping of scalar and orientational metrics of neuronal microstructure with diffusion MRI’, NeuroImage, 2018, 174, pp. 518-538
Figures