4261
MR-guided image enhancement for whole-brain low-dose PET/MR imaging using spatial brain transformation1Lauterbur Research Center for Biomedical Imaging, Shenzhen Institute of Advanced Technology, Chinese Academy of Sciences, Shenzhen, China, 2Department of Medical Imaging, Henan Provincial People's Hospital & People's Hospital of Zhengzhou University, Zhengzhou, China, 3Key Laboratory of Biomedical Imaging Science and System, Chinese Academy of Sciences, Shenzhen, China
Synopsis
Keywords: Artifacts, Data Processing
Motivation: The PET/MR system provides precise anatomical and functional information for neurological disorder detection.
Goal(s): To mitigate quality degradation caused by reduced radiation exposure of radiopharmaceuticals.
Approach: We proposed a 3D network with spatial brain transformation for whole-brain low-dose PET/MR imaging.
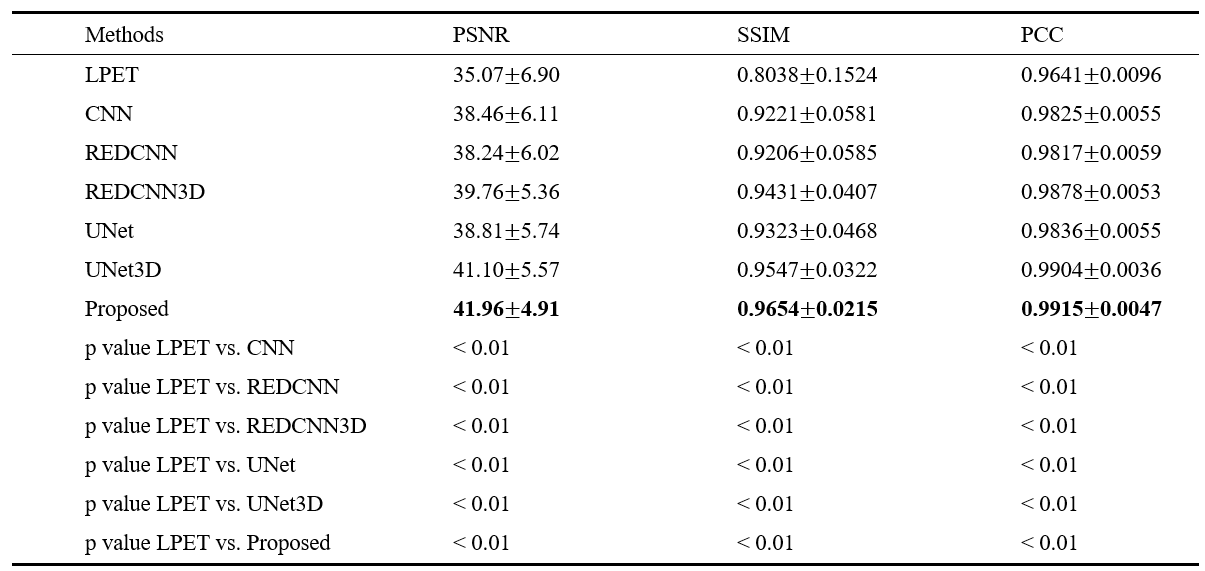
Results: The obtained PSNR and SSIM were 41.96 ± 4.91 dB (p<0.01) and 0.9654 ± 0.0215 (p<0.01), which achieved 19% and 20% improvement, respectively. The VOI analysis of brain regions showed more accurate standardized uptake value distributions. In the future, we hope to apply our method to other multimodal systems, such as PET/CT, to assist clinical brain disease diagnosis and treatment.
Impact: (1)
Our approach employs multimodal information fusion to enhance low dose PET/MR whole-brain
imaging.
(2) Our method considers spatial brain
anatomical alignment information, ensuring the consistency and accuracy of
imaging data within brain regions.
Introduction
The brain plays a pivotal role in the human body as the central command center, which governs essential functions such as perception or cognition [1-3]. The integrated PET/MR system is usually the preferred device for neurological and psychiatric disorder detection since it can provide metabolic and anatomical information simultaneously in whole-brain imaging [4]. Although PET/MRI has shown promise for improving our understanding of many neurological and psychiatric disorders, the administration of radiopharmaceutical tracers could increase the radiation risks for patients, but the reduction of the injection dose may result in increased image noise and decreased contrast [5-8]. In this work, we introduced spatial brain anatomical alignment information for PET/MR images through deep learning technology. By constructing the spatial brain transform module, we achieved the incorporation of multiple modal information with whole-brain image quality improvement.Materials and methods
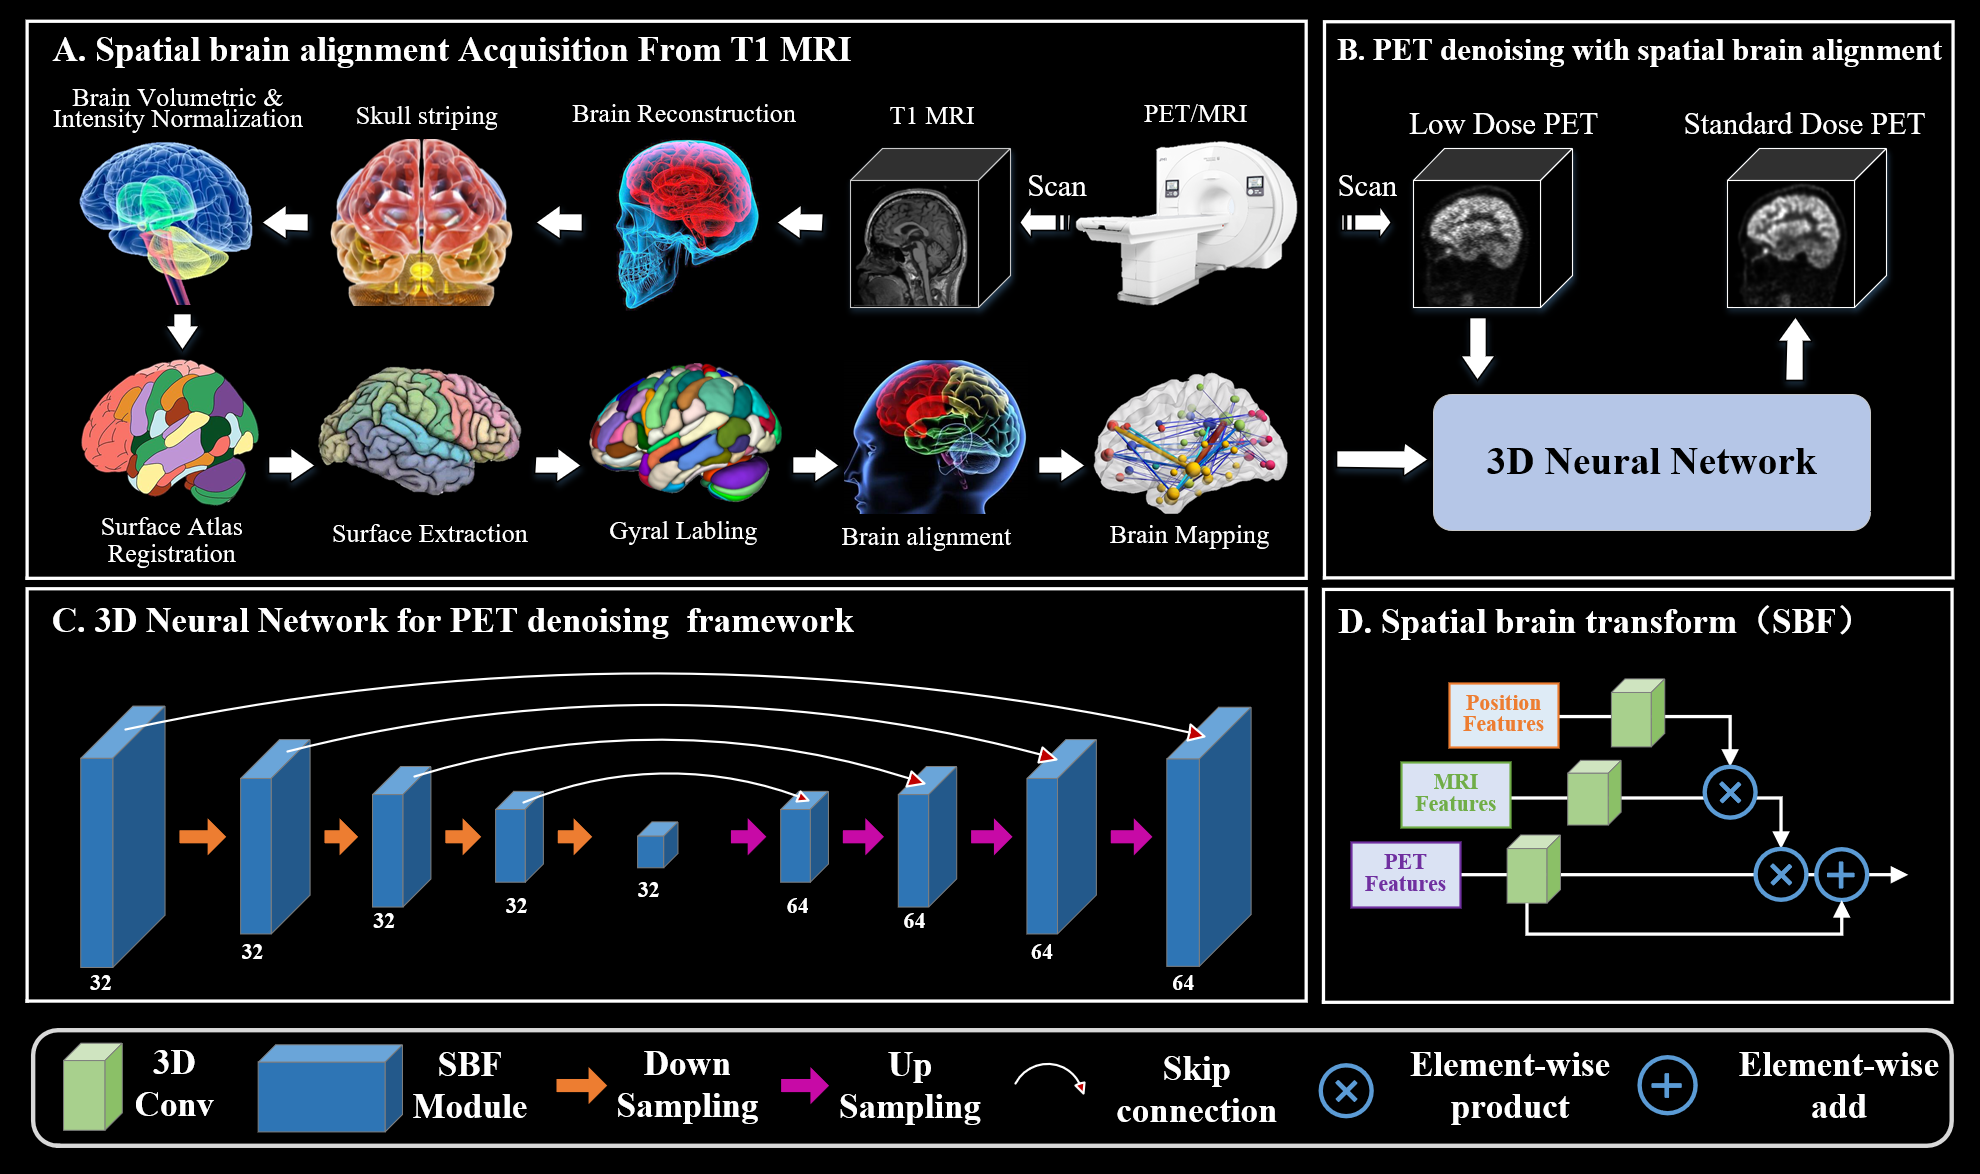
Patient Dataset: Patient data were acquired from Henan Provincial People’s Hospital, and 100 subjects (23 male, 77 female) were scanned by uPMR 790. The weight range of these patients was 63.24 ± 20.45. Before PET scanning, each patient needed to receive an intravenous 18F-fluorodeoxyglucose (18F-FDG) injection with an average injection dose of 234 MBq (range for 152 MBq to 365 MBq). All patients underwent head scanning once for 50-60 min (10 min) after tracer injection. Written informed consent was obtained from all subjects before participation in this study. Low-dose PET images were simulated and reconstructed with the OSEM algorithm as well. The PET images also shared matrix dimensions of 256 × 256 × 256 and voxel sizes of 1×1×1 mm.Method Implements: We have proposed an adaptive 3D neural network for whole-brain image quality improvement. To solve this task, we exploited the profitable anatomical information of MR images and introduced spatial brain anatomical alignment information for PET-MR images. By constructing the spatial brain transform (SBF) module, the incorporation of multiple modal information could be achieved, which is beneficial for restoring low-dose PET images. The overall workflow is shown in Figure 1. Data from 80, 10 and 10 patients were used as the training, validation and test datasets, respectively. The mean absolute error (MAE) was set as the loss function for network training, with ADAM serving as the network optimizer. The batch size was 32 with 500 epochs trained. The initial learning rate was fixed at 0.0001 and halved after every 200 epochs. All experiments were implemented with the PyTorch framework under Ubuntu 18.04 with an NVIDIA Quadro RTX 8000 GPU.
Data analysis: To verify the advantages of our method, we selected several commonly used deep learning methods for comparative analysis, including CNN, REDCNN, REDCNN3D, UNet and UNet3D. To be fair, these methods shared the same experimental environment and parameters. To assess the quality of the generated high-dose PET images, three common metrics were used for analyses: the peak signal-to-noise ratio (PSNR), structural similarity index measure (SSIM) and Pearson correlation coefficient (PCC).
Results
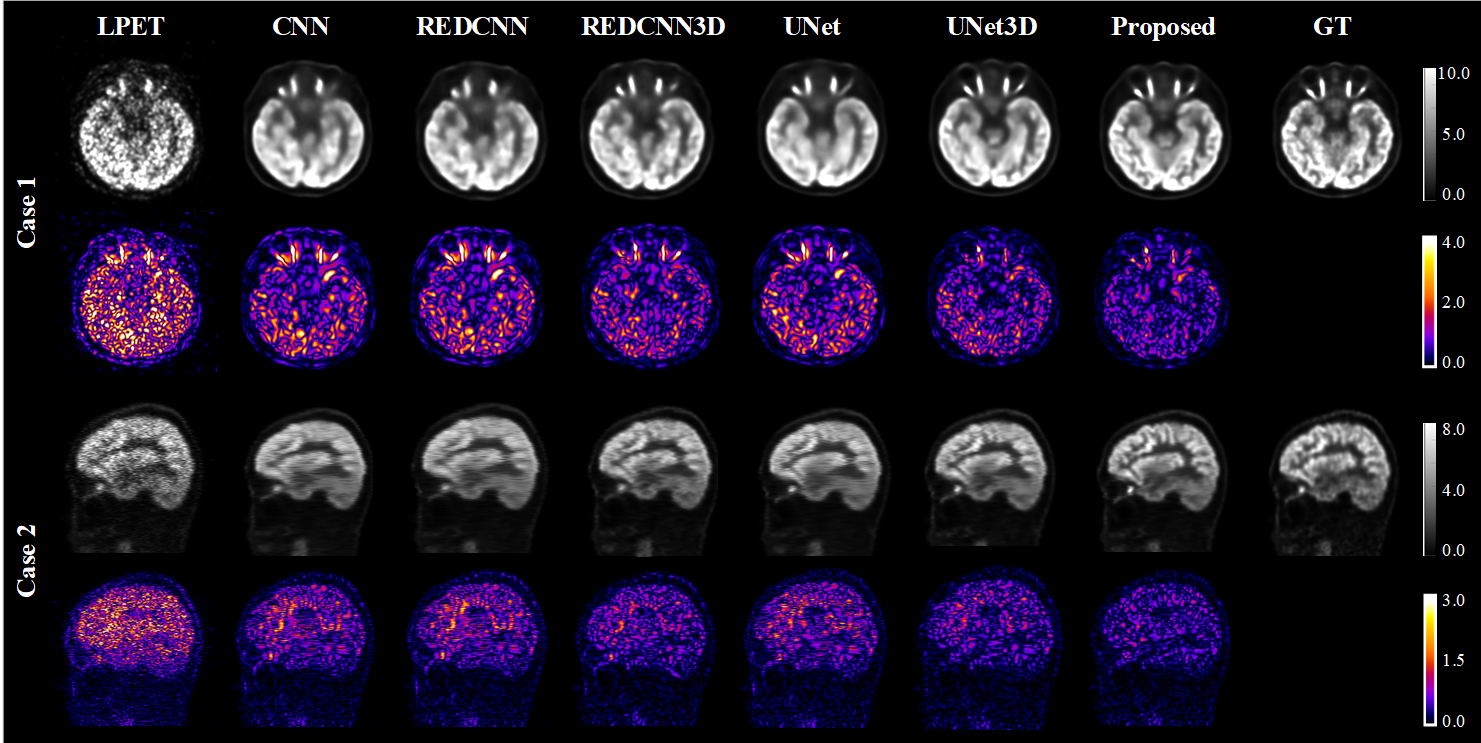
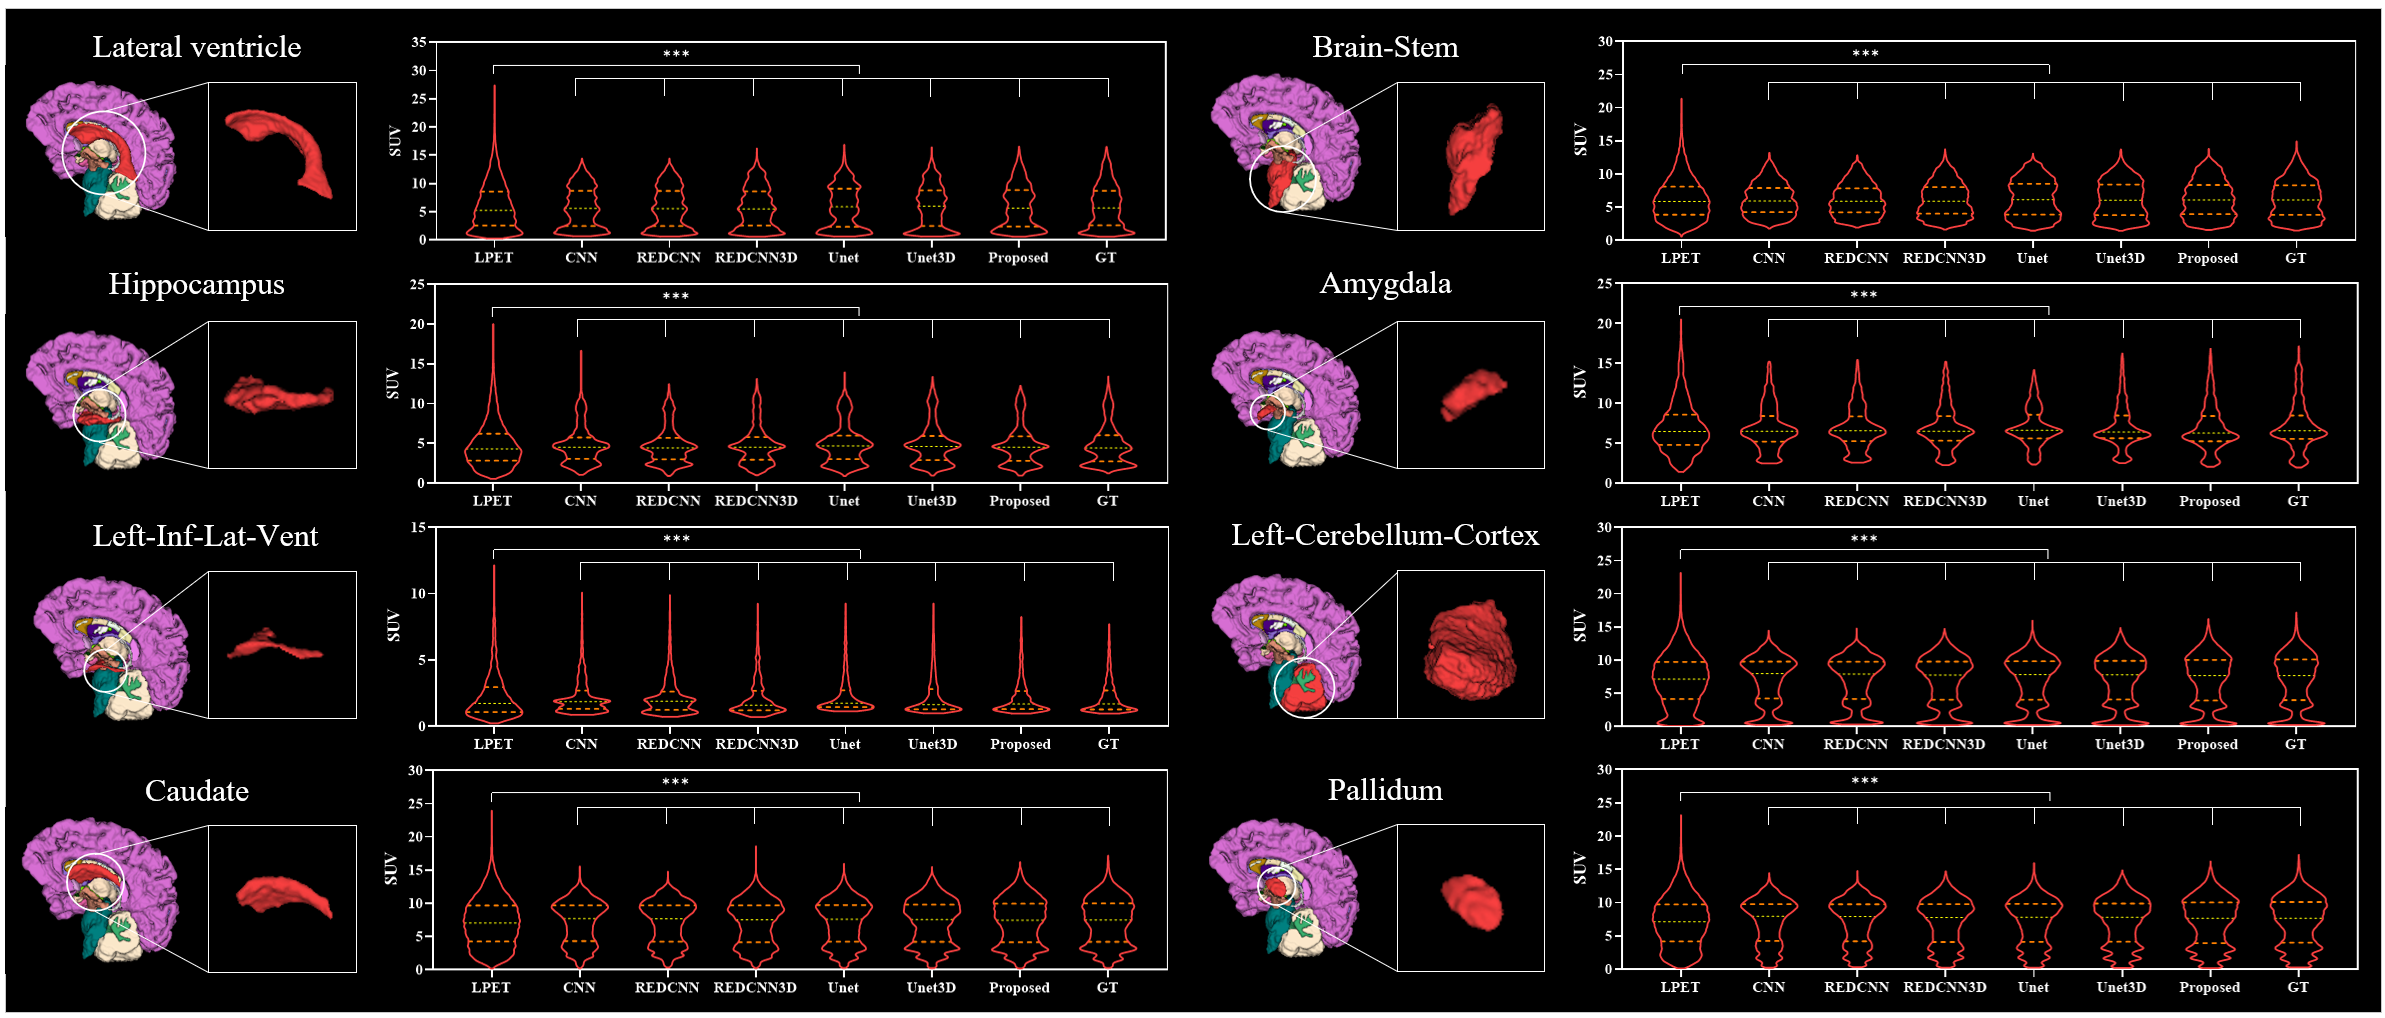
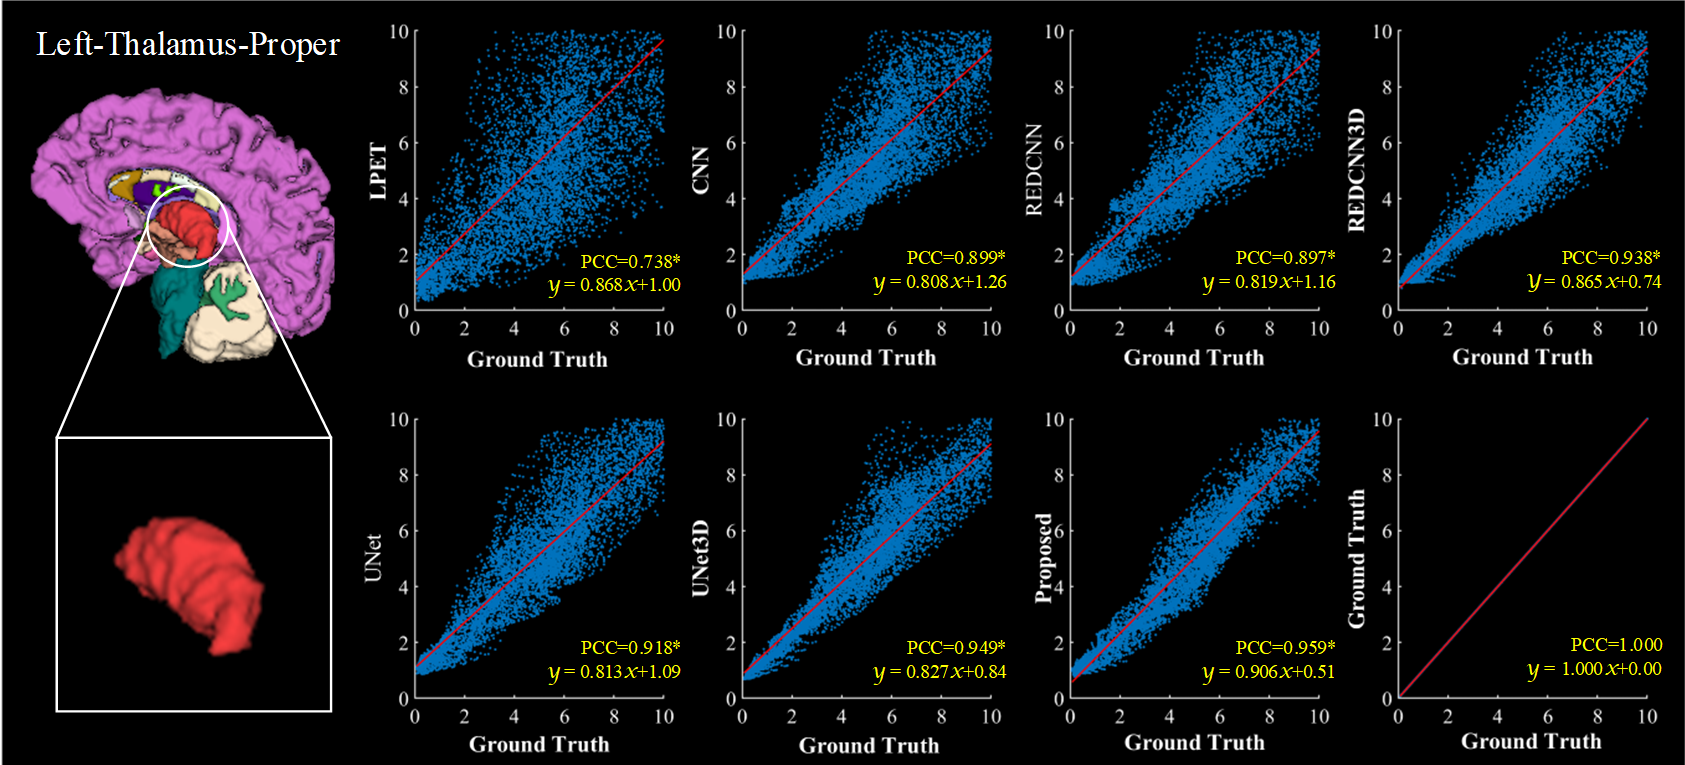
In Figure 2, it is obvious that the differences of our proposed method are superior compared with other methods under smaller SUV distribution values. To further measure the performance of different methods in a given entire brain region, we selected eight whole brain regions and used violin plots to visualize their data distribution, as presented in Figure 3. Taking the lateral ventricle as an example, we can observe that the SUV values of the low-dose PET image are on the high side, and its data distribution within the lateral ventricle significantly differs from that of the ground truth. In contrast, our result is more consistent with the median, and the quartiles are closest when compared with other approaches. In Figure 4, we have provided scatter plots of the left-thalamus-proper imaging data and performed data fitting. We obtained a fitting equation coefficient of 0.906 and a PCC value of 0.959, which could further validate the high correlation. The obtained PSNR and SSIM were 41.96 ± 4.91 dB and 0.9654 ± 0.0215, which achieved a 19% and 20% improvement, respectively, compared to the original low-dose PET images in Table 1.Discussion and conclusion:
In this study, we developed a 3D whole-brain image enhancement model to integrate PET-MR features and spatial brain anatomical alignment information. The experimental results demonstrated that our method could significantly improve the image quality of low-dose PET brain data. Moreover, a comprehensive analysis based on brain regions also shows that there is a high correlation between the PET images generated by our proposed method and the standard-dose PET images, which is advantageous for the detection of neurological disorders.Acknowledgements
This work was supported by the National Natural Science Foundation of China ( 82372038 and 62101540), the Shenzhen Excellent Technological Innovation Talent Training Project of China (RCJC20200714114436080), the Key Laboratory for Magnetic Resonance and Multimodality Imaging of Guangdong Province (2023B1212060052) and the Shenzhen Science and Technology Program (JCYJ20220818101804009 and RCBS20210706092218043).References
[1] S. H. Siddiqi, K. P. Kording, J. Parvizi, and M. D. Fox, “Causal mapping of human brain function,” Nat Rev Neurosci, vol. 23, no. 6, pp. 361-375, Jun, 2022.
[2] D. D. Li, L. Xie, Z. Wang, and H. Yang, “Brain Emotion Perception Inspired EEG Emotion Recognition With Deep Reinforcement Learning,” Ieee Transactions on Neural Networks and Learning Systems, May 1, 2023.
[3] E. R. Orchard, H. J. V. Rutherford, A. J. Holmes, and S. D. Jamadar, “Matrescence: lifetime impact of motherhood on cognition and the brain,” Trends in Cognitive Sciences, vol. 27, no. 3, pp. 302-316, Mar, 2023.
[4] E. Ozbay, and F. Altunbey Ozbay, “Interpretable features fusion with precision MRI images deep hashing for brain tumor detection,” Comput Methods Programs Biomed, vol. 231, pp. 107387, Apr, 2023.
[5] K. T. Chen, T. N. Toueg, M. E. I. Koran, G. Davidzon, M. Zeineh, D. Holley, H. Gandhi, K. Halbert, A. Boumis, G. Kennedy, E. Mormino, M. Khalighi, and G. Zaharchuk, “True ultralow-dose amyloid PET/MRI enhanced with deep learning for clinical interpretation,” Eur J Nucl Med Mol Imaging, vol. 48, no. 8, pp. 2416-2425, 2021.
[6] M. Soret, J. A. Maisonobe, S. Desarnaud, S. Bergeret, V. Causse-Lemercier, A. Berenbaum, L. Rozenblum, M. O. Habert, and A. Kas, “Ultralow-dose in brain 18F-FDG PET/MRI in clinical settings,” Sci Rep, vol. 12, no. 1, pp. 15341, Sep 12, 2022.
[7] C. N. Ladefoged, P. Hasbak, C. Hornnes, L. Hojgaard, and F. L. Andersen, “Low-dose PET image noise reduction using deep learning: application to cardiac viability FDG imaging in patients with ischemic heart disease,” Phys Med Biol, vol. 66, no. 5, pp. 054003, Feb 25, 2021.
[8] J. P. Schmall, S. Surti, H. J. Otero, S. Servaes, J. S. Karp, and L. J. States, “Investigating Low-Dose Image Quality in Whole-Body Pediatric (18)F-FDG Scans Using Time-of-Flight PET/MRI,” J Nucl Med, vol. 62, no. 1, pp. 123-130, Jan, 2021.
Figures