4260
Optimizing Hadamard-Encoded 19F MRI for PFOB Imaging of Monocytes1Division of Medical Physics, Department of Diagnostic and Interventional Radiology, University Medical Center Freiburg, Faculty of Medicine, University of Freiburg, Freiburg, Germany, 2Department of Cardiology, University Medical Center Freiburg, Faculty of Medicine, University of Freiburg, Freiburg, Germany
Synopsis
Keywords: Data Acquisition, Non-Proton
Motivation: Perfluorooctyl bromide (PFOB) is a possible 19F tracer for monocytes active during myocardial infarction (MI). The method of Hadamard-encoding can mitigate chemical shift artifacts, but spectrally tailored pulses have not been leveraged yet.
Goal(s): The goal of this work is to increase the SNR efficiency of the Hadamard-encoding method for 19F MRI of PFOB.
Approach: Variable flipangle measurements were performed to measure T1 and the individual Hadamard-pulses were tailored to better fit the spectrum.
Results: T1 values are similar for all PFOB resonances ranging between 870 and 970ms. SNR was increased by 10% by using a combination of Gaussian- and sinc-pulses.
Impact: The improvements shown here contribute to making Hadamard-encoding a viable method for imaging PFOB with 19F MRI. As an alternative to monocyte tracking with PET, this might further our understanding of monocyte behavior during MI.
Introduction
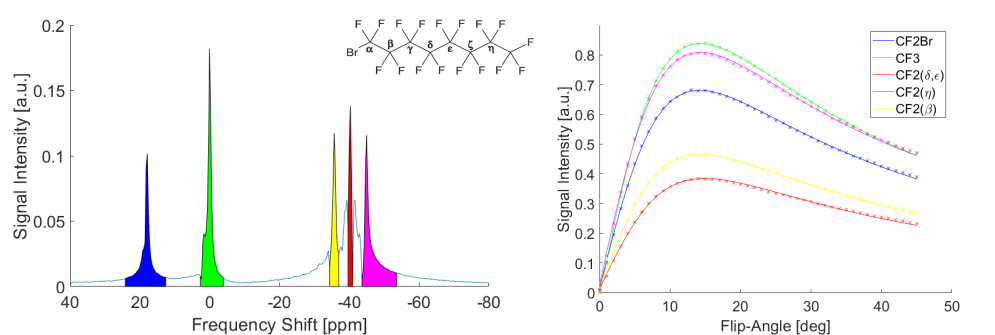
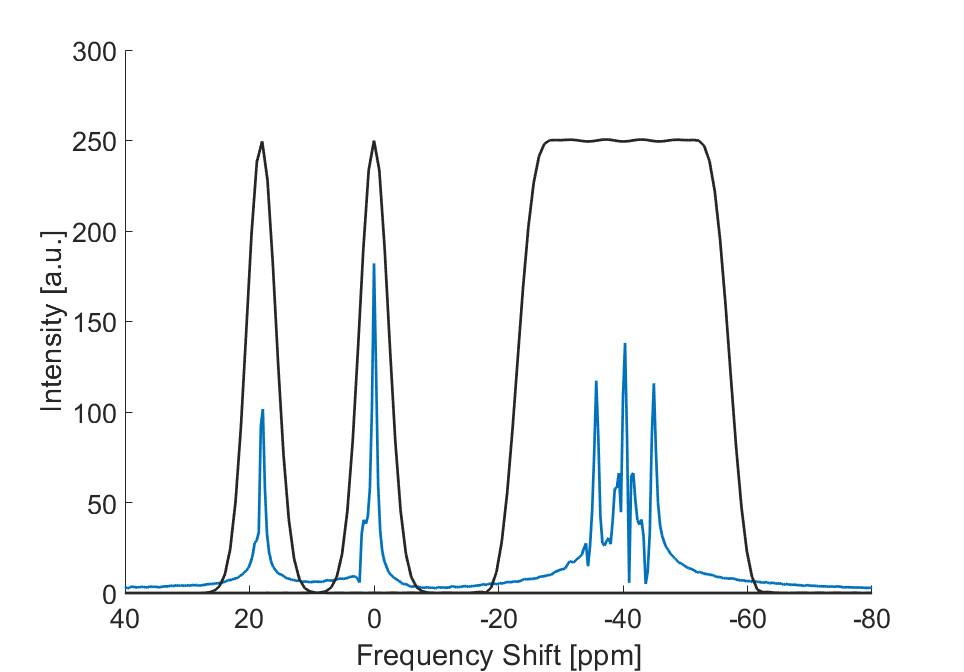
Novel therapeutic approaches to treat myocardial infarction (MI) target monocytes, as they are involved in the inflammatory healing process. Monocytes accumulate in the spleen, where they remain inert until activated in response to strong inflammatory events (e.g., after MI or stroke). Monocytes take up biologically inert perfluorocarbons (PFCs) once injected into the blood stream1, which makes PFCs excellent biomarkers for 19F MRI, due to the lack of other 19F signals. Ideally, 19F MRI of PFCs allows for quantification of splenic monocytes such that the dynamic 19F MRI signal should be correlated with the inflammatory reaction. For this purpose, several different PFCs have been tested2–4. The goal of this work is to optimize the recently proposed method to monitor the PFC perfluorooctyl bromide (PFOB) with 19F MRI using Hadamard-Encoding5. Compared to other PFCs, PFOB has the advantage that it has been used in clinical trials before; however, PFOB has a complex 19F spectrum (Fig. 1), which requires chemical shift artifact correction. Hadamard-encoding with RF pulses is an elegant way to remove chemical shift artifacts in 19F PFOB MRI, but it can be further optimized using optimal flip angles to maximize the signal for each spectral component and introducing sinc-pulse shapes to excite the spectra more uniformly compared to Gaussian pulses.Methods
The 19F PFOB spectrum consists of 3 major resonances (Fig 1): a central peak from the CF3 group, a second peak at 18.1 ppm from the CF2Br group, and 5 CF2 peaks centered at -40.1 ppm. To optimize the SNR for each resonance individually, T1 was determined in a 10% PFOB fat-water emulsion. Using an FID sequence on a clinical 3T MRI system (Siemens Prisma Fit), T1 was measured by varying the flip angle (a=0°-45°) at a fixed TR=30ms. For RF excitation a Sinc-pulse (duration: 3ms, spectral width: 100ppm) was used to cover the whole PFOB spectrum. From the spectra T1 was calculated for 5 peaks (CF2Br, CF3 and the three most prominent peaks from the CF2 multi-peak spectrum) using the FLASH signal equation. Using the different T1 values, Hadamard pulses with different relative flip angles (Ernst angle) could be calculated to maximize the signal for all resonances individually.In Hadamard-encoding composite RF-pulses are designed to excite individual resonances with alternating phases, so that the resonances can be separated by addition and subtraction of the individually encoded images5. To optimize the Hadamard encoding scheme, Gaussian- and sinc-pulses for excitation of the individual peaks were implemented so that their spectra did not overlap with the other resonances. As the multi-peak CF2 spectra only cover a range of 10 ppm, individual resonances could not be excited as this would require long RF pulses (>10ms); thus the CF2 peaks were treated as a single peak. A 3D Cartesian FLASH Sequence (TE=3.94ms, TR=10ms, (Δx)3=(5mm)3, BW=260 Hz/px) was used to compare different Hadamard-encoding pulses shapes in phantom images.
Results
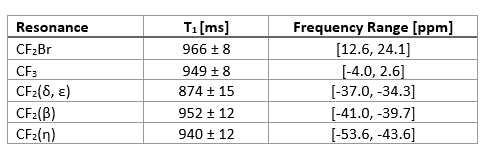
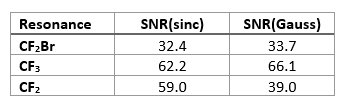
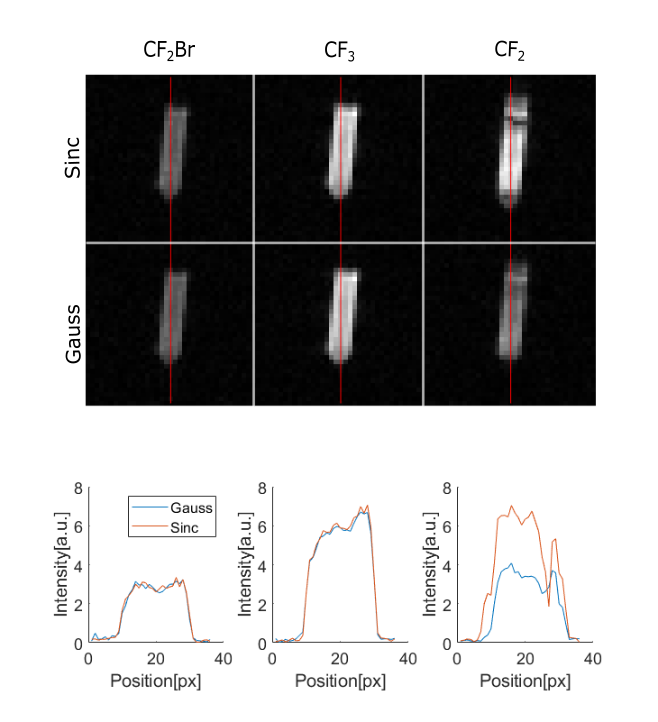
Figure 1 shows the PFOB spectrum together with the FLASH curves of the CF3 resonance, the CF2Br resonance and the most prominent resonances (β,δ+ε,η) of the CF2 multi-peak. T1 values of the different PFOB resonances were between 870 and 970ms for all resonances (table 1). At a TR of 10ms, as was used in the imaging sequence, the Ernst-angles differ by less than 0.5°, resulting in a signal loss of only 0.3%. As one would expect, due to a uniform coverage of the CF2 resonances the change from a Gaussian to a Sinc pulse led to an increase in SNR of about 50% from the CF2 multi-peak. The total increase in SNR was 10%. No significant differences between Gaussian and sinc pulse excitation were observed for the CF2Br and CF3 resonances (Fig. 2).Discussion and Conclusion
Similar T1 values were found for all resonances, so that an individual SNR optimization using different flip angles is not required. Sinc pulse shapes (Fig 3) significantly increased the SNR of the CF2 multi-peak over the more inhomogeneous Gaussian pulses, so that the CF2 signal becomes similar to the CF3 signal. This SNR increase also led to an increase in blurring, which can be reduced by using a lower readout bandwidth. With the current sequence parameters the anatomical structures can still be well resolved even in the CF2 image, and the SNR increase will allow to reduce the acquisition time. Since the CF2 signal dephases with increasing echo time due to interference of the different resonances, the signal gain at lower echo times might be even higher – thus a further optimization might be achieved using shorter RF pulses in combination with UTE signal readouts.Acknowledgements
This study was funded by the Deutsche Forschungsgemeinschaft (DFG) under project #492563001 (BO 3025/17-1 and MA 7059/3-1), and it was part of the SFB1425, project #422681845.References
1. Senders ML, Meerwaldt AE, van Leent MMT, et al. Probing myeloid cell dynamics in ischemic heart disease by nanotracer hot spot imaging. Nat Nanotechnol. 2020;15(5):398-405. doi:10.1038/s41565-020-0642-4
2. Jacoby C, Temme S, Mayenfels F, et al. Probing different perfluorocarbons for in vivo inflammation imaging by 19F MRI: image reconstruction, biological half-lives and sensitivity. NMR Biomed. 2014;27(3):261-271. doi:10.1002/nbm.3059
3. Shukla HP, Mason RP, Woessner DE, Antich PP. A Comparison of Three Commercial Perfluorocarbon Emulsions as High-Field 19F NMR Probes of Oxygen Tension and Temperature. Journal of Magnetic Resonance, Series B. 1995;106(2):131-141. doi:10.1006/jmrb.1995.1023
4. Colotti R, Bastiaansen JAM, Wilson A, et al. Characterization of perfluorocarbon relaxation times and their influence on the optimization of fluorine-19 MRI at 3 tesla. Magn Reson Med. 2017;77(6):2263-2271. doi:10.1002/mrm.26317
5. Bock M, Ilbey S, Maier A, Özen AC. Chemical Shift Artifact Correction for 19F MRI using Spectral Hadamard Encoding. In: Proc. Intl. Soc. Mag. Reson. Med. 30. London; 2022. doi:10.58530/2022/1008
Figures