4257
Comparison of neurochemical quantification at 3T vs. 7T with an advanced MRS protocol under the same physiological status1Radiology, University of Minnesota, Minneapolis, MN, United States, 2Medicine, University of Minnesota, Minneapolis, MN, United States
Synopsis
Keywords: Quantitative Imaging, Spectroscopy, Quantification, LCModel, Glycemia
Motivation: As more clinical MRS studies migrate from 3T to 7T, comparing neurochemical quantification under the same physiological status is of interest.
Goal(s): Our goal was to investigate whether there are systematic biases in neurochemical concentrations obtained with the identical advanced MRS protocol on 3T vs. 7T.
Approach: Seventeen participants underwent an advanced MRS protocol at 3T and 7T during euglycemic clamps.
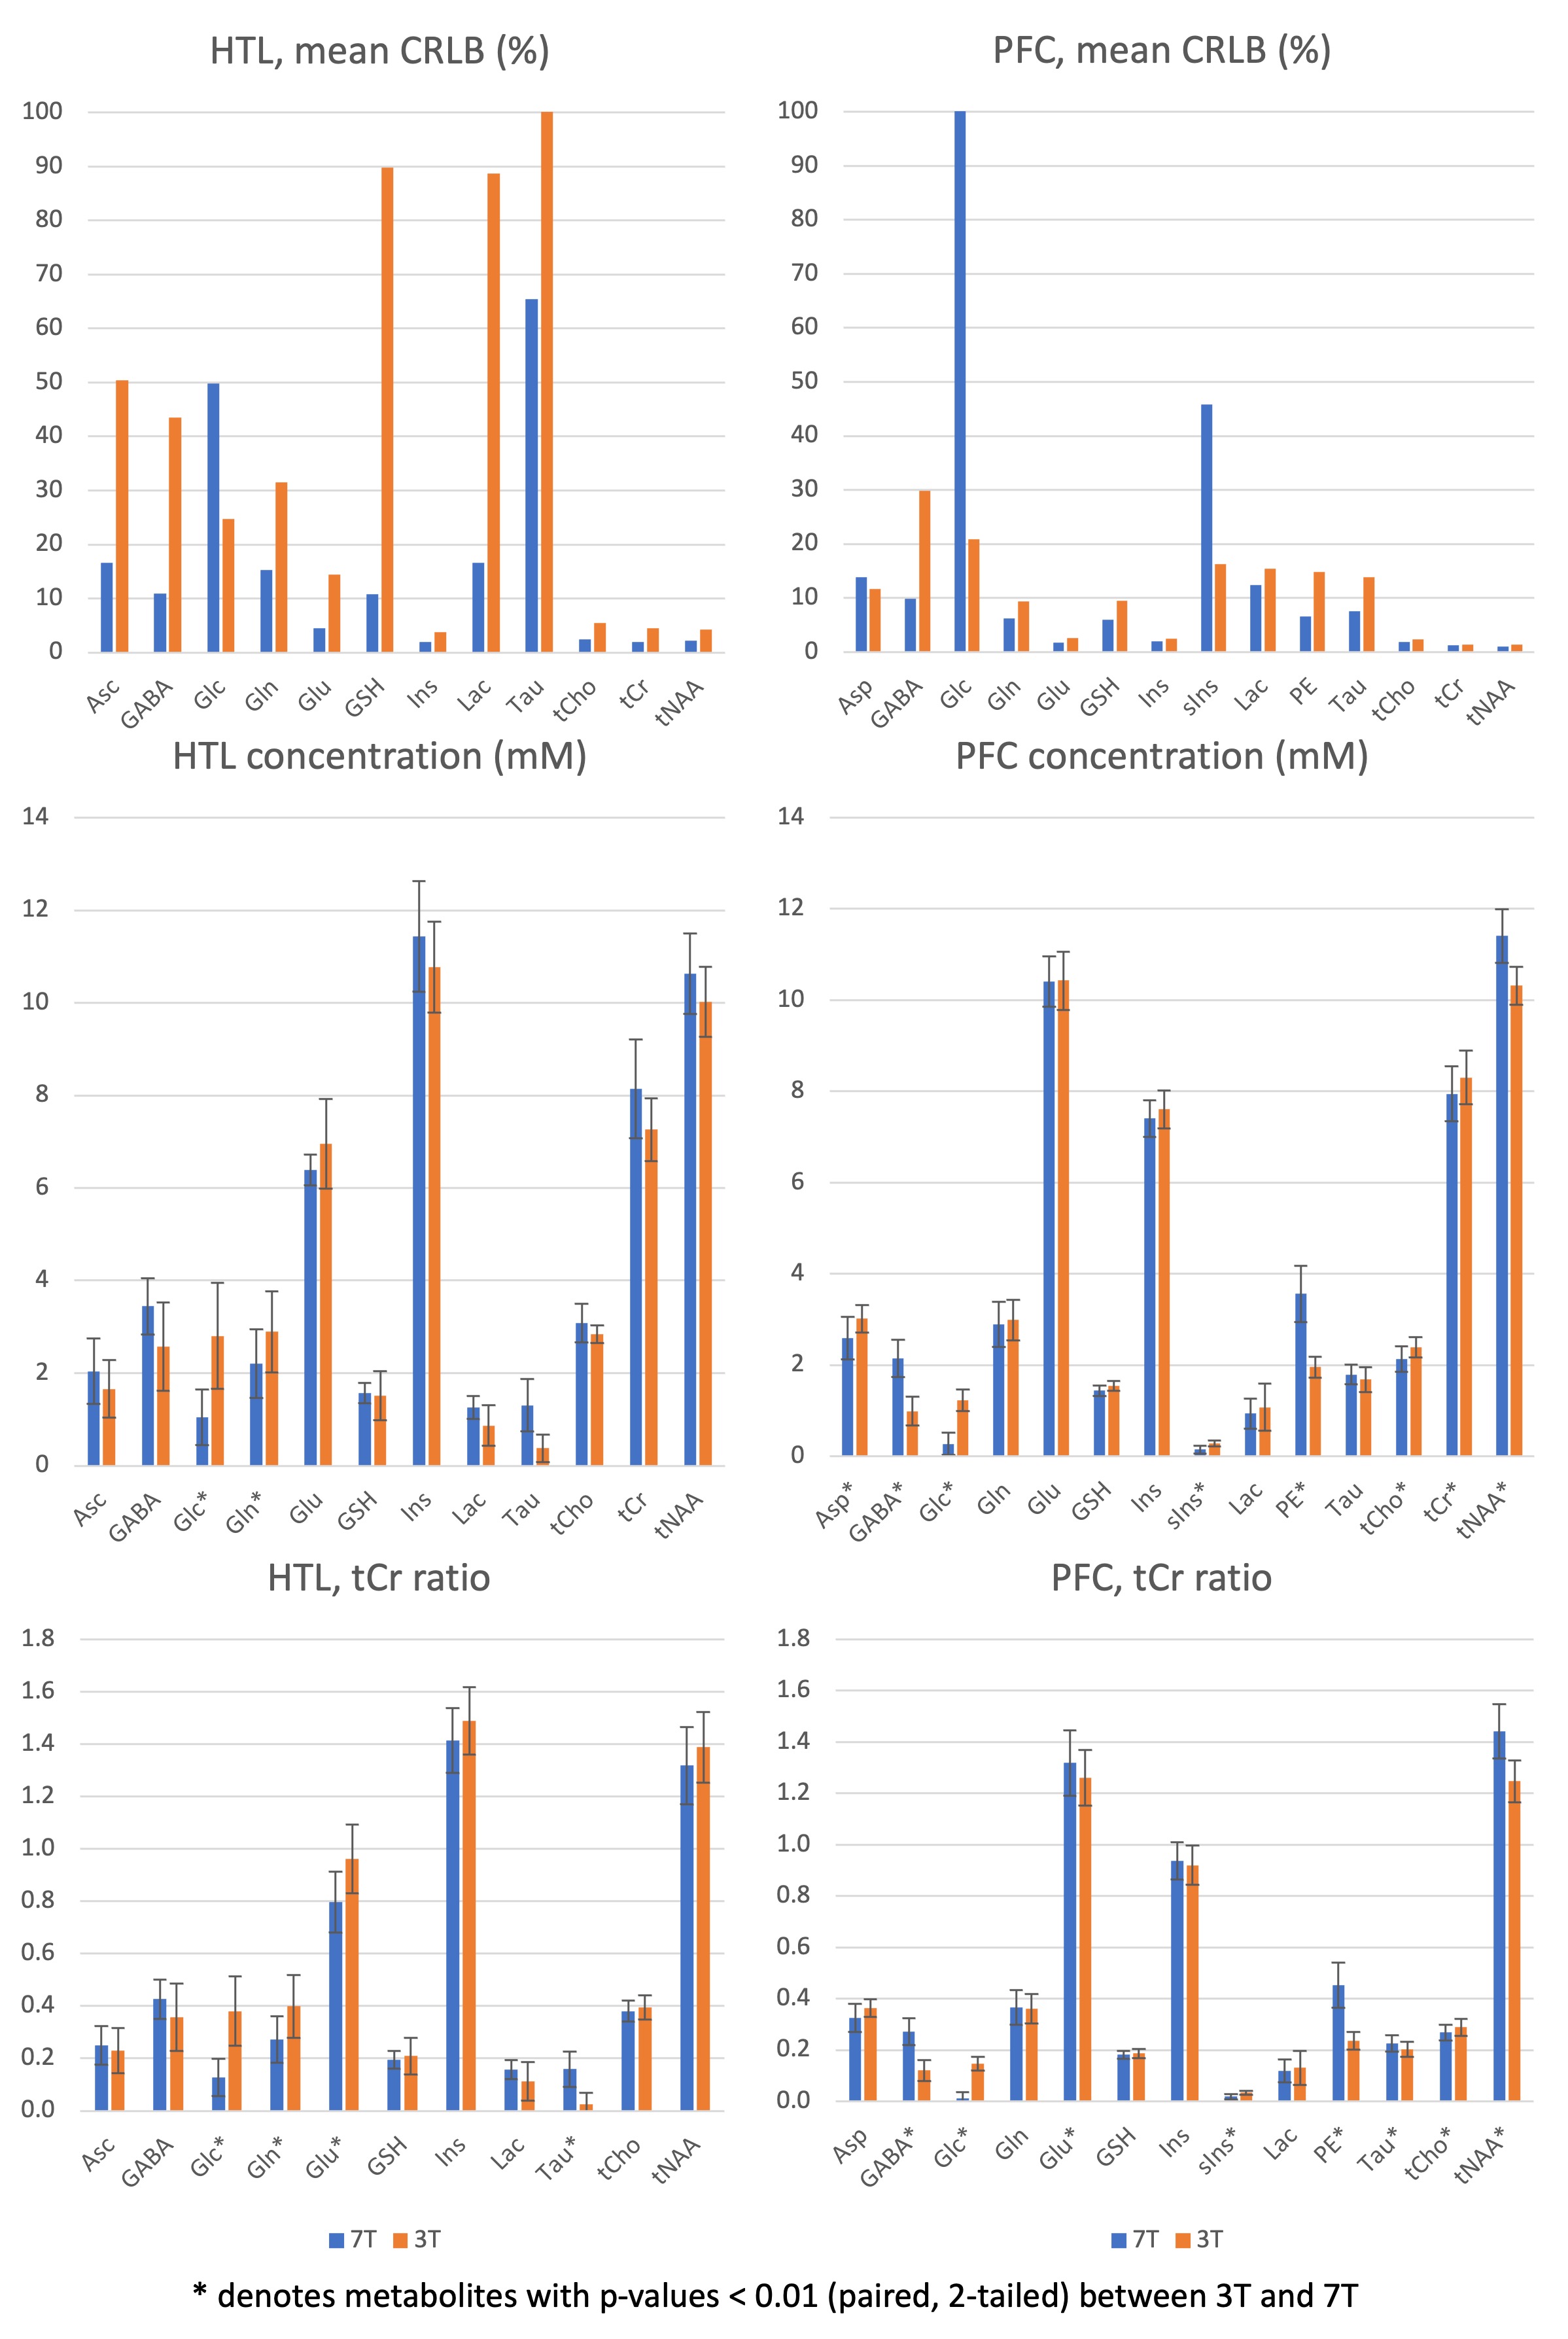
Results: While most of the mean metabolite levels were comparable at 3T vs. 7T, a few metabolites displayed systematic differences, notably gamma-aminobutyric acid, glucose, taurine and phosphoethanolamine. Utilizing total creatine ratios did not alleviate but exacerbated the biases.
Impact: Water referenced MRS quantification results in similar neurochemical profiles at 3T vs. 7T, with the exception of a few important metabolites. Selection of the magnetic field for a clinical study should depend on the metabolite-of-interest.
Introduction
With the increasing adoption of ultrahigh-field (UHF) scanners, there is a growing interest in migrating 3T MRS studies to 7T1,2. 7T provides superior signal-to-noise ratio (SNR) and spectral resolution, and thereby more reliable and reproducible quantification of metabolites such as gamma-aminobutyric acid (GABA), glutamate, glutamine and lactate3,4. On the other hand, glucose (Glc) is more reliably quantified at 3T4,5.We collected MRS data from hypothalamus (HTL) and prefrontal cortex (PFC) volumes-of-interest (VOIs) on both 3T and 7T as a part of multi-aim study to measure cerebral responses to hyper- and hypoglycemia, in patients with type-1 diabetes. We used both 3T and 7T because different metabolites of interest (Glc and GABA) were studied in each aim of the study. Seventeen patients participated in both aims of the study, providing a unique opportunity to compare metabolite concentrations estimated with MRS data collected from the same participants at 3T and 7T under the same glycemic state.Our goal was to investigate whether there are systematic biases in neurochemical concentrations obtained with the identical advanced MRS protocol on 3T vs. 7T and if utilizing creatine (tCr) ratios reduce or eliminate such biases.Methods
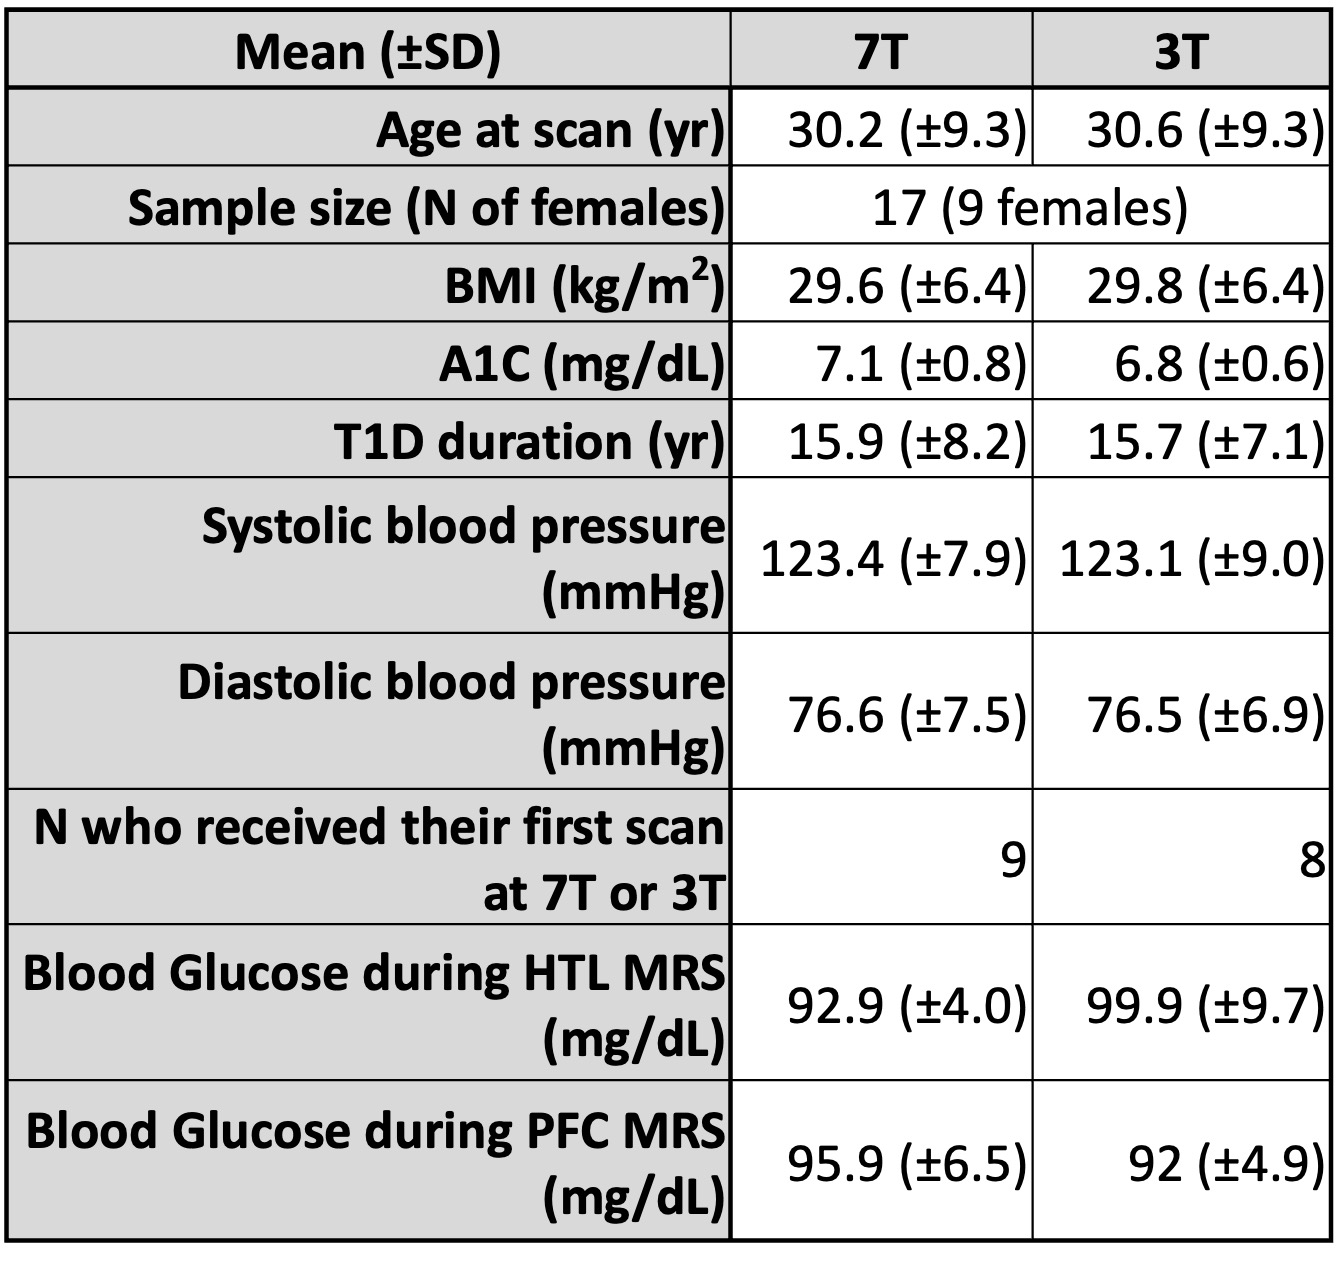
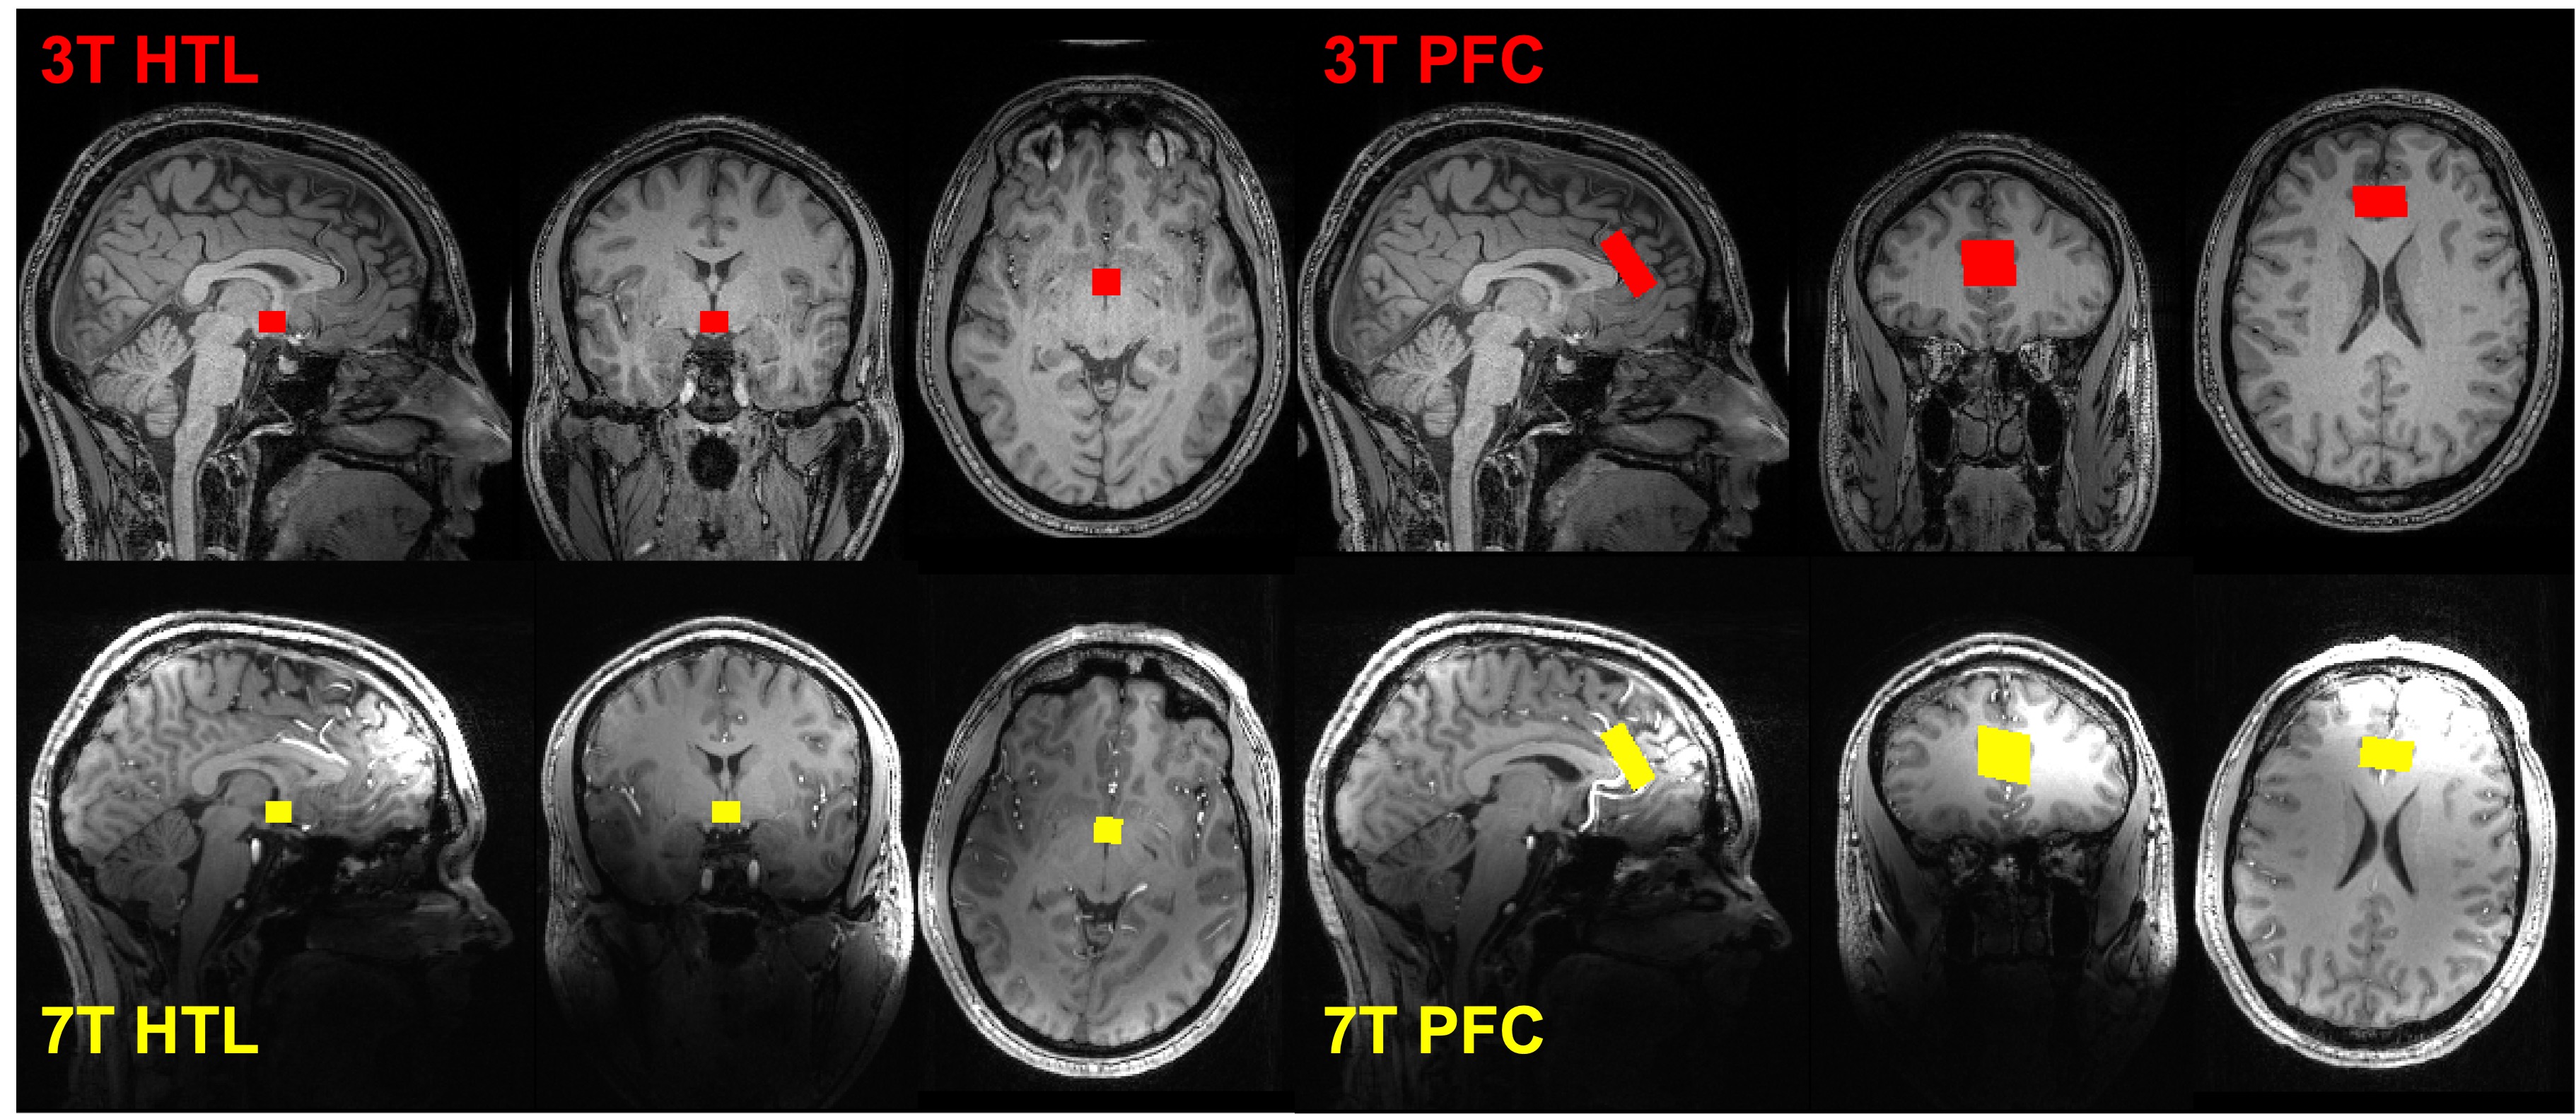
We used data from 17 participants with type-1 diabetes (Figure 1), collected at euglycemia (plasma glucose level ~95 mg/dL). We acquired 3T data using a Siemens Prisma Fit scanner with a 64ch Rx head coil and KinetiCor motion tracking system. We acquired 7T data using a Siemens 7T Actively-Shield scanner with the commercial 1ch Tx and 32ch Rx head coil from Nova Medical, a Metria motion tracking system and a BaTiO3 pad placed over the forehead to achieve sufficient B1+ in the PFC voxel. Single-voxel data were collected from PFC (24x30x12 mm3) and HTL (13x12x10 mm3) (Figure 2) using a motion-corrected short-echo (TR/TE=5000/28ms at 3T; TR/TE=5000/26ms at 7T) semi-LASER protocol6–8, with 64 transients at 7T and 128 transients at 3T for PFC and 256 transients at both fields for HTL. T1-weighted MPRAGE structural images (1x1x1mm3 resolution) were used for VOI placement. Data were preprocessed with MRspa9 and quantified with LCModel. CSF fraction from SPM1210 was used to account for CSF contribution to the VOI. We compared metabolite concentrations and tCr ratios, as well as tissue composition for PFC and HTL and VOI positioning overlap for 3T and 7T with Dice Similarity Coefficient11 (DSC).Results and discussion
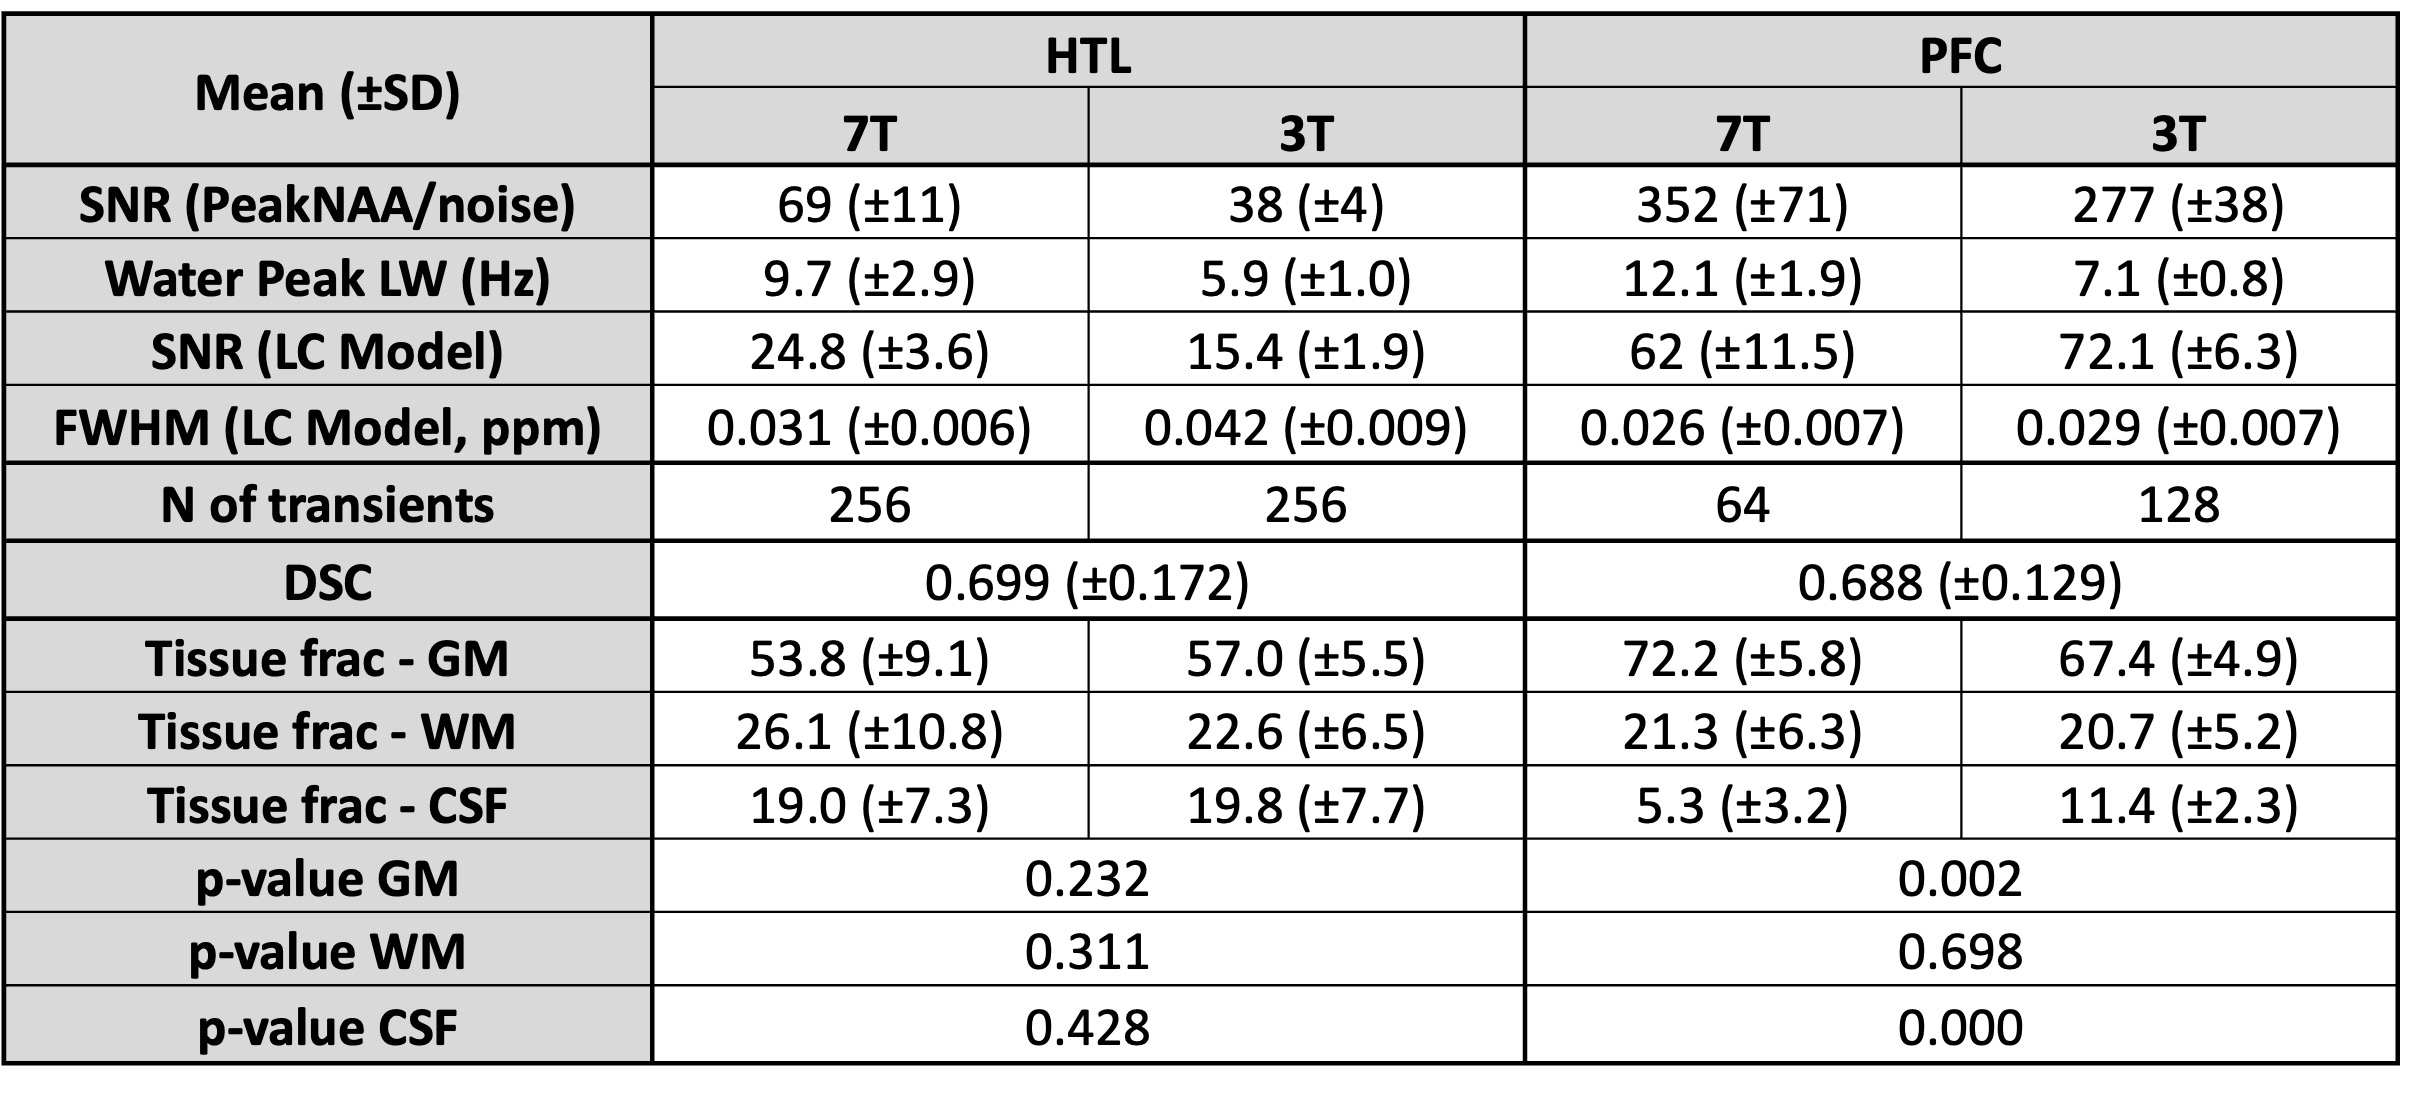
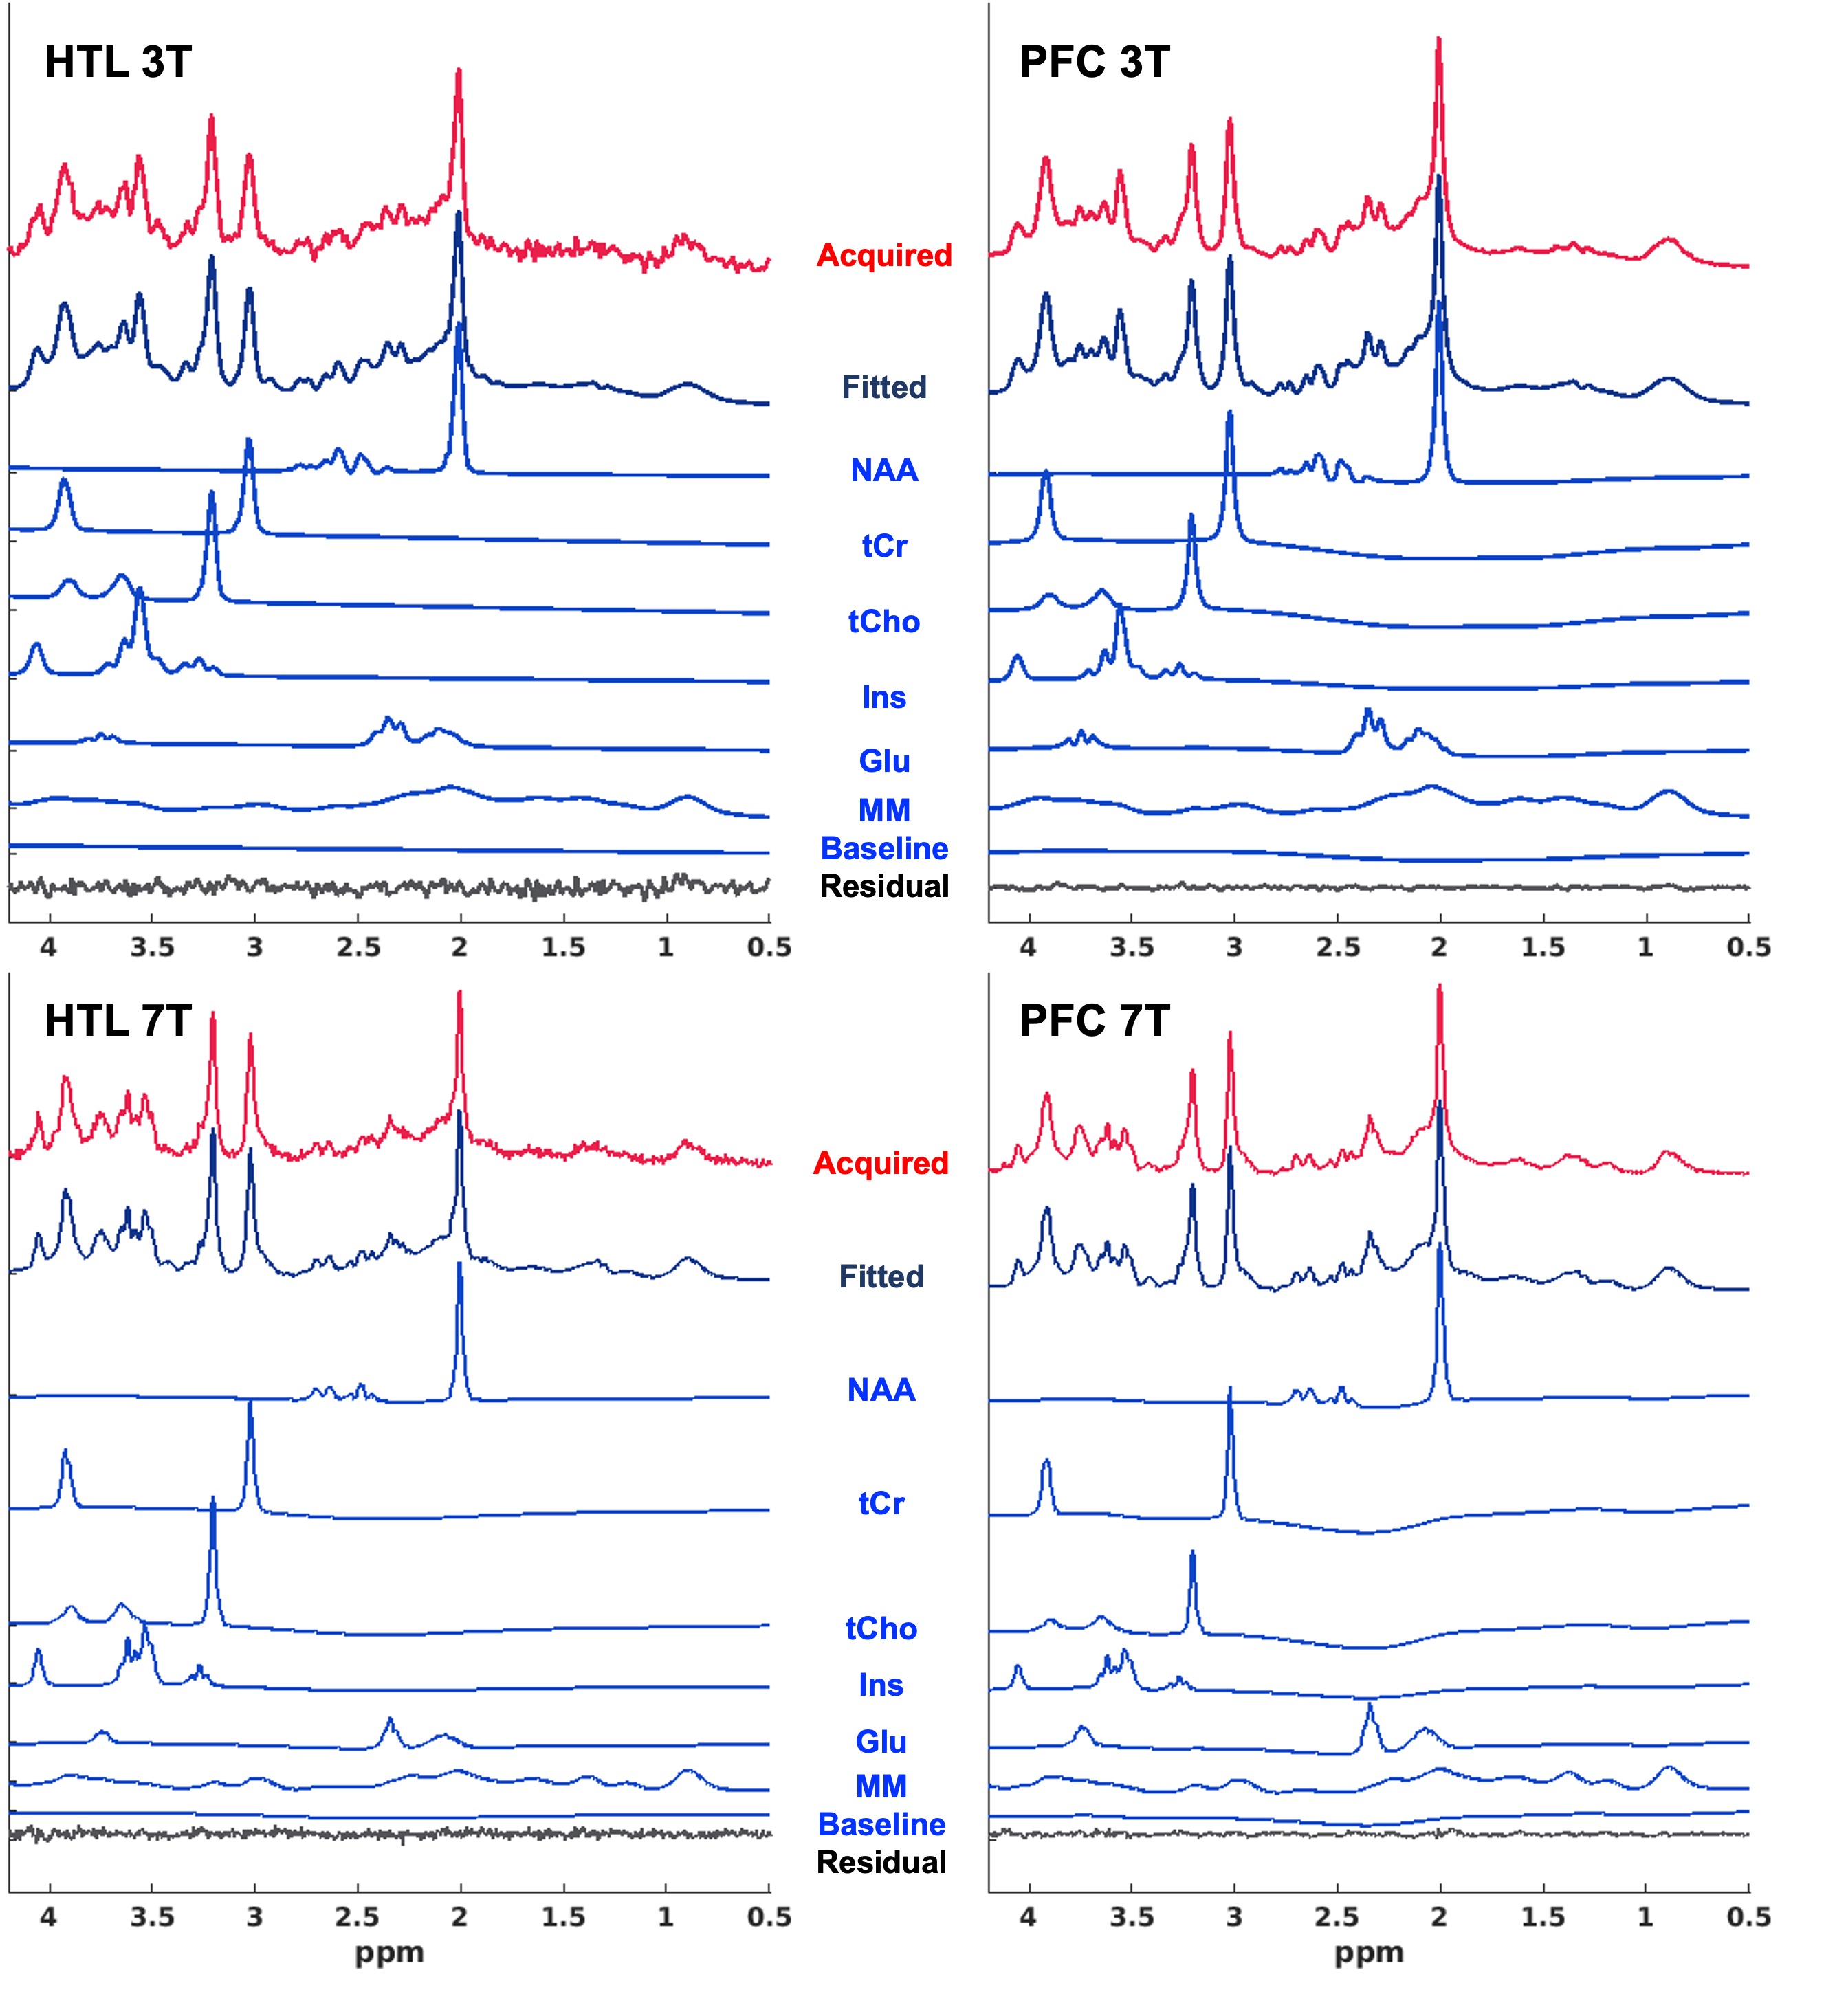
High-quality spectra were obtained at both fields (Figures 3, 4), yielding 12-14 reliably quantified neurochemical concentrations. 7T spectra had higher SNR and better spectral resolution (Figure 3), resulting in more metabolites quantified with mean CRLB<20% than 3T, as demonstrated in the HTL with the same number of transients (Figure 5). In addition, Glc and sIns had lower CRLB at 3T than 7T, as expected. While most of the mean metabolite levels were comparable at 3T vs. 7T, a few metabolites displayed significant differences, notably GABA, Glc, Taurine (Tau) and phosphoethanolamine (PE). Utilizing tCr ratios did not alleviate the biases, and instead resulted in a larger number of significant differences between 3T vs. 7T due to systematic biases in the tCr concentrations between the fields (Figure 5). The prominent Glc difference was not due to glycemic differences since blood glucose levels were the same during the 3T vs. 7T scans. Rather the simplified spectral pattern at 3T likely enabled more reliable Glc fitting in the 3T spectra. The biases in Glc propagated to Tau, especially in low SNR spectra (HTL), due to their cross-correlation. GABA, on the other hand, was significantly underestimated at 3T, even in the very high-quality PFC spectra. Analysis of VOI placements showed good within-subject overlap (DSC = ~0.7) between 3T and 7T for both regions. The tissue fraction analysis saw similar tissue composition between 3T and 7T in HTL. However, we saw differing tissue fraction composition of the PFC voxel (GM and CSF, Figure 3) between 3T and 7T, potentially due to image contrast differences. We also observed significant geometric distortions in 7T images caused by gradient nonlinearity necessitating nonlinear registration of the brain and VOIs for DSC computation. 7T gradient nonlinearity could also affect VOI selection, contributing to variations in tissue fractions and metabolite results.Conclusion
A subset of metabolite levels estimated by the same semi-LASER protocol at 3T and 7T show systematic biases, with the largest differences in GABA, Glc, Tau and PE. Utilizing tCr ratios does not prevent and may even exacerbate the systematic biases, particularly in low SNR spectra where a bias may exist in tCr itself.Acknowledgements
This work was supported by the National Institute of Neurological Disorders and Stroke (NINDS) Grant R01 NS035192 "Measurement of glucose homeostasis in human brain by NMR". The Center for Magnetic Resonance Research (CMRR) was supported by the National Institute of Biomedical Imaging and Bioengineering (NIBIB) Grant P41 EB027061 "Technology to Realize the Full Potential of UHF MRI" and the Office of Research Infrastructure Programs (ORIP) Grant S10 OD017974 "High Performance Connectome Upgrade for Human 3T MR Scanner". The content is solely the responsibility of the authors and does not necessarily represent the official views of the funding agencies.References
1. Ladd ME, Bachert P, Meyerspeer M, et al. Pros and cons of ultra-high-field MRI/MRS for human application. Progress in Nuclear Magnetic Resonance Spectroscopy. 2018;109:1-50. doi:10.1016/j.pnmrs.2018.06.001
2. Özütemiz C, White M, Elvendahl W, et al. Use of a Commercial 7-T MRI Scanner for Clinical Brain Imaging: Indications, Protocols, Challenges, and Solutions—A Single-Center Experience. American Journal of Roentgenology. June 2023:1-18. doi:10.2214/AJR.23.29342
3. Pradhan S, Bonekamp S, Gillen JS, et al. Comparison of single voxel brain MRS AT 3T and 7T using 32-channel head coils. Magnetic Resonance Imaging. 2015;33(8):1013-1018. doi:10.1016/j.mri.2015.06.003
4. Terpstra M, Cheong I, Lyu T, et al. Test-retest reproducibility of neurochemical profiles with short-echo, single-voxel MR spectroscopy at 3T and 7T. Magnetic resonance in medicine. 2016;76(4):1083-1091.
5. Joers JM, Deelchand DK, Kumar A, et al. Measurement of Hypothalamic Glucose Under Euglycemia and Hyperglycemia by MRI at 3T. Journal of Magnetic Resonance Imaging. 2017;45(3):681-691. doi:10.1002/jmri.25383
6. Park YW, Deelchand DK, Joers JM, et al. Monitoring the Neurotransmitter Response to Glycemic Changes Using an Advanced Magnetic Resonance Spectroscopy Protocol at 7T. Front Neurol. 2021;12:698675. doi:10.3389/fneur.2021.698675
7. Deelchand DK, Henry PG, Joers JM, et al. Plug-and-play advanced magnetic resonance spectroscopy. Magn Reson Med. 2022;87(6):2613-2620. doi:10.1002/mrm.29164
8. Deelchand DK, Berrington A, Noeske R, et al. Across-vendor standardization of semi-LASER for single-voxel MRS at 3T. NMR in Biomedicine. 2021;34(5):e4218. doi:10.1002/nbm.4218
9. Deelchand DK. MRspa: Magnetic Resonance signal processing and analysis. 2020.
10. Ashburner J, Friston KJ. Voxel-Based Morphometry—The Methods. NeuroImage. 2000;11(6):805-821. doi:10.1006/nimg.2000.0582
11. Dice LR. Measures of the Amount of Ecologic Association Between Species. Ecology. 1945;26(3):297-302. doi:10.2307/1932409
Figures