4255
Measurement of B1+ Field Map Using Composite 90° RF Pulse for Quantitative Sodium MRI1Biomedical Imaging Center, Beckman Institute for Advanced Science and Technology, University of Illinois at Urbana-Champaign, Urbana, IL, United States, 2Renal and Cardiovascular Disease Research Laboratory, Department of Kinesiology and Community Health, University of Illinois at Urbana-Champaign, Urbana, IL, United States, 3School of Nutritional Sciences and Wellness, University of Arizona, Tucson, AZ, United States
Synopsis
Keywords: Muscle, Pulse Sequence Design, Sodium imaging
Motivation: The quantitation of sodium MRI depends on the reference tubes located near the inner surface of the RF coil. Hence, the RF flip angle at the reference tubes could be off from the intended 90°, which will result in inaccurate quantitation.
Goal(s): To develop an MR sequence to measure the RF field map while maintaining the short echo time of UTE and sensitivity of 90° excitation.
Approach: A composite 90° RF pulse was chosen and implemented into a 3D UTE sequence.
Results: The flip angle map was measured with enough sensitivity and accuracy, which was used in more accurate sodium quantitation.
Impact: The composite 90° RF pulse can be easily added to an existing 3D UTE sequence, and it has the advantage of short echo time and sensitivity. The measured RF field map will be essential for an accurate sodium quantitation.
Introduction
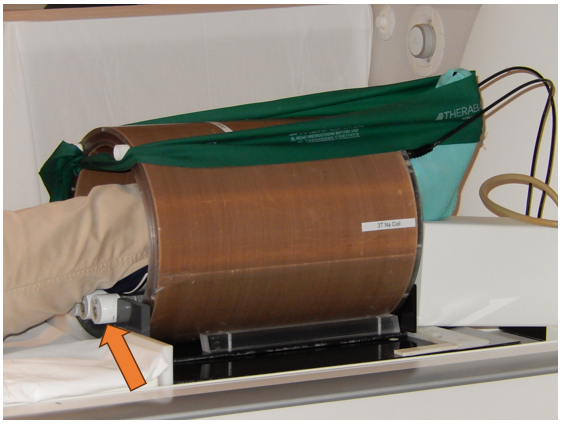
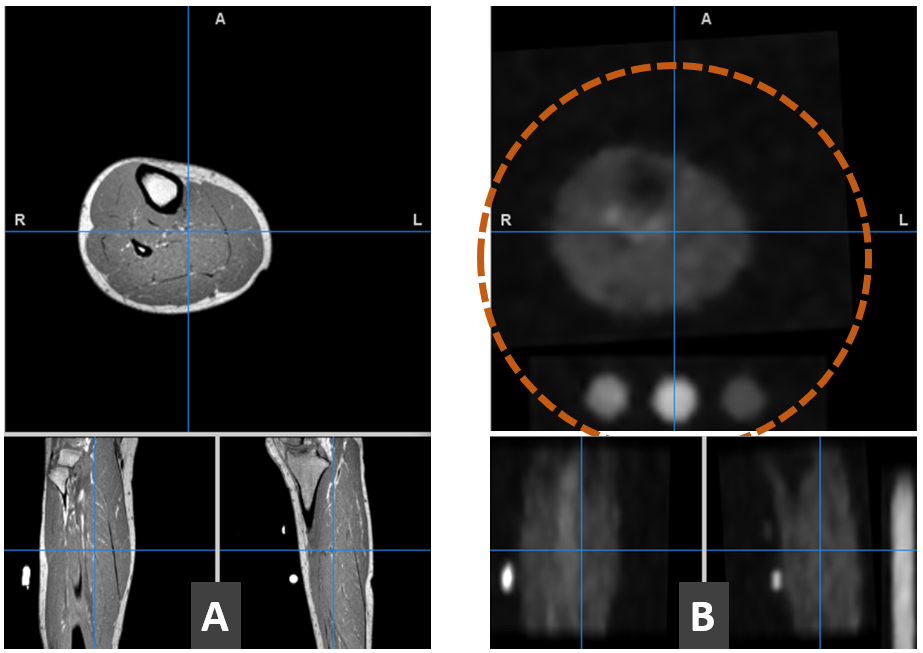
The quantitative analysis of sodium MRI relies on sodium image intensities of target tissue and the reference samples of known sodium concentrations 1. The image intensity is affected by the RF flip angle α not only by the direct spin nutation of sin(α) but also by T1 saturation. The reference samples are placed outside of the target tissue and hence they are located near the inner surface of the RF coil where the RF field is expected to be more inhomogeneous than the coil center, as shown in Figures 1 and 2. Therefore, it is important to measure the flip angle in quantitative sodium MRI. Here we developed a method to measure the RF flip angle map for sodium MRI. This new method was designed in consideration of the small T2 relaxation time of sodium, an inefficient sodium B1 field due to a lower gyromagnetic ratio of sodium compared to proton, and a poor SNR of sodium MRI.Methods
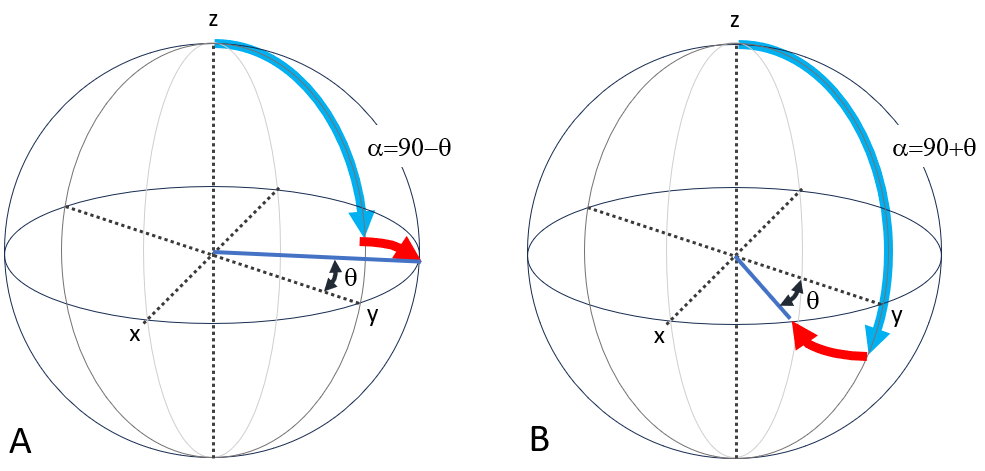
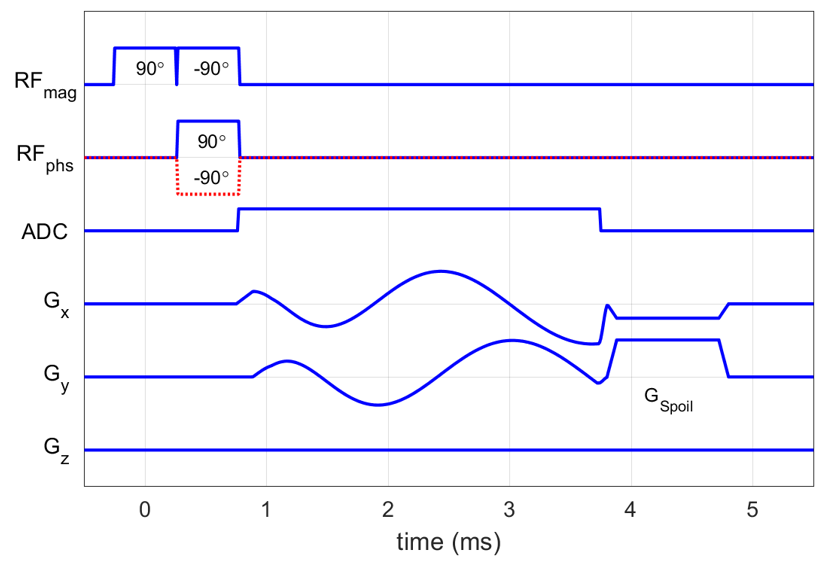
The new method used a composite 90° RF pulse that converts the flip angle deviation (θ) from 90° into a phase of the MRI signal, as illustrated in Figure 3 2,3. The composite 90° RF pulse consists of a pair of 90° RF pulses applied in the x and y axis consecutively. To correct the background phase offset, two images were acquired with an inverted axis for the second 90° RF pulse, i.e., 90x-90y and 90x-90-y. The composite 90° RF pulses were implemented into a 3D UTE sequence of the Rotation of Spiral Disc (RSD) trajectory with a rectangular RF pulse, as shown in Figure 4 4. The complex images acquired from the two pairs of composite 90° RF pulses were compared to yield the RF field map. This method was tested with a 3T scanner using a custom-built single-tuned birdcage sodium RF coil with an inner diameter of 254mm. The RF coil was positioned to the right side in the magnet bore as for a typical scan of the right leg. Three reference tubes containing sodium chloride (NaCl) aqueous solutions at concentrations of 20, 50, and 35 mM were placed at the bottom of the RF coil 5. On top of the reference tubes, a cylinder filled with NaCl aqueous solution (5g NaCl/1000g) was placed. The scan parameters for the RF field mapping were: TR=100ms, TE=1.53ms, field-of-view=240mm, and matrix size=60. The image was reconstructed using nufft of the BART tool 6. The effect of the flip angle α on the MRI signal was estimated using a T1 relaxation equation of M(α)= M0* (1-E1) / (1-cos(α)*E1) * sin(α), where E1=exp(-TR/T1).Results
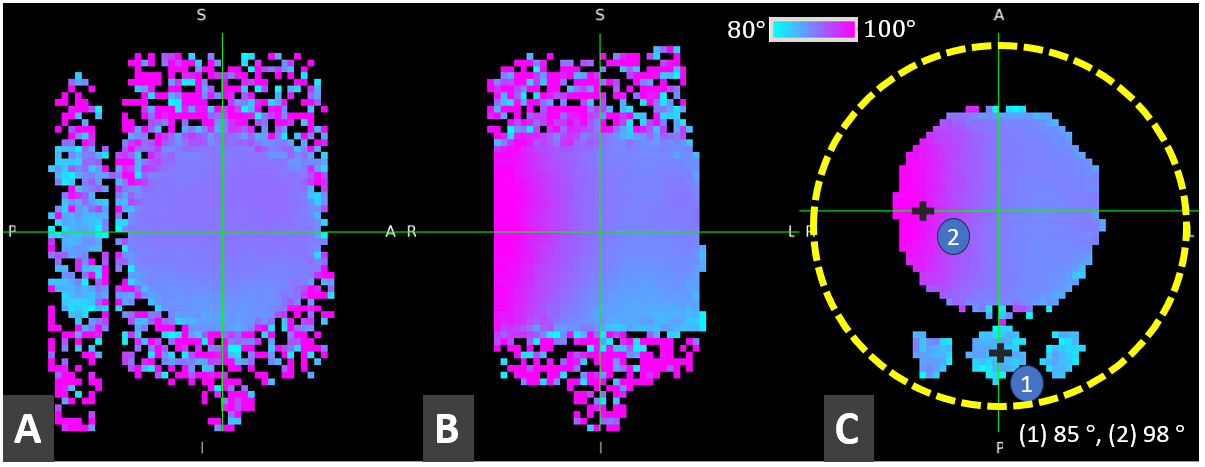
The measured B1+ field map is shown in Figure 5. The B1+ was higher toward the right side of the coil and it was lower at the reference tubes. Using the separately measured T1 of the reference tube (71ms) and TR=100ms, the sodium signal in the reference tube measured at α=85° (Figure 5, Region A) was 2% higher than the signal that would be obtained at α=90°. With the same TR value and a reported T1 of 33.8ms 7, the muscle sodium signal measured at α=98° (Figure 5, Region B) was 2% lower than that would be obtained at α=90°.Discussion
The advantage of the composite 90° RF pulse is that it does not sacrifice the attainable signal as it maintains the 90° excitation. Among other existing B1+ mapping sequences, the dual-angle B1+ mapping sequence might be applicable to sodium 8. However, the disadvantage of such a sequence could be a low SNR due to the halved flip angle. The choice of the composite RF pulse was motivated by a simple implementation via extending the existing 3D RSD sequence and data processing techniques. One disadvantage of the composite RF pulse is an increased RF power, and hence an increased SAR. This was partly alleviated by widening the RF pulse width at the cost of a longer TE and reduced signals. The effect of B1+ on the reference samples has a broad effect on the whole tissue as the sodium quantitation of tissues are referenced to the reference samples. The effect of B1+ on the sodium signal will be more pronounced at a shorter TR.Conclusion
The B1+ field of a sodium RF coil was successfully measured using a composite 90° RF pulse. This composite 90° RF pulse was easily adapted to a 3D UTE sequence. Besides, the composite 90° RF did not sacrifice the attainable SNR other than minimally elongated TE.Acknowledgements
We appreciate the volunteers including Sam Ramos Acevedo for the RF field mapping and the sodium exercise study.References
1. Jung KJ, Fang HY, Sutton B, Wilund K, editors. Increase in Fast-relaxing Sodium After a Brief Plantarflexion Exercise Detected by Multi-Echo UTE MRI and Biexponential Regression. Int Soc Magn Reson Med; 2023.
2. Freeman R, Kempsell SP, Levitt MH. Radiofrequency Pulse Sequences Which Compensate Their Own Imperfections. Journal of Magnetic Resonance. 1980;38(3):453-79.
3. Oh CH, Hilal SK, Cho ZH, Mun IK. Radio frequency field intensity mapping using a composite spin-echo sequence. Magn Reson Imaging. 1990;8(1):21-5.
4. Jung KJ, Sutton B, editors. Three-Dimensional Sodium MRI Using A Rotation of Spiral Disc (RSD) Trajectory. Int Soc Magn Reson Med; 2021.
5. Jung KJ, Fang HY, Wilund K, Sutton B, editors. Separation of Intra- and Extra-cellular Sodium Using A Rotation of Spiral Disc (RSD) Sequence with Multiple Echoes. Int Soc Magn Reson Med; 2022.
6. Martin Uecker FO, Jonathan I Tamir, Dara Bahri, Patrick Virtue, Joseph Y Cheng, Tao Zhang, and Michael Lustig, editor. Berkeley Advanced Reconstruction Toolbox. Intl. Soc. Mag. Reson. Med; 2015; Toronto.
7. Gerhalter T, Carlier PG, Marty B. Acute changes in extracellular volume fraction in skeletal muscle monitored by (23)Na NMR spectroscopy. Physiol Rep. 2017;5(16).
8. Cunningham CH, Pauly JM, Nayak KS. Saturated double-angle method for rapid B1+ mapping. Magn Reson Med. 2006;55(6):1326-33.
Figures