4254
GAGA: Gapped Arrangement of Golden Angles for sliding window reconstruction of hyperpolarized dynamic 13C MRSI data acquired with 3D radial EPSI1Division of Medical Physics in Radiology, German Cancer Research Center (DKFZ), Heidelberg, Germany, 2Faculty of Physics and Astronomy, University of Heidelberg, Heidelberg, Germany, 3German Cancer Consortium (DKTK), Heidelberg, Germany, 4International Max Planck Research School for Quantum Dynamics in Physics, Chemistry, and Biology (IMPRS-QD), Max Planck Institute for Nuclear Physics (MPIK), Heidelberg, Germany, 5Institute of Organic Chemistry, University of Heidelberg, Heidelberg, Germany, 6Department of Radiology, Medical Center University of Freiburg, Freiburg, Germany, 7Faculty of Medicine, University of Freiburg, Freiburg, Germany, 8Faculty of Medicine, University of Heidelberg, Heidelberg, Germany
Synopsis
Keywords: Data Acquisition, Data Acquisition
Motivation: Hyperpolarized 13C magnetic resonance spectroscopic imaging (13C-MRSI) provides real-time metabolic insights but requires extremely fast and efficient imaging sequences, especially for dynamic measurements.
Goal(s): This work aims to enhance three-dimensional 13C radially-sampled echo-planar spectroscopic imaging (rEPSI) to enable dynamic acquisitions.
Approach: A novel algorithm for a 3D Gapped Arrangement of Golden Angles (GAGA) is introduced, combined with sliding window (SW) reconstruction, and tested in simulation and phantom studies.
Results: The algorithm developed for GAGA creates homogeneous k-space sampling distributions for individual temporal subframes, and SW reconstruction successfully recovers the temporal dynamics while displaying only minor temporal flickering and incoherent undersampling artifacts.
Impact: The novel algorithm for a Gapped Arrangement of Golden Angles (GAGA) enables dynamic measurements of volumetric hyperpolarized 13C MRSI with a high temporal resolution. Further studies will exploit its potential for the investigation of metabolic processes using dynamic hyperpolarized 13C-MRSI.
Introduction
Hyperpolarized 13C MR spectroscopic imaging (13C-MRSI) enables the in vivo investigation of metabolic processes in real-time, e.g. [1-13C]pyruvate conversion into [1-13C]lactate. The rapid decay of the non-recoverable hyperpolarized signal (T1 ~ 60s for [1‐13C] pyruvate) demands very fast imaging sequences, e.g. radially-sampled echo-planar spectroscopic imaging (rEPSI) for 3D hyperpolarized 13C MRSI1. Dynamic imaging poses an additional challenge for hyperpolarized 13C MRSI due to the unfeasibility of fully sampling k-space for individual temporal subframes.Sliding window (SW) reconstruction combines spatial undersampling with an efficient use of dynamic data to achieve a high temporal resolution: given a fully-sampled acquisition, consecutive incompletely-sampled subsets of k-space are merged into undersampled temporal subframes2. SW reconstruction has already been combined with 2D golden-angle radial sampling to maximize incoherence between consecutive projections3 and with stack-of-stars 3D imaging4. To the best of our knowledge, no combination of SW reconstruction with 3D golden-angle radial projection imaging has yet been investigated.
The purpose of this work was to develop a novel projection resorting algorithm for an optimized arrangement of temporal subframes to combine SW reconstruction with 3D golden-angle rEPSI imaging.
Methods
To generate $$$M$$$ golden-angle projections, the azimuthal ($$$\phi$$$) and polar ($$$\theta$$$) angles are calculated using the golden ratio $$$\psi=\frac{1+\sqrt{5}}{2}$$$ as follows:$$\phi_i=2\pi\,\mathrm{mod}(i/\psi,\,1),\,\,\theta_i=\mathrm{arccos}(i/M),\,\,i=1,…,M$$
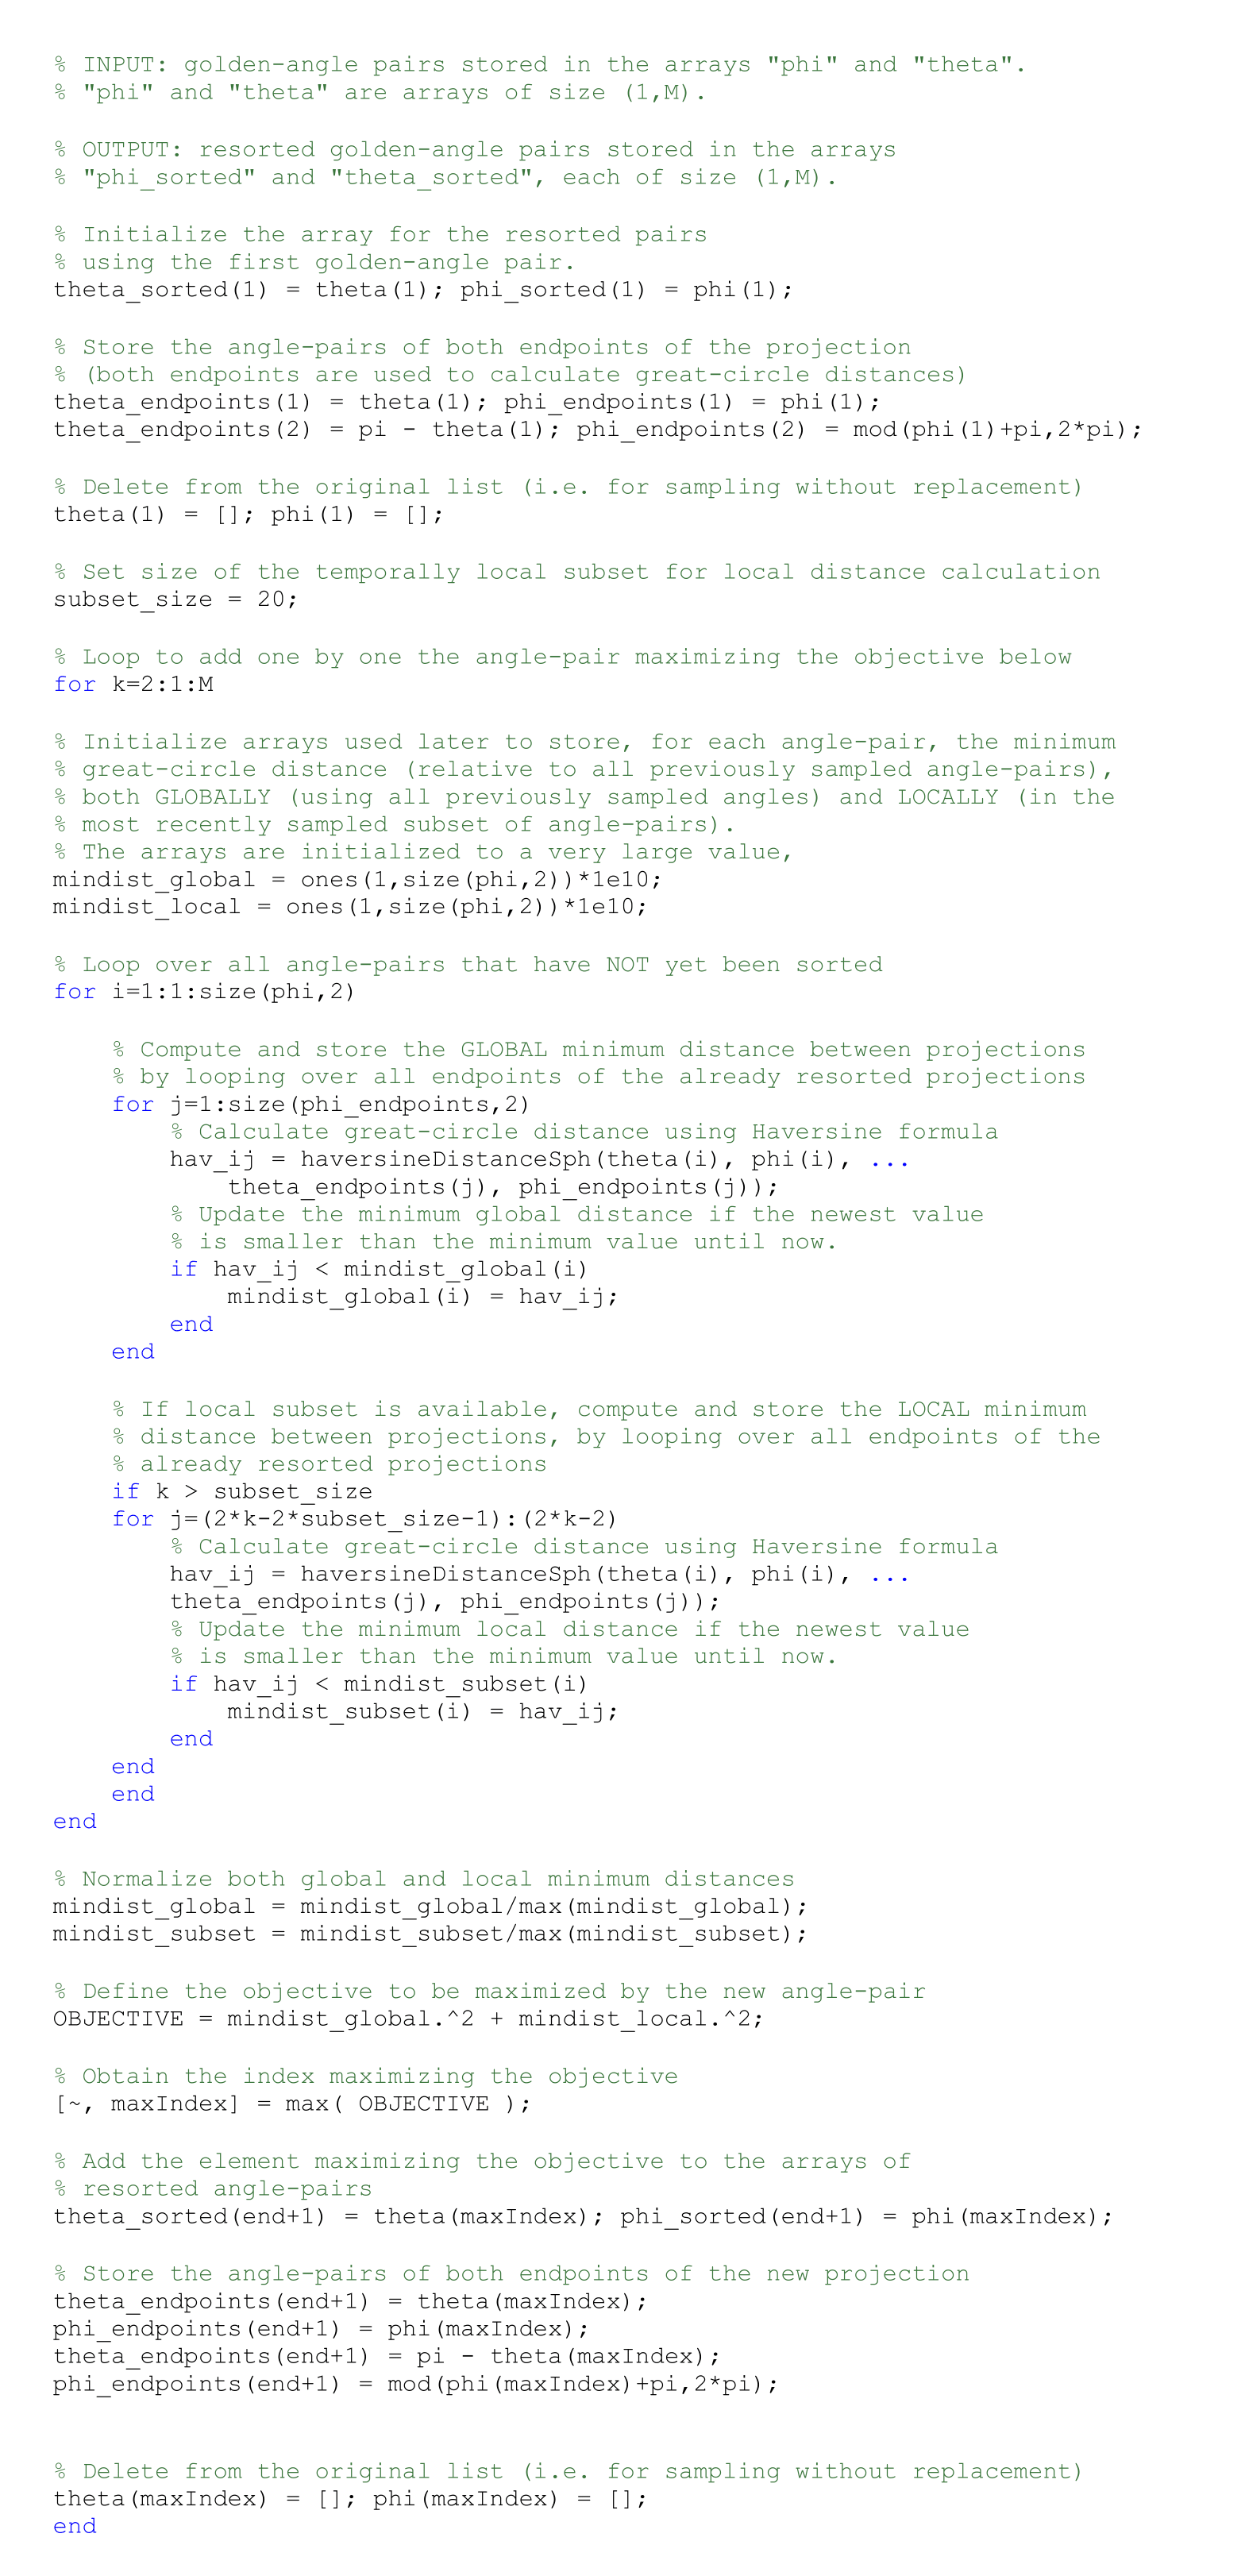
The thus-generated golden-angle pairs are resorted into a Gapped Arrangement of Golden Angles (GAGA) by the algorithm displayed in Figure 1. GAGA maximizes the gap in successive projections based on their great-circle distances using the haversine formula. In particular, GAGA maximizes an objective optimizing both the global distance to all previously sampled projections, and the temporally local distance to the most recently sampled projections to ensure a homogeneous k-space distribution in all temporal subframes.
Simulation study: To test the GAGA approach, a simplified dynamic synthetic MRSI dataset (imaging matrix: 163) was generated. A phantom containing a single spectrum with uniform intensity inside the phantom was added. An exponential T1 decay was applied uniformly in the phantom. 403 total projections (fulfilling the Nyquist criterium) were generated with the GAGA approach, sampling a single projection at every timepoint using the Non-Uniform Fast Fourier Transform (NUFFT)5. SW reconstruction was performed by combining 180 projections per temporal subframe (undersampling factor 2.2), resulting in a total of 224 subframes.
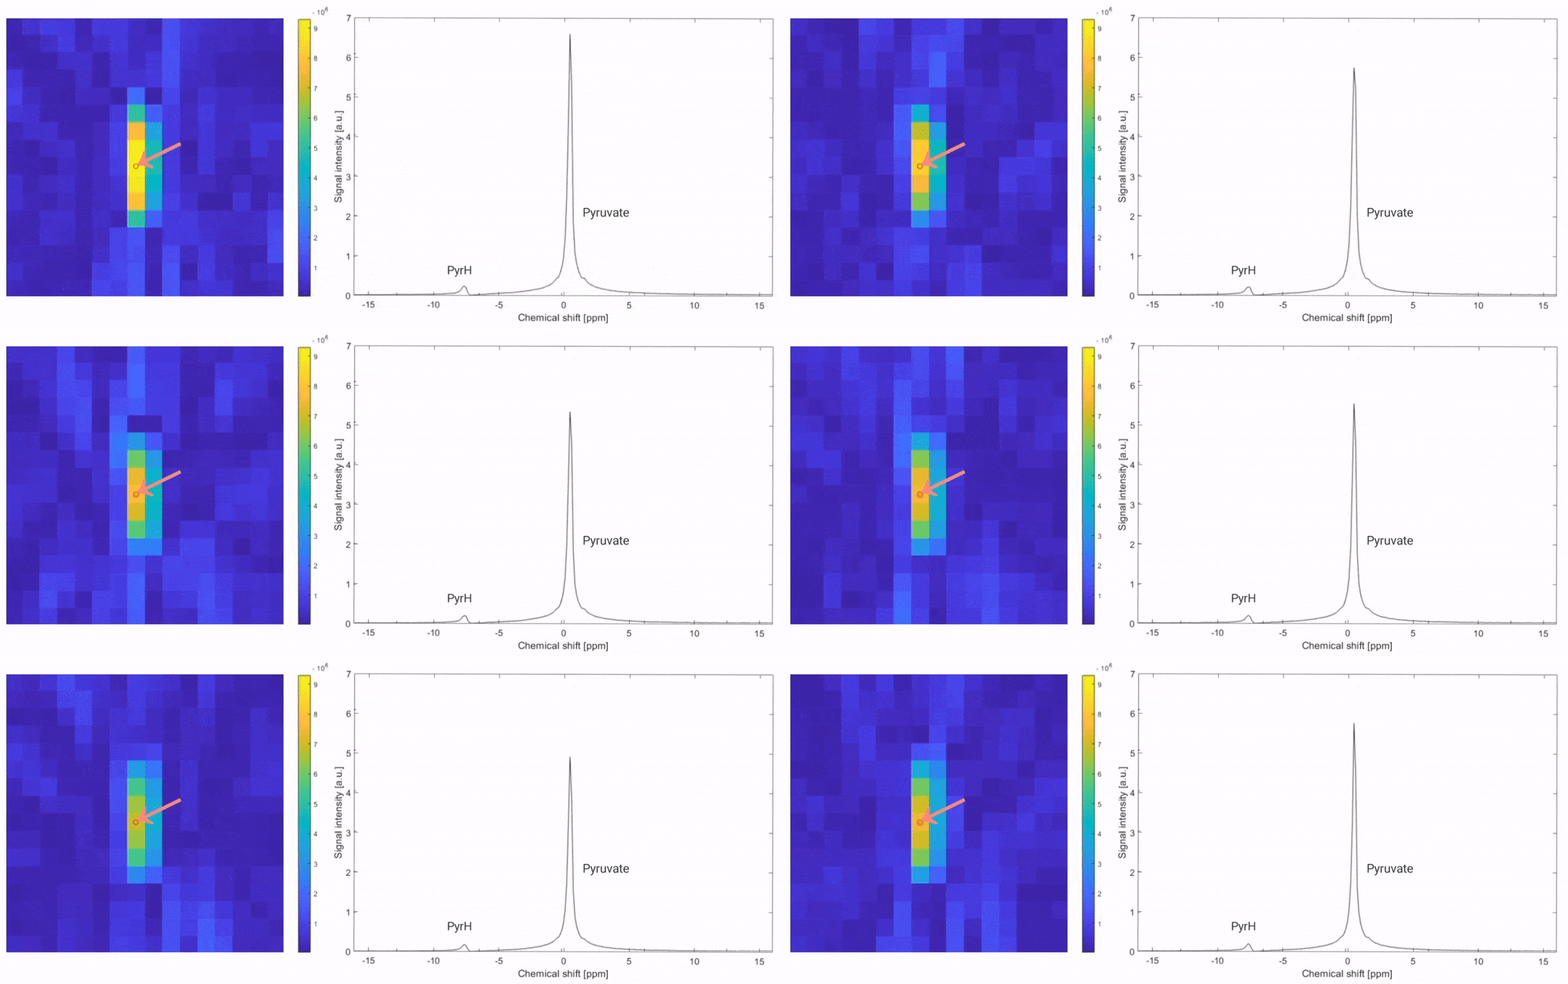
Undersampled measurement: For proof-of-concept, a 50-ml phantom with 8 mM hyperpolarized [1‐13C] pyruvate was prepared using a SPINlab polarizer (GE Healthcare) and measured on a 3T human PET/MR system (Biograph mMR, Siemens Healthineers) with a double-resonant 13C/1H volume resonator (Rapid Biomedical) and the following rEPSI sequence parameters: FOV: 200 mm, imaging matrix: 163, spectral BW: 1000 Hz, echoes: 512, flip angle: 3°, TR: 260 ms, projections: 100, undersampling factor: 4. Only the odd-numbered echoes were used for single-replacement SW reconstruction, taking 45 projections per temporal subframe (undersampling factor 9, 11.7s acquisition time per subframe), generating 56 subframes.
All data was reconstructed and processed using home-built MATLAB scripts, including a home-built gridding algorithm that distributes the radially-sampled points onto a grid in a distance-weighted manner6.
Results
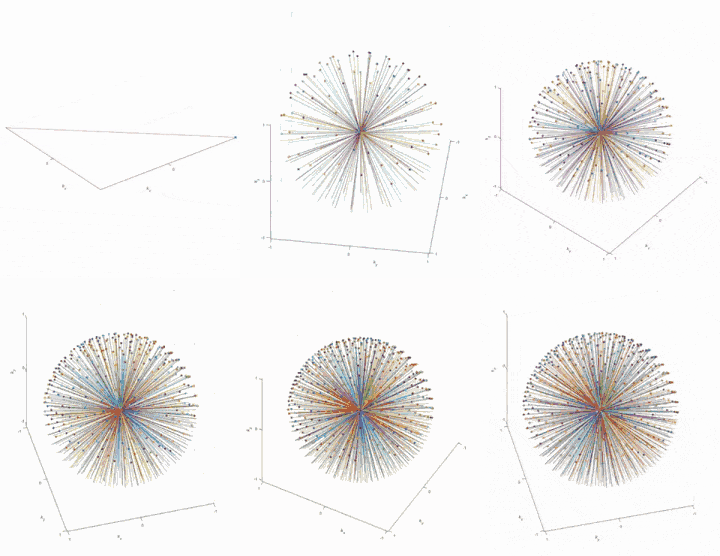
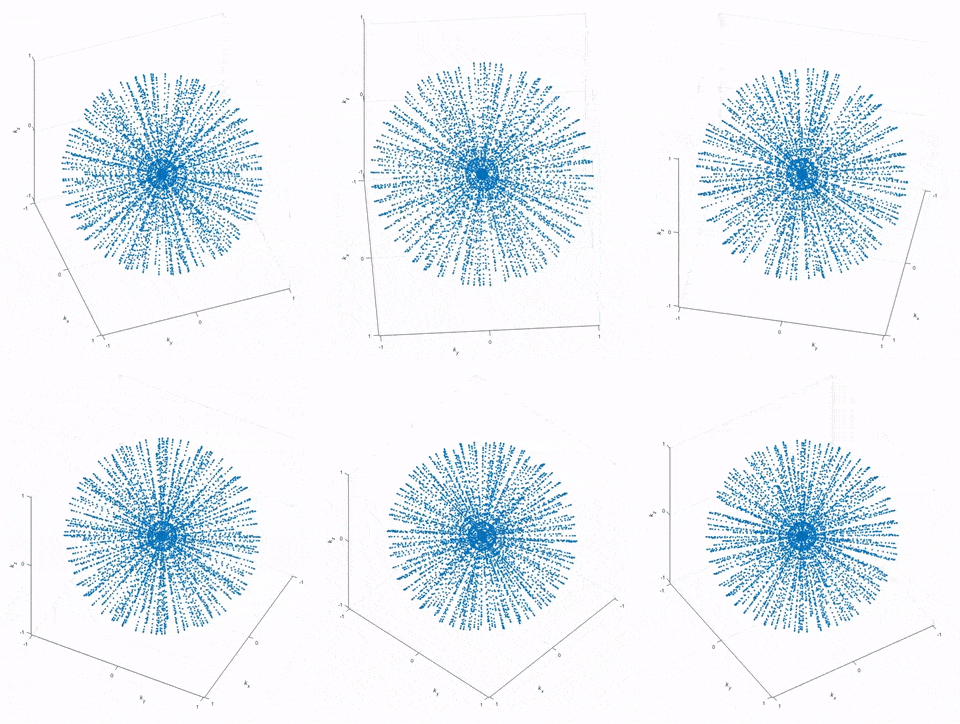
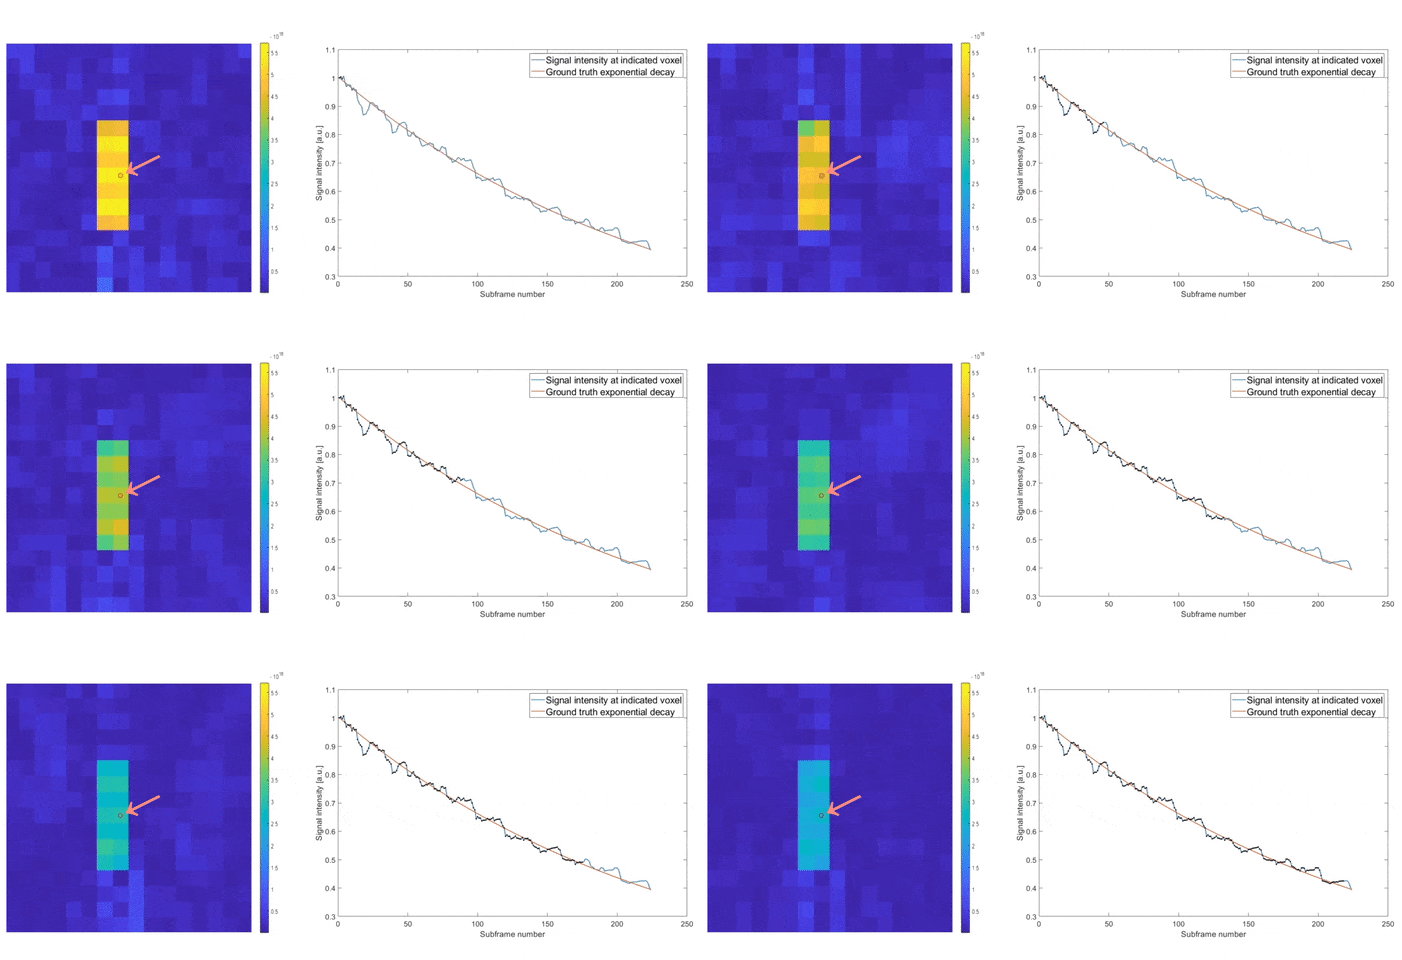
Simulation study: Figure 2 displays the filling of k-space by successive GAGA-resorted projections, with minimal temporal coherence between projections. Figure 3 shows largely homogeneous k-space sampling distributions for each single temporal subframe.The SW reconstruction in Figure 4 exhibits flickering in the signal intensity, but largely follows the expected exponential T1 decay. Small incoherent undersampling artifacts are visible in the background.
The undersampled measurement reconstructed in Figure 5 displays the expected decay of the hyperpolarized signal, but also a stronger temporal flickering in the selected spectrum, together with larger undersampling artifacts in the background.
Discussion
The temporal flickering in the simulation study can reasonably be attributed to the undersampling of k-space: some projections carry more signal than others, hence switching the projections between subframes creates flickering in the signal. Only low-intensity undersampling artifacts are visible in the background, presumably thanks to the homogeneous coverage of k-space in each subframe.The stronger temporal flickering and spatial undersampling artifacts in the hyperpolarized phantom measurement can presumably be attributed to each temporal subframe containing fewer projections than the simulation study. To investigate whether a reduction of these artifacts can be achieved, a dynamic hyperpolarized measurement with 403 projections will soon be performed.
Conclusion
In this study, we introduced the GAGA algorithm, which provides a homogeneous coverage of k-space in all temporal subframes for SW reconstruction while displaying only incoherent undersampling artifacts. Temporal flickering of the signal remains a challenge that could potentially be overcome with compressed sensing regularization techniques in the temporal dimension. The developed GAGA approach represents a promising tool for dynamic hyperpolarized 13C-MRSI measurements.Acknowledgements
No acknowledgement found.References
1. Awenius, Marcel, et al. “Three-dimensional radial echo-planar spectroscopic imaging for in vivo hyperpolarized 13C MRSI at 3 T”, ISMRM & ISMRT Annual Meeting & Exhibition, 2023.
2. d'Arcy, J.A., Collins, D.J., Rowland, I.J., Padhani, A.R. and Leach, M.O. (2002), Applications of sliding window reconstruction with cartesian sampling for dynamic contrast enhanced MRI. NMR Biomed., 15: 174-183. https://doi.org/10.1002/nbm.755
3. S. Winkelmann, T. Schaeffter, T. Koehler, H. Eggers and O. Doessel, "An Optimal Radial Profile Order Based on the Golden Ratio for Time-Resolved MRI," in IEEE Transactions on Medical Imaging, vol. 26, no. 1, pp. 68-76, Jan. 2007, doi: 10.1109/TMI.2006.885337.
4. A. Balasch, M.S. Büttner, P. Metze, K. Stumpf, M. Beer, W. Rottbauer, V. Rasche, “Tiny golden angle stack-of-stars (tygaSoS) free-breathing functional lung imaging”, Magnetic Resonance Imaging, Volume 82, 2021, Pages 24-30, ISSN 0730-725X, https://doi.org/10.1016/j.mri.2021.06.016.
5. J. A. Fessler and B. P. Sutton, "Nonuniform fast Fourier transforms using min-max interpolation," in IEEE Transactions on Signal Processing, vol. 51, no. 2, pp. 560-574, Feb. 2003, doi: 10.1109/TSP.2002.807005.
6. Ludwig, Dominik, et al. "Three‐dimensional 31 P radial echo‐planar spectroscopic imaging in vivo at 7T", ISMRM 25th Annual Meeting and Exhibition, 2017.
Figures