4253
Edited MRS of Glutamate1Department of Radiology, Children's Hospital of Philadelphia, Philadelphia, PA, United States, 2Department of Radiology and Imaging Sciences, University of Utah, Salt Lake City, UT, United States, 3Department of Diagnostic Radiology and Nuclear Medicine, University of Maryland School of Medicine, Baltimore, MD, United States, 4Department of Psychiatry, University of Utah, Salt Lake City, UT, United States, 5Russell H. Morgan Department of Radiology and Radiological Science, Johns Hopkins University School of Medicine, Baltimore, MD, United States
Synopsis
Keywords: Data Acquisition, Brain, spectral editing, gaba, glutathione, glutamate
Motivation: Spectral editing methods are widely used to measure γ-aminobutyric acid (GABA), which also co-edits glutamate (Glu) at 2.34 ppm in the sum spectrum (sum=ON+OFF). However, the co-detection of Glu at 2.34 ppm has not been assessed.
Goal(s): We demonstrate the co-editing of Glu without glutamine using HERMES of GABA and glutathione.
Approach: Simulations of HERMES and 1D J-resolved of Glu, glutamine, and GABA, followed by in vivo experiments on 137 participants.
Results: Simulations and in vivo experiments show a Glu-edited signal without overlapping glutamine and GABA signals from both methods. In vivo quantification of Glu show that the two methods are significantly correlated.
Impact: Our study demonstrates a purer measurement of Glu using HERMES without needing a separate acquisition. HERMES provides an opportunity to study Glu/GABA/glutathione concurrently to understand their relationships under homeostasis or drug interventions that might affect the glutamatergic/GABAergic/antioxidant systems.
Introduction
Proton (1H) magnetic resonance spectroscopy (MRS) is a non-invasive technique that can measure brain glutamate (Glu) levels in healthy and patient populations. The Glu spin system consists of a CH group with a chemical shift at 3.74 ppm, one CH2 group with a chemical shift centered at 2.08 ppm, and another CH2 group centered at ~2.34 ppm.1 However, the two CH2 groups provide a unique opportunity for edited detection of Glu. In the Hadamard Encoding and Reconstruction of MEGA-Edited Spectroscopy (HERMES) of GABA and GSH experiment, editing pulses are applied at 1.9 ppm to edit GABA.2 This editing scheme also partially inverts (co-edits) the Glu spins at 2.08 ppm and refocuses (co-detects) the Glu spins at 2.34 ppm. However, the co-detection of Glu at 2.34 ppm has not been assessed. Through simulations and in vivo experiments, we demonstrate the co-editing of Glu using HERMES, followed by a comparison with TE-averaged (1D J-resolved PRESS)3 Glu measurements.Methods
MRI/MRS experiments were performed using 3T Siemens MRI scanners at two research sites as part of an ABCD substudy. The central and local IRBs approved the study.Simulations: Density-matrix simulations of the Glu, Gln, γ-aminobutyric acid (GABA), and glutathione (GSH) spin systems were performed following the HERMES-PRESS (TE 80 ms) and 1D J-resolved PRESS (TEs 31-229ms with 2ms steps) experiments in MRSCloud.4 Simulations were performed using the following parameters: ideal excitation pulse; 101x101 two-dimensional spatial array in the refocusing dimensions; 8192 datapoints; 4 kHz spectral width; simulated linewidth of 2 Hz.
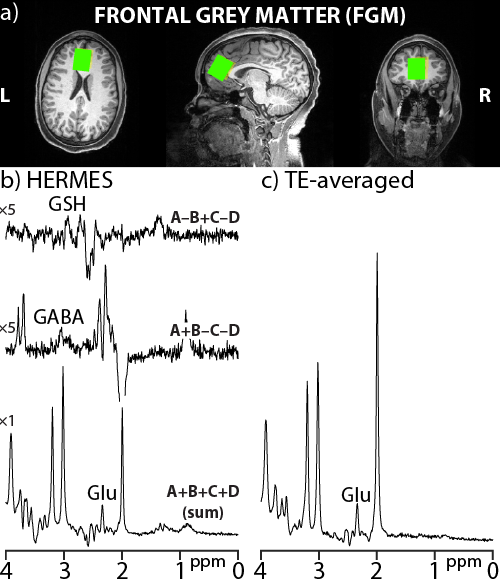
Acquisition: In vivo experiments were performed on 137 participants (64/73 girls/boys; age:13.1±0.7 years). In every participant, a whole-brain T1-weighted image was acquired to guide voxel placements in the frontal grey matter (Figure 2a). Both the HERMES2,5 and J-resolved PRESS sequences were performed with the parameters matching simulations, except 3x2.5x2.5cm3 voxel size; 2048 datapoints and 2000Hz spectralwidth; 320 transients for HERMES; four transients per TE for 1D J-PRESS.
Processing and Analysis: HERMES data were processed to generate edited and sum spectra.6 The multi-TE MRS PRESS data were processed and averaged to generate the TE-averaged data.7 The in vivo HERMES sum and TE-averaged spectra were modeled using LCModel (6.3-1N). Glu estimates were obtained from the sum and TE-averaged spectra as basis-function amplitude ratios relative to the in vivo total creatine (tCr) and corrected for T2-relaxation effects (effective TE 130 ms).8 Correlation analysis was performed using Spearman correlations to examine the association between the methods. Bland Altman analysis was performed to determine agreement between the methods. Between-subject coefficients of variation (CV) were calculated as the standard deviation of Glu/tCr divided by their corresponding mean. All values are presented as mean or mean±SD unless stated otherwise.
Results
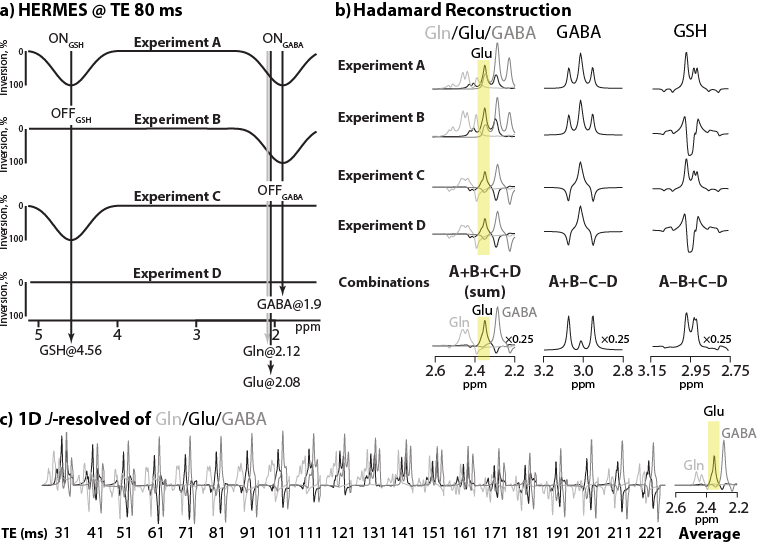
Simulated Experiments: Density matrix simulations following the HERMES experiment are shown in Figures 1a and b. As expected, simulated sub-experiments showed the modulation of the spin systems across all four sub-experiments. The Hadamard combination of sub-experiments A+B+C+D (sum) yielded Glu without the Gln and GABA overlap. Other Hadamard combinations produced the GABA-edited or GSH-edited signal.In the TE-averaged experiment, the multiplet pattern and intensity of the Glu, Gln, and GABA signals change with TE due to the coupling evolution (Figure 1c). The TE-averaged spectrum averaged the data and canceled the outer peaks, yielding a well-resolved Glu signal without the Gln and GABA overlap. Consequently, the TE-averaged Glu signal closely matched the Glu-edited signal from the HERMES sum spectrum.
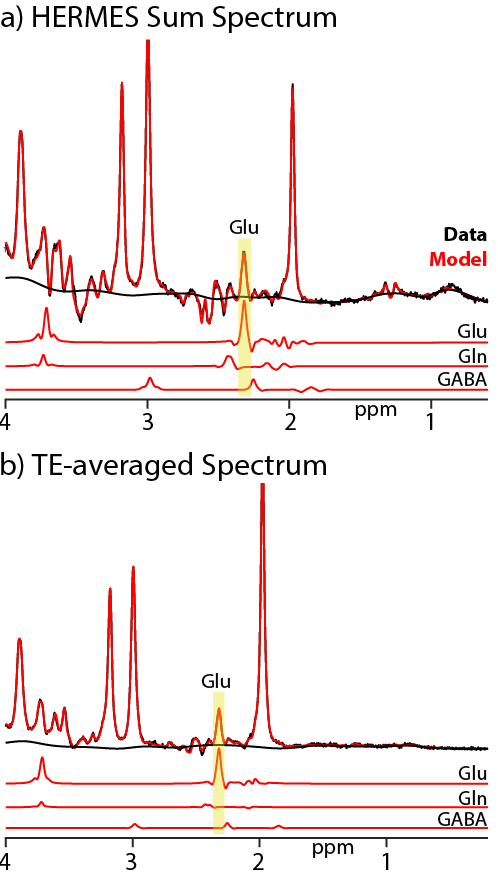
In Vivo Experiments: Figures 2b and c show typical HERMES sum, HERMES-edited, and TE-averaged spectra from the brain. The HERMES sum spectrum shows a well-resolved Glu-edited signal at 2.34 ppm. Figure 3 shows HERMES and TE-averaged spectra overlaid with their respective Glu, Gln, and GABA models from the LCModel fitting.
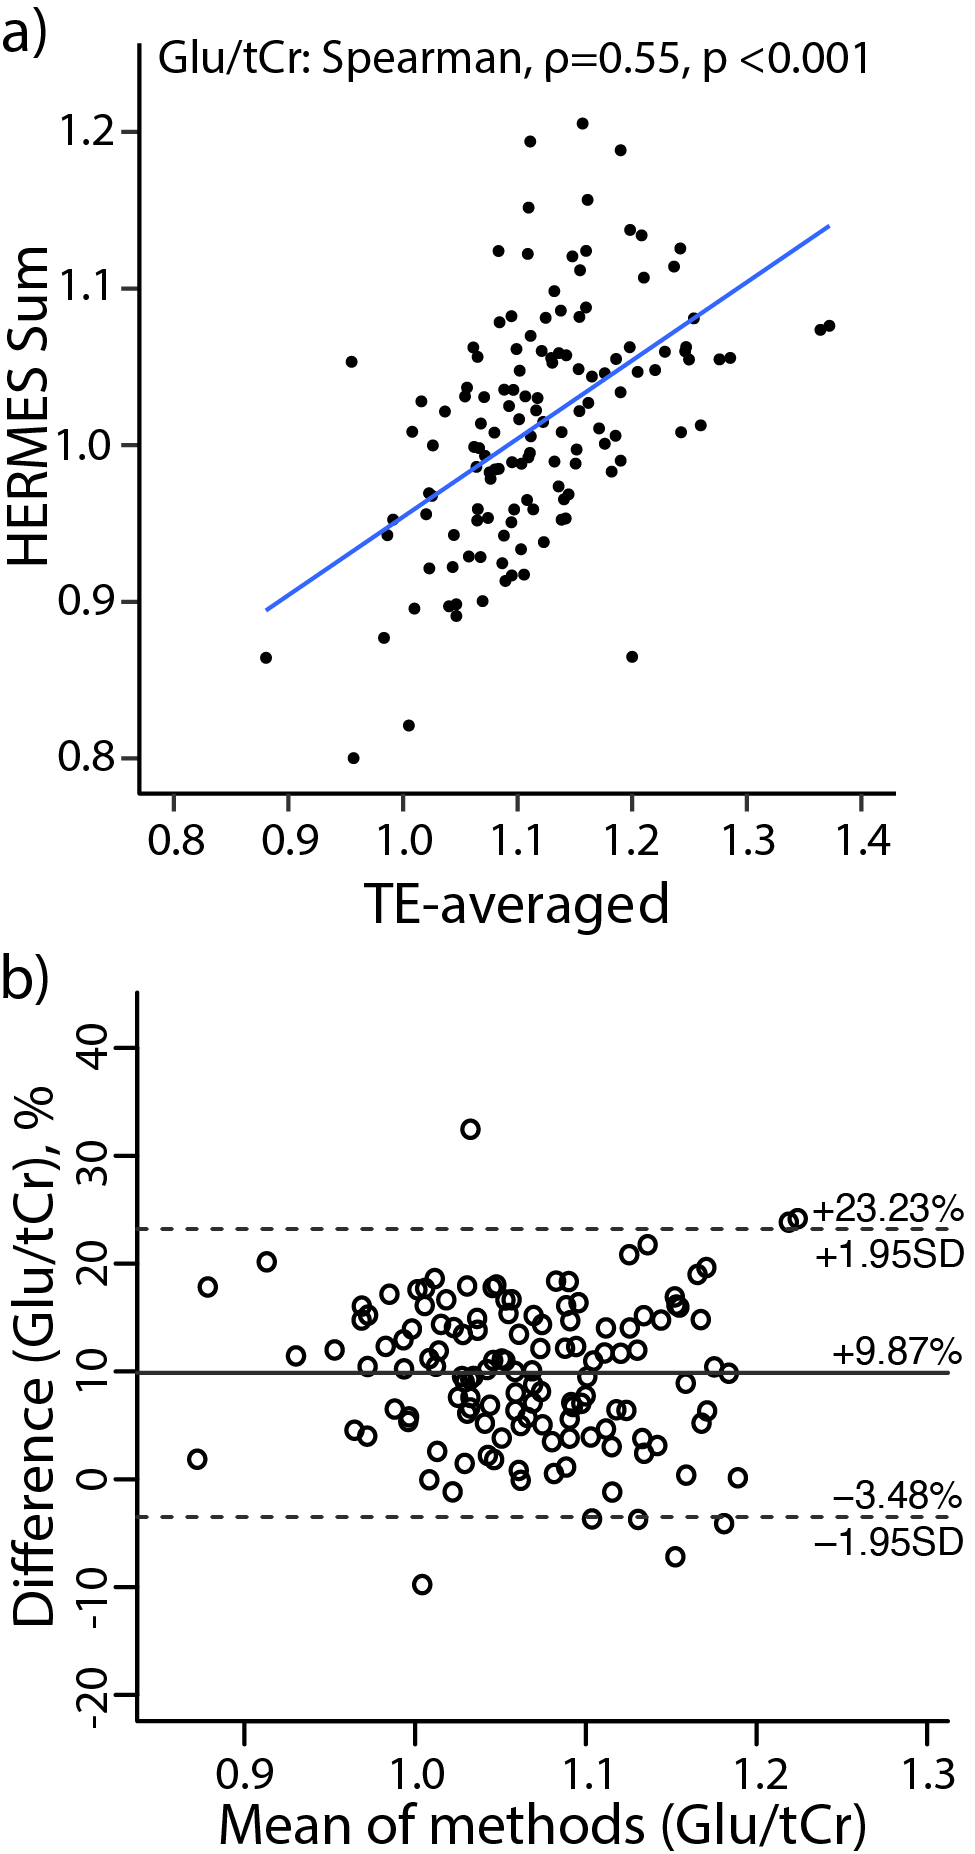
Glu/tCr estimates from HERMES were lower than those from the TE-averaged method (HERMES/TE-averaged: 1.01±0.07/1.12±0.08). Between-subject CV in Glu measurements were similar (~7.3%/~6.9%). The correlations and Bland Altman analysis (Figure 4) revealed a significant correlation and ~10% bias (~20% before T2 correction) between the two methods.
Discussion
The HERMES and TE-averaged simulations and in vivo data demonstrate excellent separation of Glu from Gln, with similar in vivo measurement variations and a significant correlation between the two methods. In vivo experiments revealed an improvement in bias after the T2 correction. The remaining bias could be due to the differences in macromolecular contribution, but the in vivo MM profile for both methods can be acquired using an inversion pulse before localization and included in the basis functions. In conclusion, HERMES studies promise the accurate measurement of Glu without needing a separate TE-averaged acquisition.Acknowledgements
This work was supported by NIH grants R00DA051315, R21DA047673, U01DA041134, U01DA041117, R01EB016089, R01EB023963, P41EB031771.References
1. Govindaraju V, Young K, Maudsley AA. Proton NMR chemical shifts and coupling constants for brain metabolites. NMR in Biomedicine. 2000;13(3):129-53.
2. Saleh MG, Oeltzschner G, Chan KL, Puts NA, Mikkelsen M, Schär M, et al. Simultaneous edited MRS of GABA and glutathione. NeuroImage. 2016;15:576-82.
3. Hurd R, Sailasuta N, Srinivasan R, Vigneron DB, Pelletier D, Nelson SJ. Measurement of brain glutamate using TE-averaged PRESS at 3T. Magn Reson Med. 2004;51(3):435-40.
4. Hui SC, Saleh MG, Zöllner HJ, Oeltzschner G, Fan H, Li Y, et al. MRSCloud: A cloud‐based MRS tool for basis set simulation. Magnetic resonance in medicine. 2022;88(5):1994-2004.
5. Saleh MG, Rimbault D, Mikkelsen M, Oeltzschner G, Wang AM, Jiang D, et al. Multi-vendor standardized sequence for edited magnetic resonance spectroscopy. NeuroImage. 2019;189:425-31.
6. Mikkelsen M, Saleh MG, Near J, Chan KL, Gong T, Harris AD, et al. Frequency and phase correction for multiplexed edited MRS of GABA and glutathione. Magnetic resonance in medicine. 2018;80(1):21-8.
7. Prescot AP, Renshaw PF. Two‐dimensional J‐resolved proton MR spectroscopy and prior knowledge fitting (ProFit) in the frontal and parietal lobes of healthy volunteers: assessment of metabolite discrimination and general reproducibility. Journal of Magnetic Resonance Imaging. 2013;37(3):642-51.
8. Mullins PG, Chen H, Xu J, Caprihan A, Gasparovic C. Comparative reliability of proton spectroscopy techniques designed to improve detection of J-coupled metabolites. Magn Reson Med. 2008;60(4):964-9.
Figures