4251
Sodium Quantification in the Abdomen at 3 T1Department of Radiology, University of Cambridge, Cambridge, United Kingdom, 2Department of Radiology, Haukeland University Hospital Helse Bergen, Bergen, Norway, 3Cambridge Cardiovascular, University of Cambridge, Cambridge, United Kingdom
Synopsis
Keywords: Quantitative Imaging, Non-Proton, Data Analysis
Motivation: Sodium homeostasis is altered in abdominal pathologies such as cancer and cardiovascular disease, but established quantification techniques require an invasive biopsy.
Goal(s): Quantification of abdominal sodium content and T2* relaxation in abdominal organs and fluid-filled structures using 23Na-MRI.
Approach: Proton and sodium imaging of the abdomen was performed in 18 healthy volunteers using a 3D cones sequence and a sodium-tuned body coil on a clinical 3 T system.
Results: Mean total sodium concentration and long T2* relaxation times were measured in 8 organs and fluid-filled structures; results agreed with previously published work in human and animal models.
Impact: Quantitative 23Na-MRI measurements in healthy volunteers will serve as a baseline to evaluate pathological changes in hypertension and kidney tumour characterisation. This may assist in the assessment of treatment efficacy, thereby reducing the need for invasive biopsy techniques.
INTRODUCTION
Cellular metabolism can be probed by imaging MR-active X-nuclei such as sodium-23. Sodium exchange between cells and extra-cellular fluid plays an essential role in regulating blood volume, pressure and pH, as well as neuronal activation and maintaining cellular resting potential1. Existing sodium quantification techniques in routine clinical use are nonspecific (e.g. urinary osmolarity2) or require invasive tissue procurement.Recent human sodium imaging studies have included tumour characterisation in the ovaries3 and prostate4. Quantitative proton relaxation time mapping has been demonstrated in tumour hypoxia imaging5 and rectal cancer prognosis6. However, measurements of normal sodium concentration across tissues measured via 23Na-MRI in the literature vary. Establishing 23Na-MRI as a quantitative imaging biomarker for cellular integrity and metabolism in cancer staging is therefore important.
METHODS
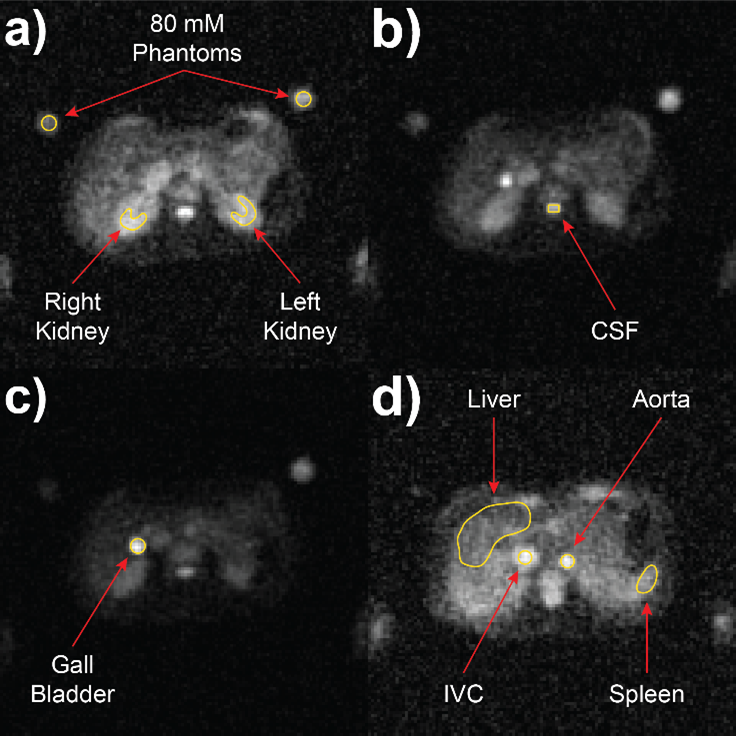
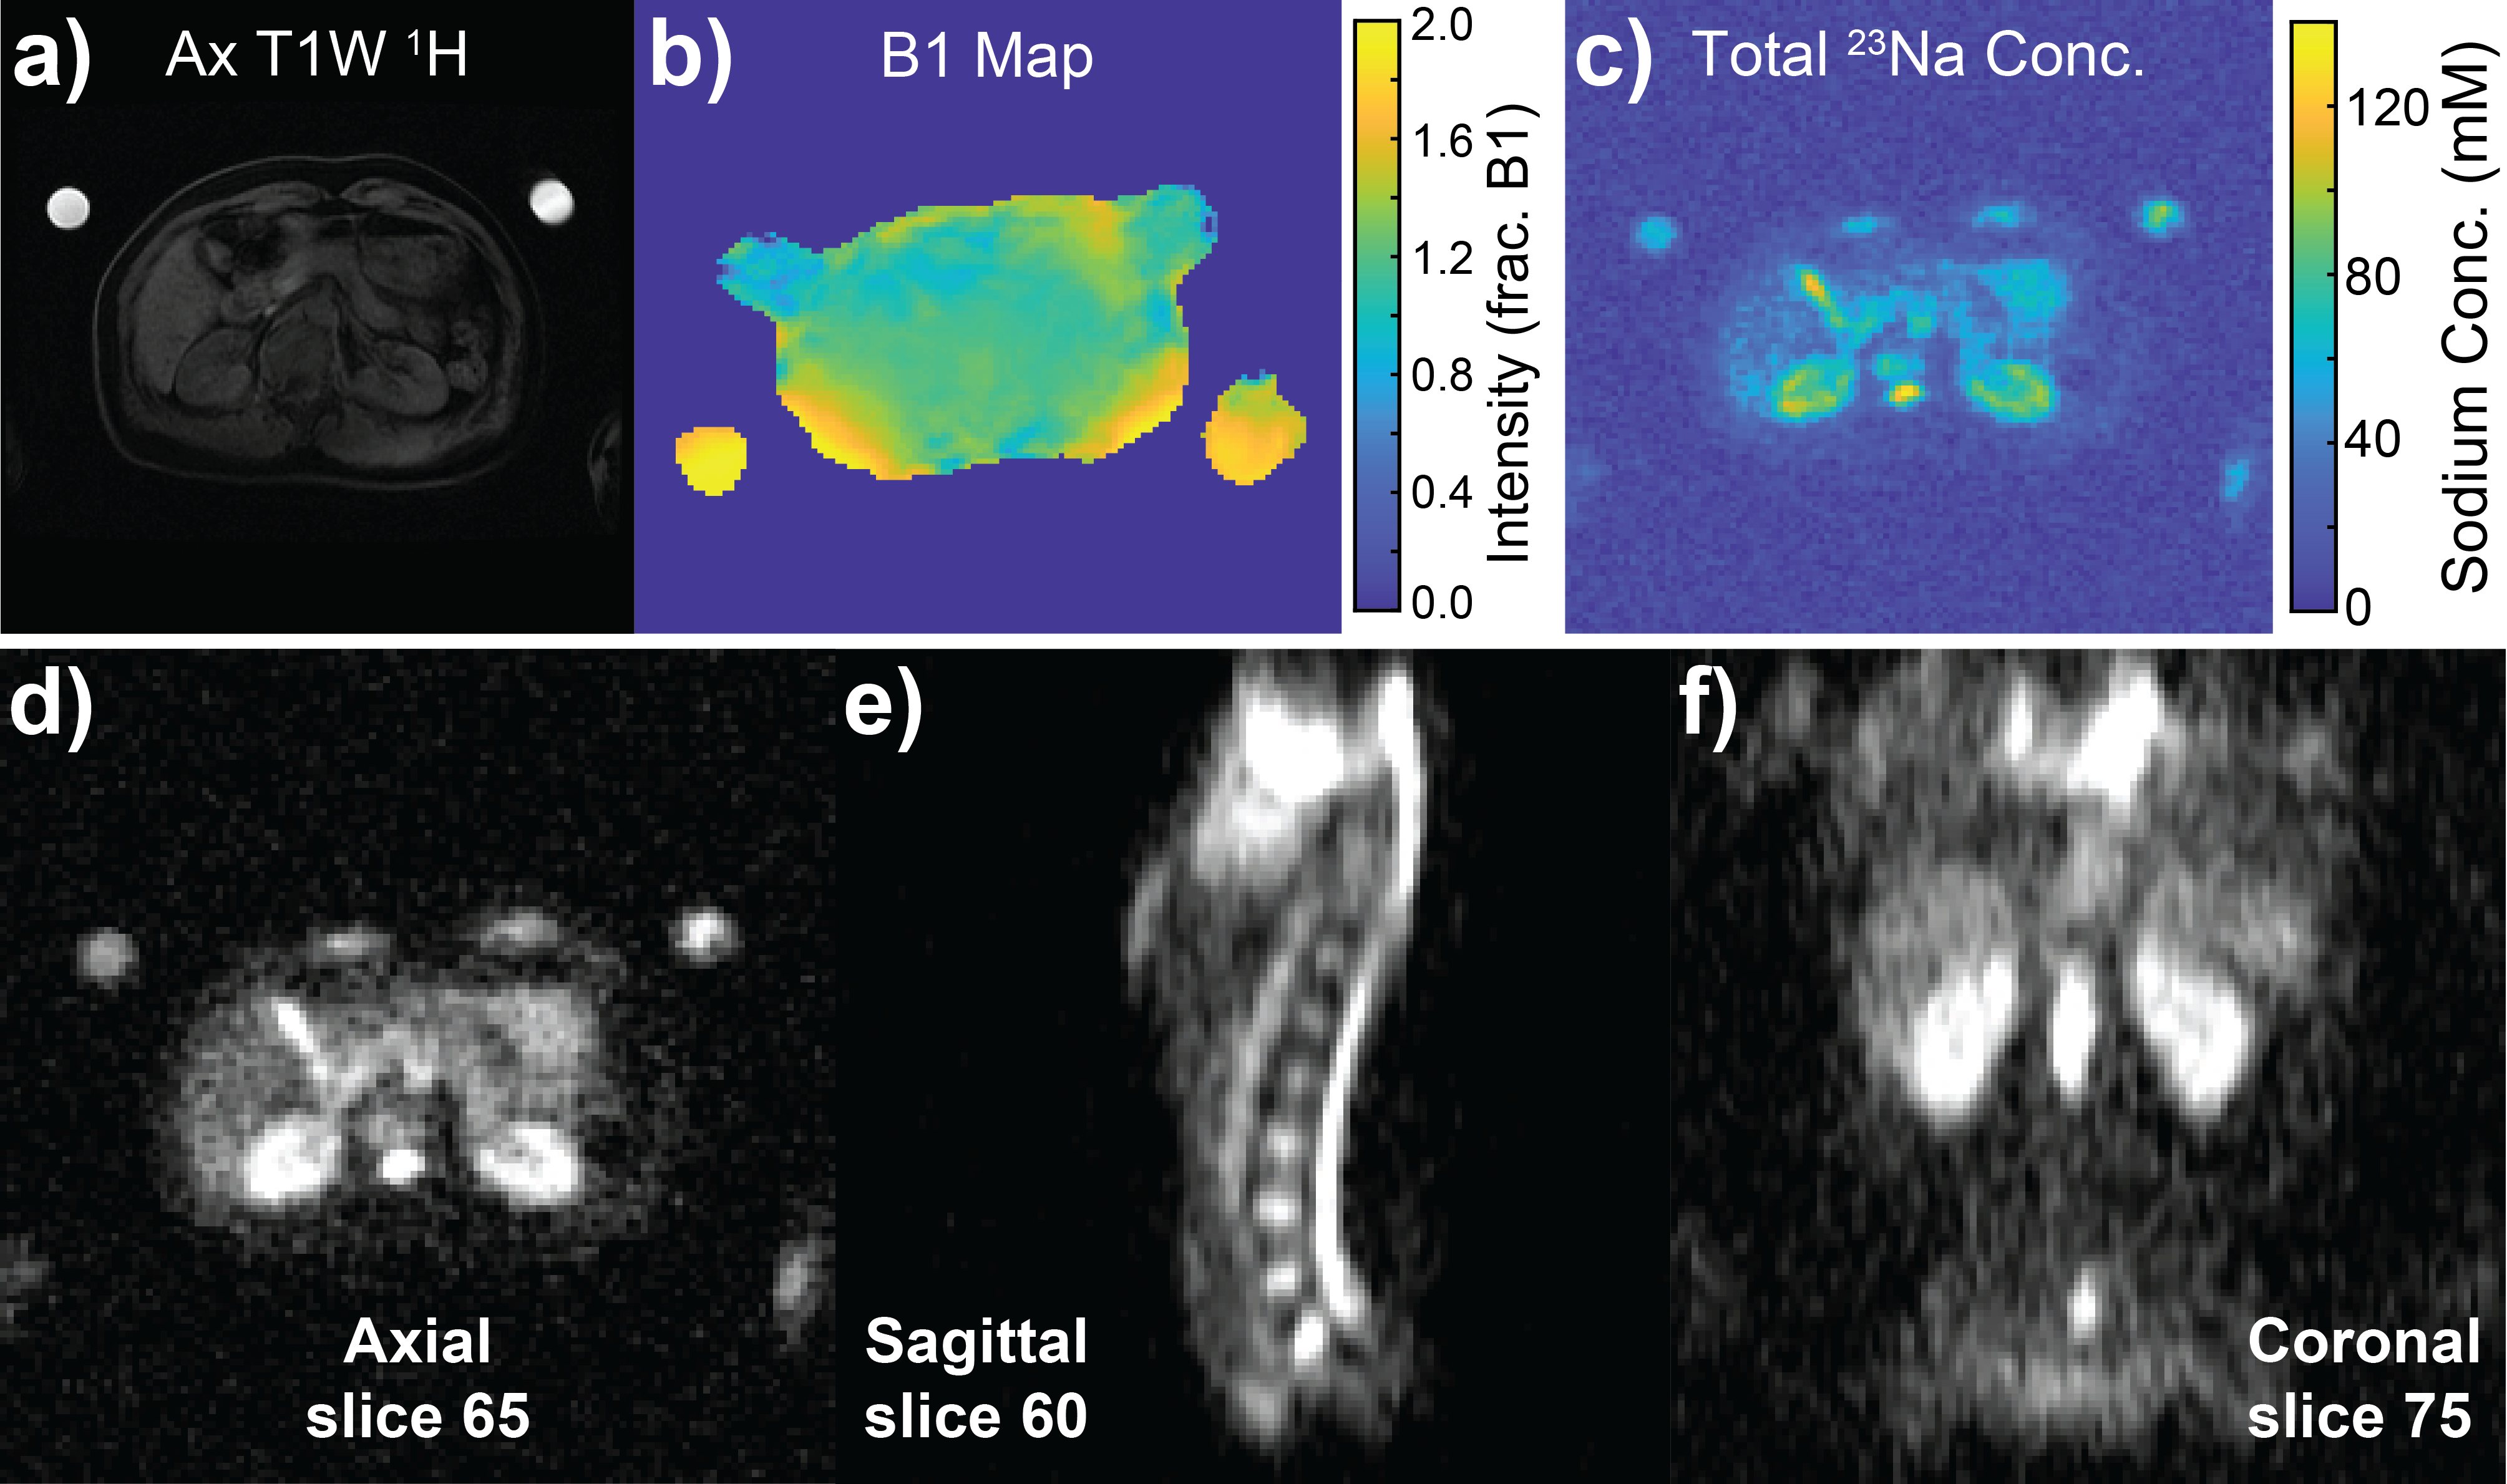
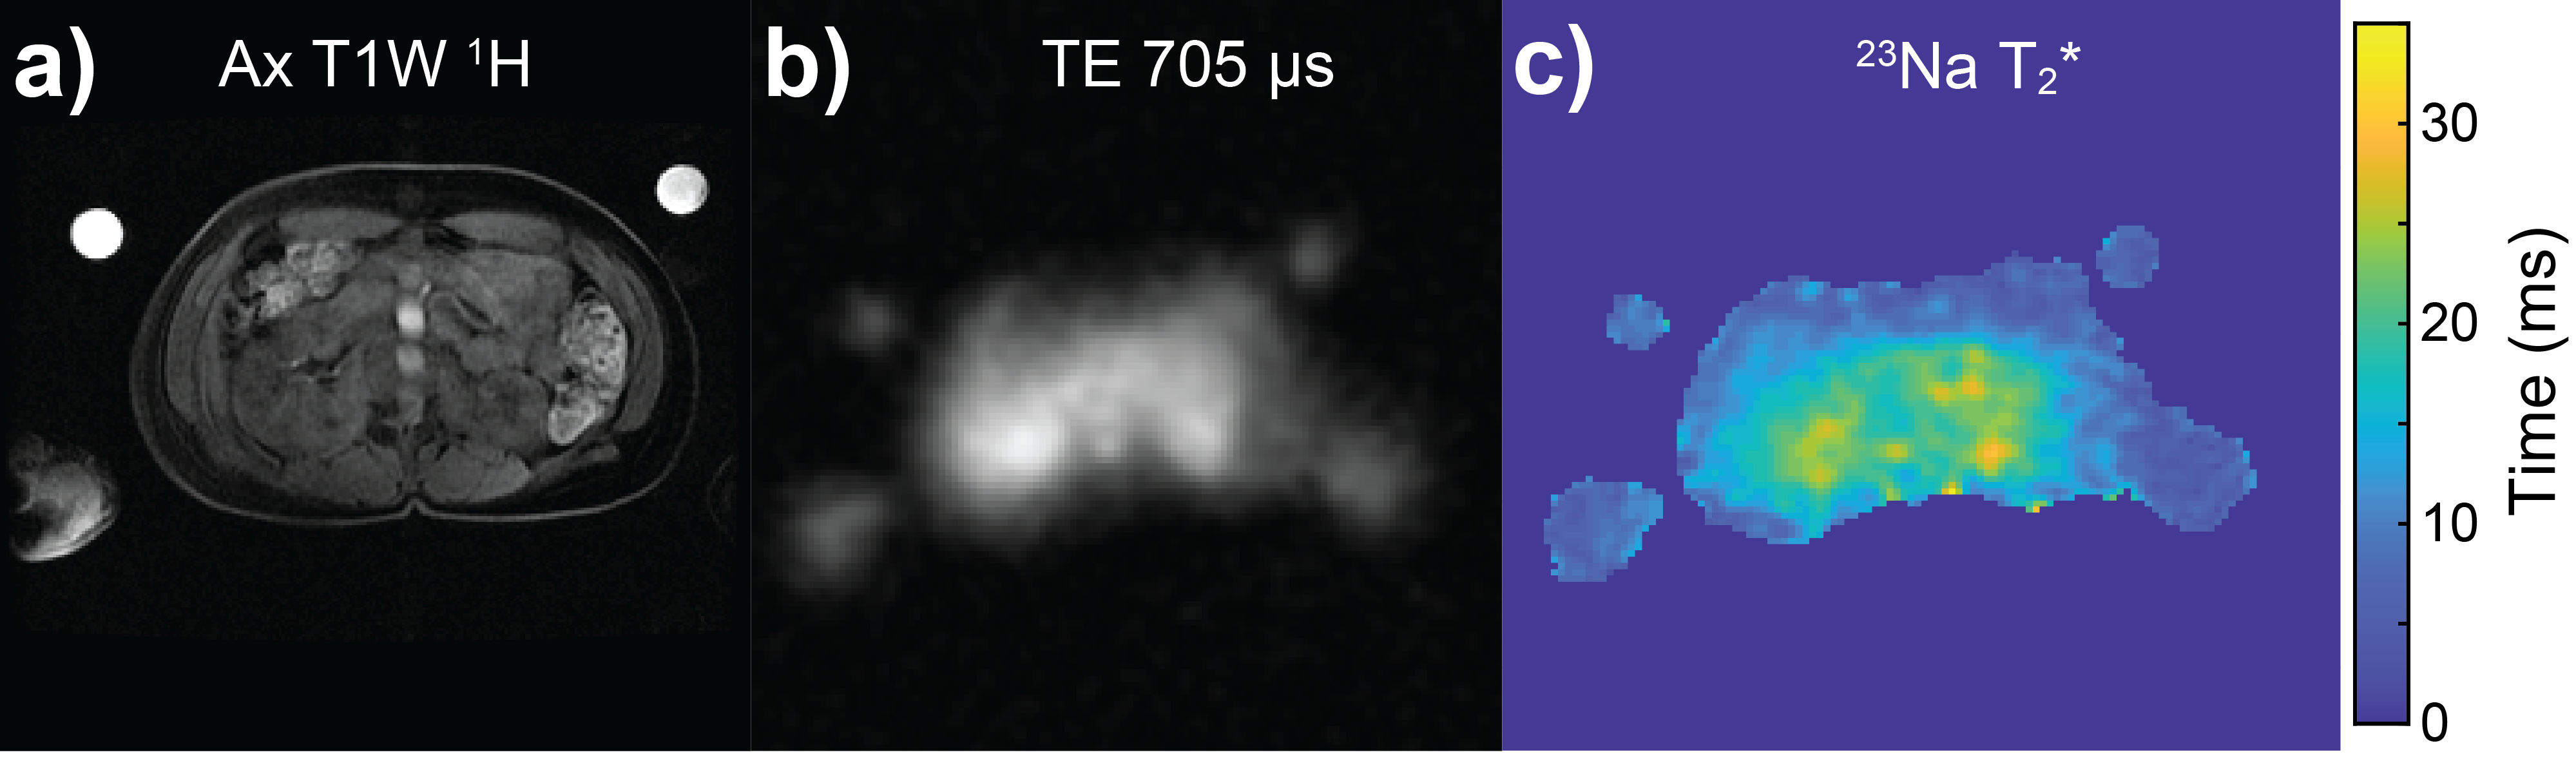
We quantified total 23Na concentration and T2* relaxation in eight abdominal organs and fluid-filled structures of healthy volunteers (N=18, 11M/7F) using a clinical 3 T system (MR750, GE Healthcare, Waukesha MI). Sodium images were acquired using a 48 cm field-of-view, 4-rung birdcage transmit/receive body coil (RAPID Biomedical GmbH, Rimpar, Germany), providing uniform excitation over a large proportion of the abdomen in subjects with a range of body habitus7. Corresponding fat/water proton images were acquired using a breath-hold 3D T1W sequence with the MR system body T/R coil (TEs=1.1/2.2 ms, TR=3.7 ms, flip=15°, matrix=256x192, phase FOV=0.7, FOV=40 cm). Two agarose NaCl phantoms (50 ml, 80 mM) provided signal calibration.High-resolution total sodium concentration (TSC) maps were acquired over a 48 cm FOV using a 3D cones trajectory8 (TE=705 μs, TR=100 ms, flip=70°, averages=5, voxel size=4x4x8 mm, 1402 transients, bandwidth=167 kHz, duration=11:41 mins)–Figure 2d-f. B1 non-uniformity correction was performed using the double-angle method9,10 (TE=705 μs, TR=150 ms, flips=40/80°, averages=3, voxel size=9x9x9 mm)–Figure 2b. Maps of 23Na long T2* component were generated by linear fitting of log-transformed signal intensities from variable echo-time data (TEs=2/4/8/16 ms, TR=150 ms, flip=70°, averages=4, voxel size=9x9x9 mm)–Figure 3b. Low-resolution images spatially matched the high-resolution counterpart. Regions of interest were drawn and analysed using MATLAB (MathWorks, Natick MA) for phantoms, kidneys, CSF, liver, gall bladder, spleen, aorta and inferior vena cava–Figure 1.
RESULTS
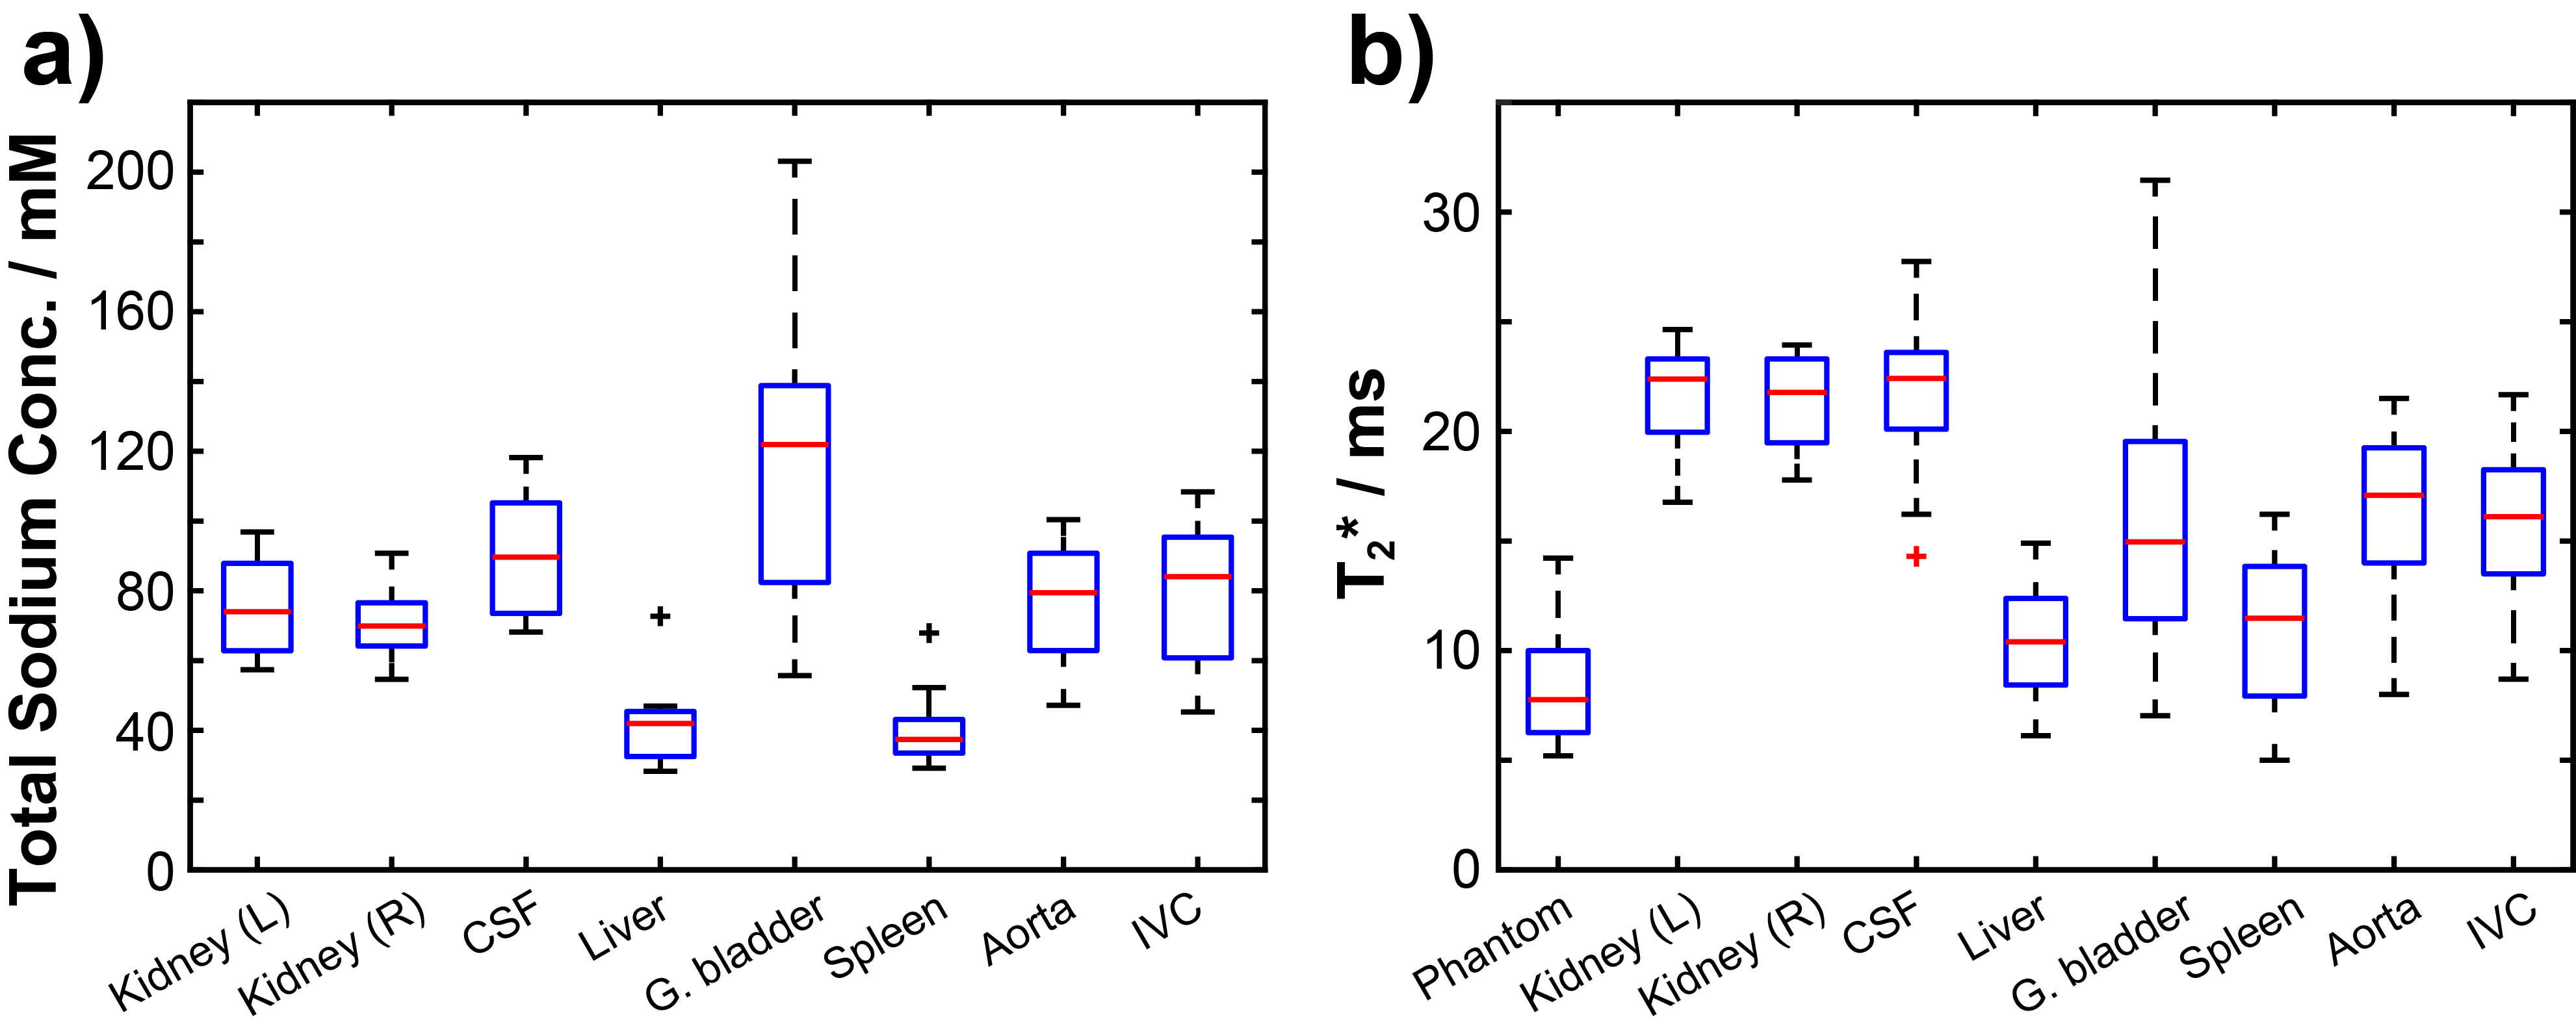
Mean TSC (example B1-uncorrected map pictured in Figure 2c) was highest in the gall bladder (124±44 mM) and CSF (93±19 mM). Values of 77±14 mM and 72±10 mM were determined in the left and right kidneys, respectively. Blood TSC values of 78±17 and 83±22 mM were observed in the aorta and inferior vena cava. The liver and spleen demonstrated the lowest sodium concentrations: 41±10 mM and 40±9 mM, respectively.23Na long T2* component values (example map pictured in Figure 3c) for all regions generally fell within the range of previously-reported values1,11: 21.8±2.1 ms and 21.2±2.2 ms (kidneys), 21.7±3.6 ms (CSF), 10.2±2.2 ms (liver) and 10.9±3.5 ms (spleen). A complete summary of results is displayed in Figure 4.
DISCUSSION
23Na TSC measurements in gall bladder and CSF were lower than previous reports of ~150 mM sodium concentration in bile12 and CSF13. Mean TSC values in blood corresponded to normal blood TSC ranges for healthy adults of 135-145 mM14,15. Liver TSC values agreed with previously-reported studies in healthy rat hepatocyte16,17, but exceeded those seen previously in human studies18. Kidney TSC values were comparable with previous human 23Na-MRI quantification estimates in vivo19,20.23Na long T2* measurements in the kidneys agreed with previous reports in humans at 3 T20 and 7 T21,22, but values in CSF were substantially lower23. Shorter liver and spleen 23Na T2* values correlate with previous proton studies linking short T2* tissue components to high paramagnetic iron content24-27. High variability for both parameters in small regions with high fluid content was expected due to fluid motion and partial volume effects resulting from limited spatial resolution achievable in a practicable imaging duration. Comparisons with findings elsewhere in the literature are presented in Table 1.
Reliability of 23Na TSC quantification could be improved using a linear fit through multiple phantoms with different concentrations, as demonstrated in studies of the leg28 and intervertebral disk29. Analysis of anatomical TSC variation and correlations with other MR-based metrics could be facilitated by registration of anatomical 1H and B1-corrected TSC maps.
CONCLUSIONS
Reliable quantification of TSC and 23Na long component T2* was achieved in the kidneys, liver and spleen across a healthy volunteer group. Greater variability observed in the gall bladder, blood vessels and CSF could be improved via higher resolution with longer scan times or ECG-triggered acquisition, but the priority here was for clinical tolerability. In the future, these techniques will be applied to characterise patients with kidney cancer, hypertension and other pathologies.Acknowledgements
This research was supported by the NIHR Cambridge Biomedical Research Centre (BRC-1215-20014). The views expressed are those of the authors and not necessarily those of the NIHR or the Department of Health and Social Care. JB acknowledges support from the National Cancer Imaging Translational Accelerator (NCITA). MM acknowledges support from the Cambridge Experimental Cancer Medicine Centre and the Cancer Research UK Cambridge Centre. FG acknowledges support from Cancer Research UK and The Mark Foundation Institute for Integrated Cancer Medicine (MFICM).References
1. Ouwerkerk, R., Sodium MRI, in Magnetic Resonance Neuroimaging: Methods and Protocols, M. Modo and J.W.M. Bulte, Editors. 2011, Humana Press: Totowa, NJ. p. 175-201.
2. Akbari, A., et al., Functional Sodium MRI Helps to Measure Corticomedullary Sodium Content in Normal and Diseased Human Kidneys. Radiology, 2022. 303(2): p. 384-389.
3. Deen, S.S., et al., Sodium MRI with 3D-cones as a measure of tumour cellularity in high grade serous ovarian cancer. European Journal of Radiology Open, 2019. 6: p. 156-162.
4. Barrett, T., et al., Quantification of Total and Intracellular Sodium Concentration in Primary Prostate Cancer and Adjacent Normal Prostate Tissue With Magnetic Resonance Imaging. Invest Radiol, 2018. 53(8): p. 450-456.
5. O'Connor, J.P.B., S.P. Robinson, and J.C. Waterton, Imaging tumour hypoxia with oxygen-enhanced MRI and BOLD MRI. The British Journal of Radiology, 2019. 92(1096): p. 20180642.
6. Peng, Y., et al., Quantitative T2*-Weighted Imaging and Reduced Field-of-View Diffusion-Weighted Imaging of Rectal Cancer: Correlation of R2* and Apparent Diffusion Coefficient With Histopathological Prognostic Factors. Front Oncol, 2021. 11: p. 670156.
7. Kaggie, J.D., et al., Combined (23) Na and (13) C imaging at 3.0 Tesla using a single-tuned large FOV birdcage coil. Magn Reson Med, 2021. 86(3): p. 1734-1745.
8. Gurney, P.T., B.A. Hargreaves, and D.G. Nishimura, Design and analysis of a practical 3D cones trajectory. Magnetic Resonance in Medicine, 2006. 55(3): p. 575-582.
9. Akoka, S., et al., Radiofrequency map of an NMR coil by imaging. Magnetic Resonance Imaging, 1993. 11(3): p. 437-441.
10. Cunningham, C.H., J.M. Pauly, and K.S. Nayak, Saturated double-angle method for rapid B1+ mapping. Magn Reson Med, 2006. 55(6): p. 1326-33.
11. Riemer, F., et al., Bi-exponential 23Na T2* component analysis in the human brain. NMR in Biomedicine, 2018. 31(5): p. e3899.
12. Furey, A.T., Hyponatremia after choledochostomy and T tube drainage. The American Journal of Surgery, 1966. 112(6): p. 850-855.
13. Harrington, M.G., et al., Cerebrospinal fluid sodium rhythms. Cerebrospinal Fluid Res, 2010. 7: p. 3.
14. Dmitrieva, N.I., et al., Middle age serum sodium levels in the upper part of normal range and risk of heart failure European Heart Journal, 2022. 43(35): p. 3335-3348.
15. Billett, H.H., Hemoglobin and Hematocrit, in Clinical Methods: The History, Physical, and Laboratory Examinations, H.K. Walker, W.D. Hall, and J.W. Hurst, Editors. 1990: Boston.
16. Hooper, G. and D.A. Dick, Nonuniform distribution of sodium in the rat hepatocyte. Journal of General Physiology, 1976. 67(4): p. 469-474.
17. Tsunooka, K. and H. Morita, Effect of a chronic high-salt diet on whole-body and organ sodium contents of Dahl rats. Journal of Hypertension, 1997. 15(8): p. 851-856.
18. James, J.R., et al., In vivo sodium MR imaging of the abdomen at 3T. Abdom Imaging, 2015. 40(7): p. 2272-80.
19. Grist, J.T., et al., Visualization of sodium dynamics in the kidney by magnetic resonance imaging in a multi-site study. Kidney International, 2020. 98(5): p. 1174-1178.
20. Haneder, S., et al., Quantitative in vivo 23Na MR imaging of the healthy human kidney: determination of physiological ranges at 3.0T with comparison to DWI and BOLD. Magnetic Resonance Materials in Physics, Biology and Medicine, 2013. 26(6): p. 501-509.
21. Haneder, S., et al., In vivo sodium (23Na) imaging of the human kidneys at 7 T: Preliminary results. European Radiology, 2014. 24(2): p. 494-501.
22. Zbn, S., et al., Sodium T2* Mapping of the Human Kidneys in Vivo at 7 Tesla. Proc. Intl. Soc. Mag. Reson. Med., 2013. 21: p. 4142.
23. Nagel, A.M., et al., The Potential of Relaxation-Weighted Sodium Magnetic Resonance Imaging as Demonstrated on Brain Tumors. Investigative Radiology, 2011. 46(9): p. 539-547.
24. Bernardino, M.E., et al., Multiple NMR T2 relaxation values in human liver tissue. AJR Am J Roentgenol, 1983. 141(6): p. 1203-8.
25. Hernando, D., et al., Quantification of liver iron with MRI: state of the art and remaining challenges. J Magn Reson Imaging, 2014. 40(5): p. 1003-21.
26. Westwood, M.A., et al., Interscanner reproducibility of cardiovascular magnetic resonance T2* measurements of tissue iron in thalassemia. J Magn Reson Imaging, 2003. 18(5): p. 616-20.
27. Schwenzer, N.F., et al., T2* Relaxometry in Liver, Pancreas, and Spleen in a Healthy Cohort of One Hundred Twenty-Nine Subjects–Correlation With Age, Gender, and Serum Ferritin. Investigative Radiology, 2008. 43(12).
28. Gast, L.V., et al., Assessing muscle-specific potassium concentrations in human lower leg using potassium magnetic resonance imaging. NMR Biomed, 2023. 36(1): p. e4819.
29. Çavuşoğlu, M., et al., Quantitative 23Na-MRI of the intervertebral disk at 3 T. NMR in Biomedicine, 2022. 35(8): p. e4733.
30. Vaeggemose, M., R.F. Schulte, and C. Laustsen, Clinically feasible B1 field correction for multi-organ sodium imaging at 3 T. NMR in Biomedicine, 2023. 36(2): p. e4835.
Figures