4247
A water relaxometry atlas for tissue correction of MRS data1The Russell H. Morgan Department of Radiology and Radiological Science, Johns Hopkins University School of Medicine, Baltimore, MD, United States, 2F.M. Kirby Research Center for Functional Brain Imaging, Kennedy Krieger Institute, Baltimore, MD, United States, 3Center for Cognitive Aging and Memory (CAM), McKnight Brain Institute, Department of Clinical and Health Psychology, University of Florida, Gainesville, FL, United States, 4Center for Imaging Science and Institute for Computational Medicine, Dept of Biomedical Engineering, JHU, Baltimore, MD, United States, 5Developing Brain Institute, Children’s National Hospital, Washington, DC, United States, 6Departments of Radiology, The George Washington University School of Medicine and Health Sciences, Washington, DC, United States, 7Departments of Pediatrics, The George Washington University School of Medicine and Health Sciences, Washington, DC, United States, 8University of Florida, Center for Cognitive Aging and Memory (CAM), College of Public Health and Health Professions, Clinical Heath and Psychology, Gainesville, FL, United States, 9Waisman Center, University of WI-Madison, Madison, WI, United States, 10Department of Pediatrics, Division of Neonatology and Newborn Nursey, University of WI-Madison, School of Medicine and Public Health, Madison, WI, United States, 11Department of Medical Physics, University of WI-Madison, School of Medicine and Public Health, Madison, WI, United States, 12The Center for Imaging Science, the Johns Hopkins University, Baltimore, MD, United States
Synopsis
Keywords: Quantitative Imaging, Relaxometry, quantitative, MRS, T1T2 maps
Motivation: Water-referenced metabolite quantification in MRS often relies upon fixed water-relaxation reference times, ignoring differences in relaxation across the brain and lifespan.
Goal(s): To develop a water relaxometry atlas to integrate location- and age-appropriate relaxation values into the MRS analysis workflow.
Approach: DESPOT was used to collected quantitative T1 and T2 images in a cohort of 52 subjects aged 20-70 years old, and morphed to standard-space to generate a relaxometry aging atlas. We also perform a parcel-wise assessment of age-related relaxation changes.
Results: The high-resolution water relaxometry aging atlas indicates significant changes in water relaxometry across the lifespan in many brain regions.
Impact: Access to whole-brain relaxometry reference values, with appropriate consideration of aging, is vital to accurate water-referenced metabolite quantification in MRS.
Introduction
In vivo Magnetic Resonance Spectroscopy (MRS) non-invasively detects signals from metabolites in the brain. Although these signals increase linearly with metabolite concentration, quantification in absolute units remains an on-going challenge. The most commonly used approach is to use the unsuppressed water signal from the same volume as a reference signal1, assuming some water concentration and correcting for the relaxation of metabolite signals and differences in the relaxation of water signals in different compartments.This process relies heavily on the use of reference values for: longitudinal relaxation time T1 of each metabolite; transverse relaxation time T2 of each metabolite; longitudinal and transverse relaxation times of water in gray matter (GM), white matter (WM) and cerebrospinal fluid (CSF); and the MR-visible water fraction in each tissue compartment.Current quantification practice often proceeds by assuming constant relaxation behavior across the brain (beyond the coarse WM/GM/CSF distinction)2–5 and lifespan6. However, it is well established that water relaxation changes with healthy aging, e.g. Knight et al.7 reported age-related water T1 and T2 changes in a cohort of 37 healthy volunteers between 49 and 87 years old, particularly T1 declines with age in the cingulate cortex and T2 increases in WM. Decreases in metabolite T2 have also been observed in prefrontal, posterior cingulate and occipital cortices8, exacerbating the impact of ignoring age.
The purpose of this abstract is to describe a water relaxometry aging atlas dataset that has been acquired to allow more appropriate selection of reference values for MRS quantification at 3T. Modern analysis pipelines routinely co-register MRS acquisition volumes to structural (usually T1-weighted) MRI. Segmentation of structural images often involves co-registration to standard space, allowing for quantification methods that take into account the acquisition location and key subject demographic information, such as age.
Method
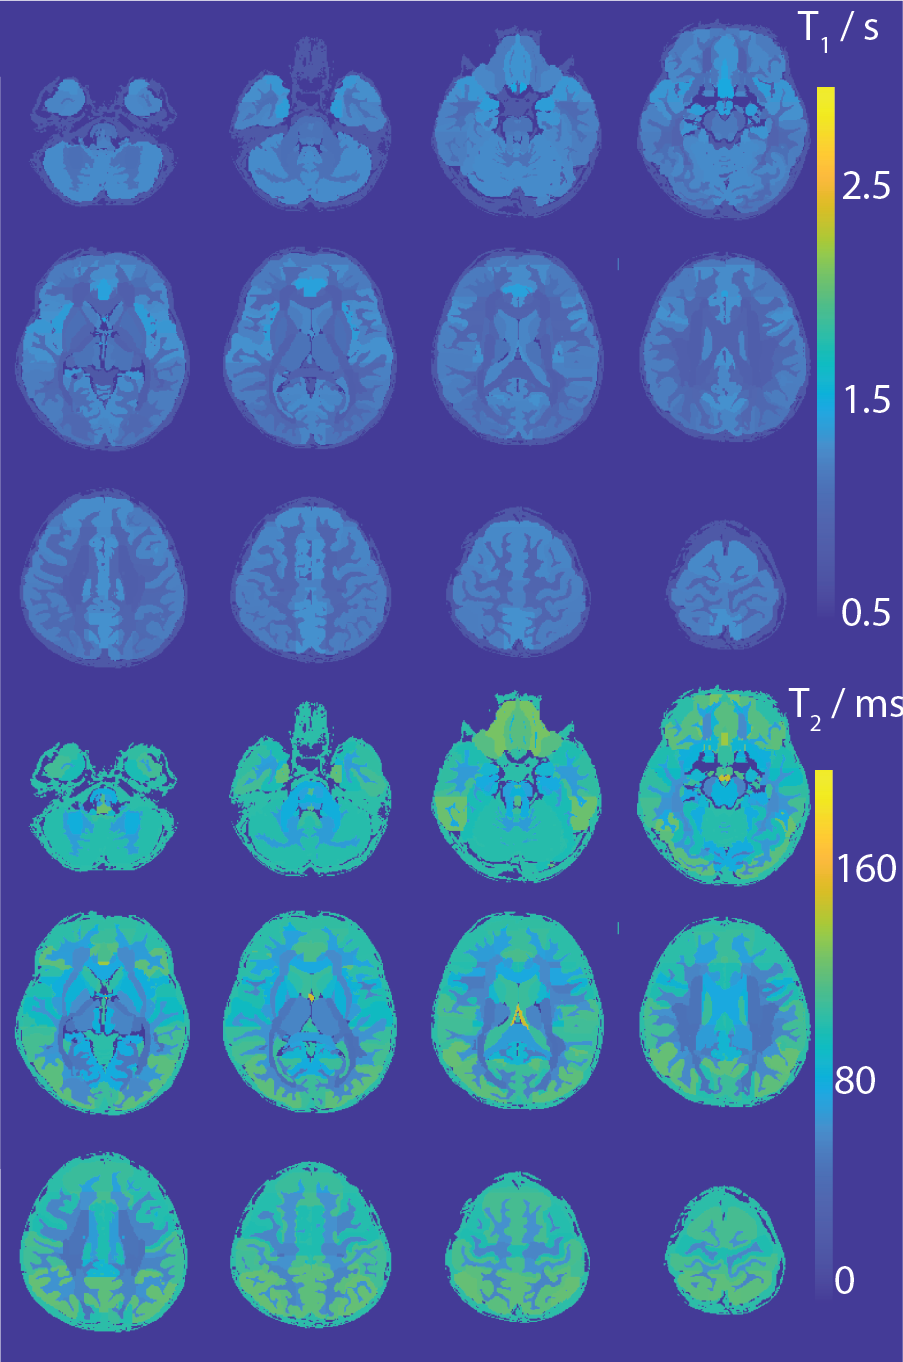
Fifty-two volunteers were recruited with Johns Hopkins IRB approval. The cohort was structured to include approximately five male and five female participants in each decade: 20s; 30s; 40s; 50s; and 60s.The 3T MRI protocol began with a T1-weighted MPRAGE scan (TR/TE 3.7/8.1 ms; FA 8° ) with 1-mm3 isotropic resolution for tissue segmentation. DESPOT (driven-equilibrium single-pulse observation of T1/T2) was used for rapid whole-brain measurement of T1 and T2. T1 is measured from a series of spoiled gradient-recalled echo images acquired at flip angles of 4°,12° and 18°. This T1 information is combined with refocused steady-state free precession (FA 15°,30°, and 60°) images at two phases cycling patterns (0°, 180°) to determine T2. T1 and T2 maps were registered to JHUatlas (i.e. JHU MNI-SS/EVE9) by computing an affine and LDDMM10–12 transformation (shown in Figure 1), resulting in the subject-space atlas of each participant. The mean values of T1 and T2 were calculated in each of 130 parcels (combining symmetrical left and right regions as one parcel and all CSF regions as one parcel) and correlations with age were analyzed.Results
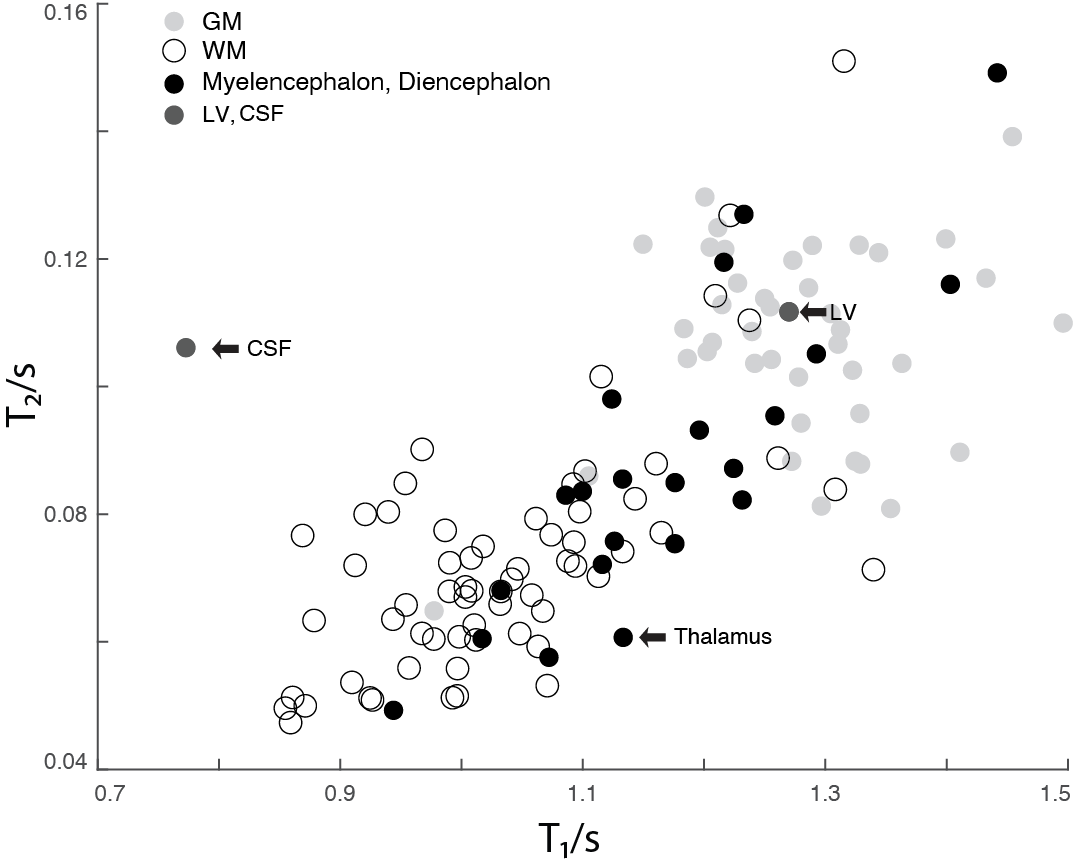
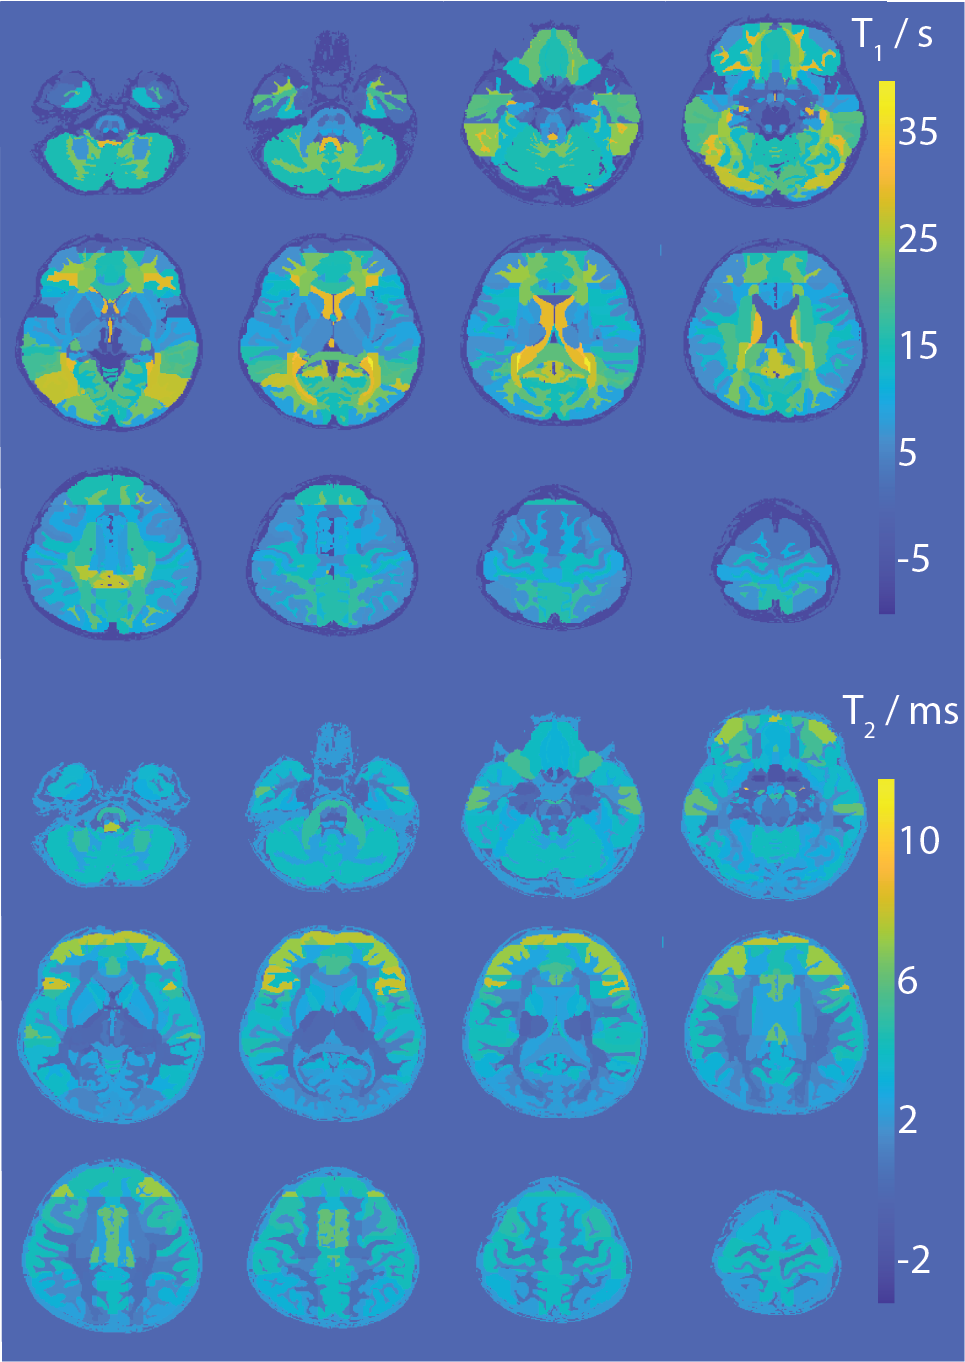
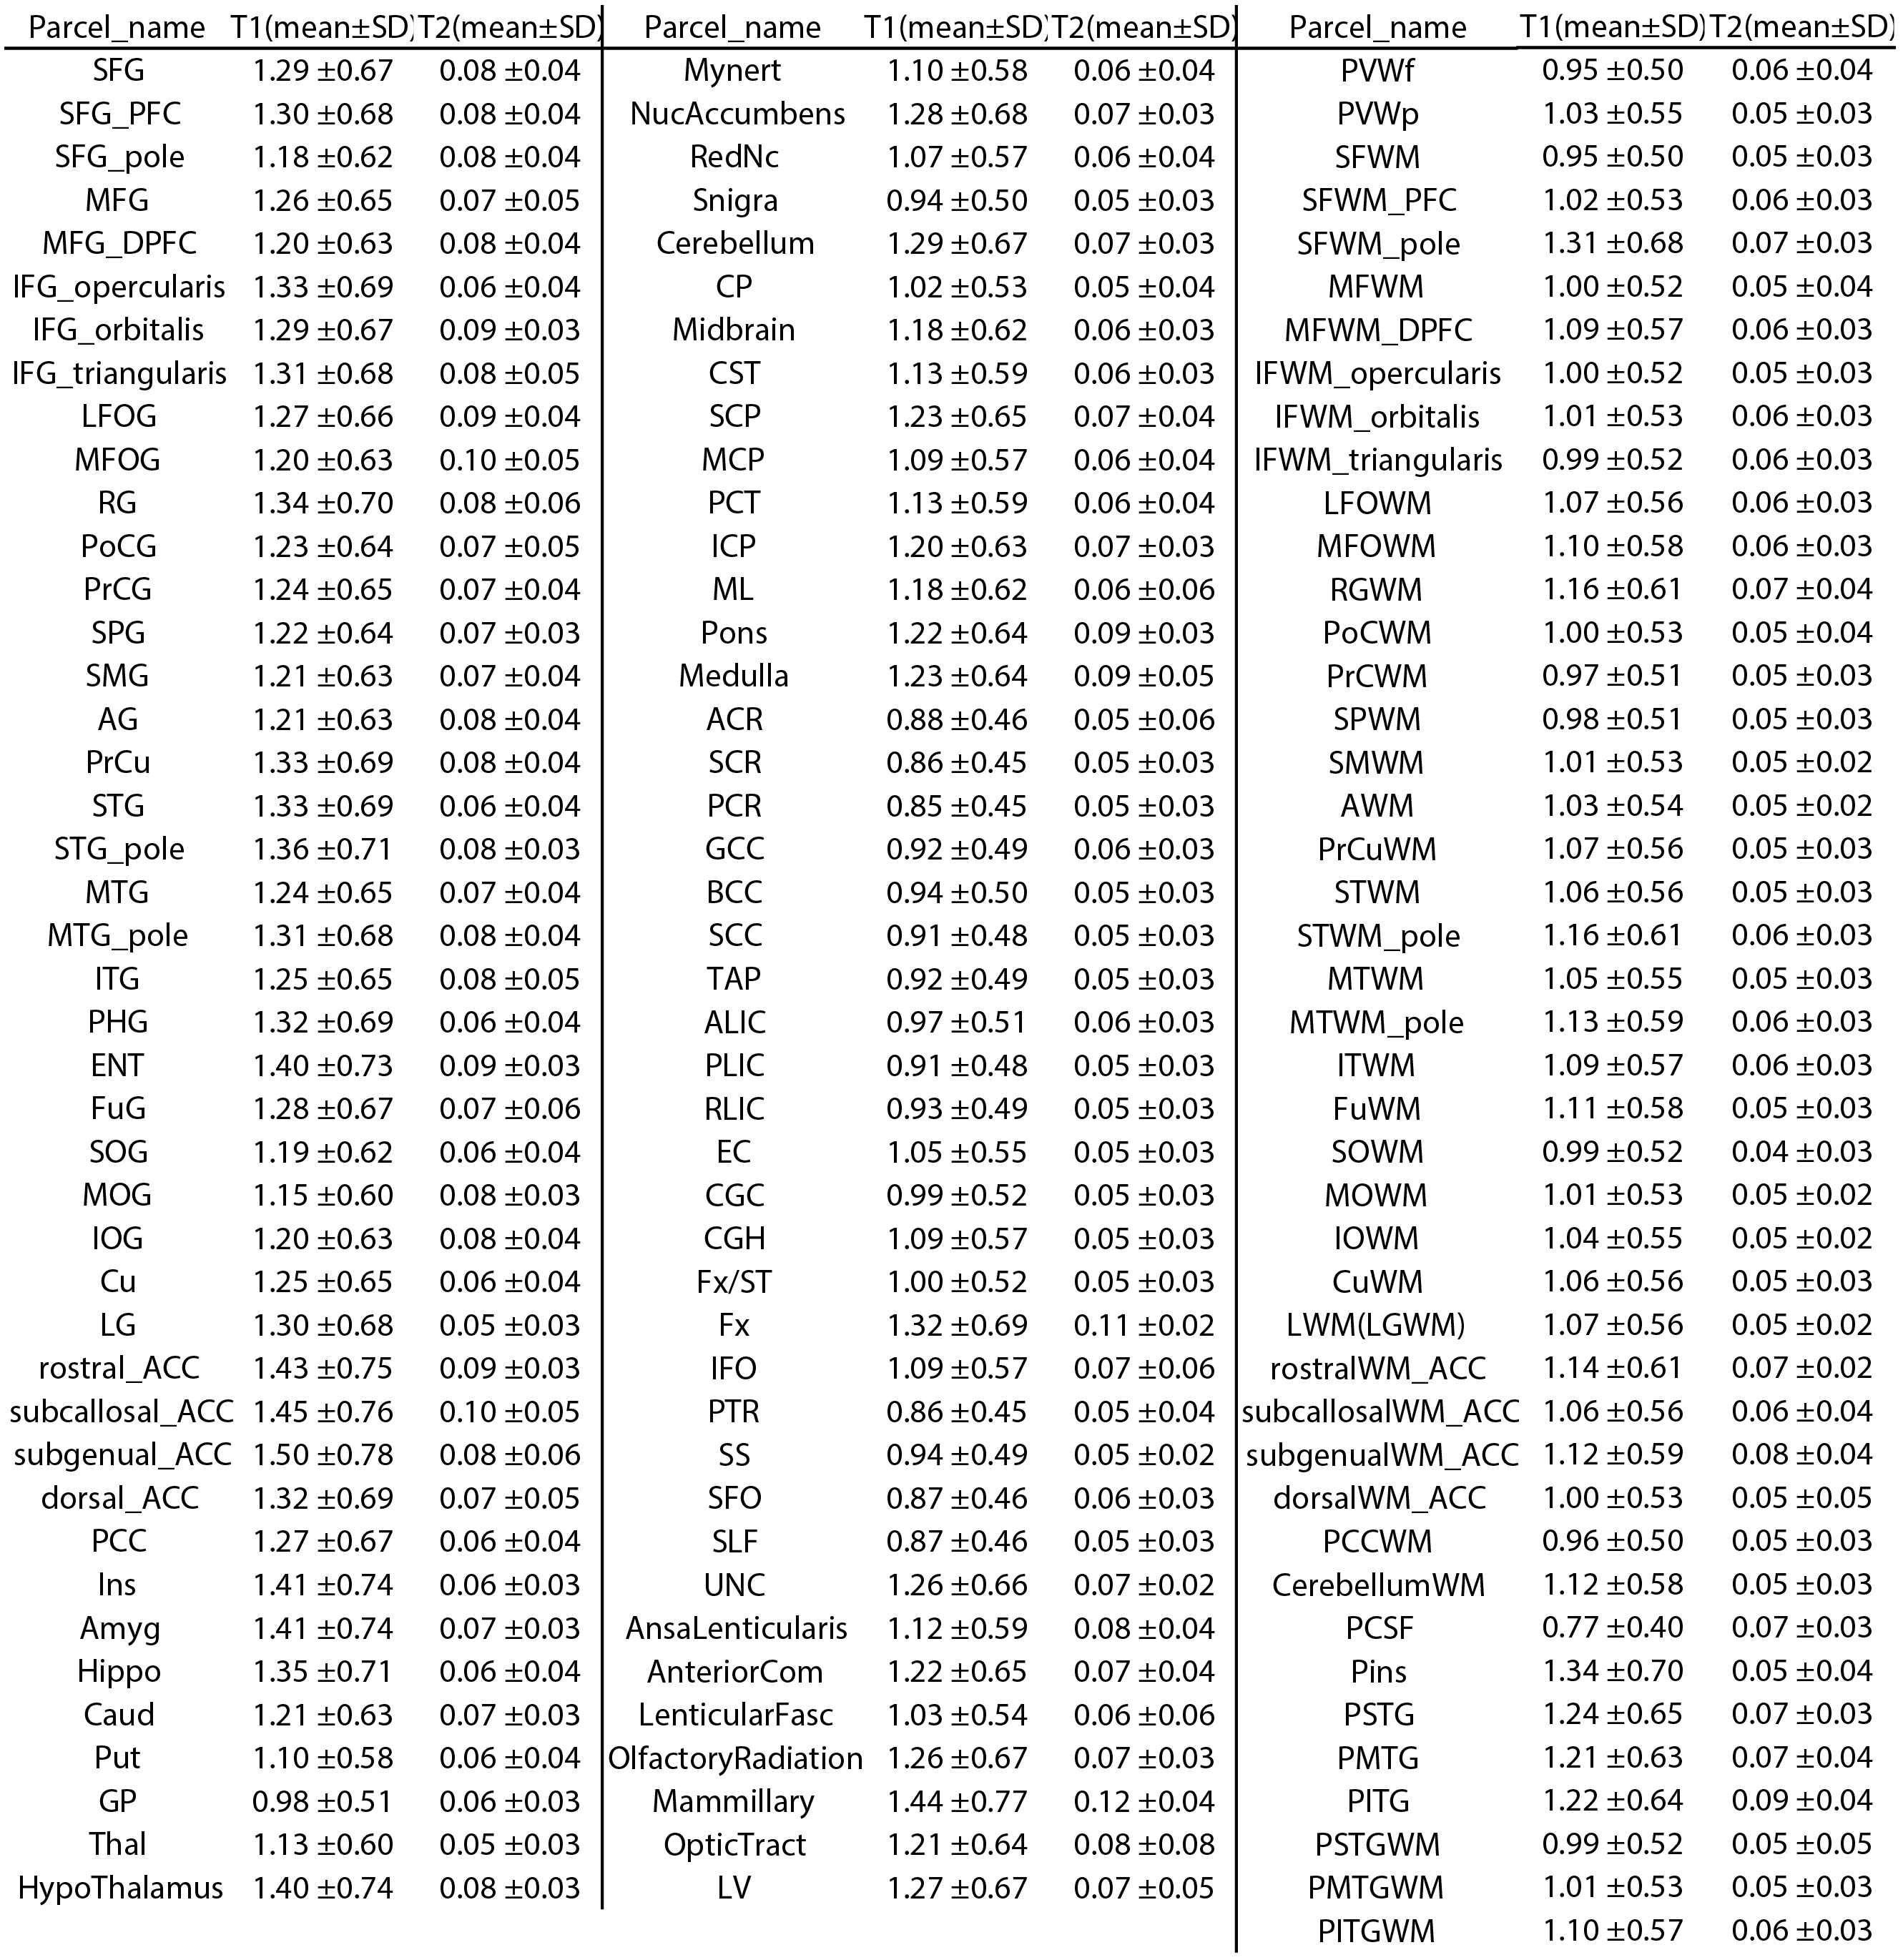
All participants were scanned, and data from eleven (4M, 7F) participants were excluded during quality control. Parcel mean values are shown in the atlas as Figure 2, and listed in Table 1. The correlation between T1 and T2 across parcels is shown in Figure 3. Correlation analysis indicated a significant positive correlation between T1 and age in most frontal, posterior and inferior WM parcels, and a significant positive correlation between T2 and age in most cortical GM parcels, and in frontal and limbic WM. The slope of relaxation-age correlations is shown in the atlas as Figure 4.Discussion
We have developed a water relaxation aging atlas based on 41 participants’ data, showing important regional, and tissue differences in both the mean and age-related changes in water relaxation behavior. This atlas can be integrated into MRS analysis workflow to allow for region- and subject-appropriate reference values to be selected. This should reduce the quantification biases associated with water-referenced tissue correction, which is necessary because 3T MRS measurements are usually acquired with parameters that result in substantial T1- and T2-weighting. Gross trends align with previous studies13–15: T1 was prolonged with age in frontal, posterior and inferior WM parcels, while T2 increased with age in most of cortex GM and frontal WM, and limbic WM.Conclusion
A water relaxometry atlas has been developed, allowing parcel-wise assessment of age-related changes in the brain water relaxation times.Acknowledgements
P41 EB031771; R01 EB016089; R01 023963; R01 EB032788; R00 AG062230; K99 AG080084References
1. Gasparovic C, Neeb H, Feis D l., et al. Quantitative spectroscopic imaging with in situ measurements of tissue water T1, T2, and density. Magn Reson Med. 2009;62(3):583-590. doi:10.1002/mrm.22060
2. Ernst T, Kreis R, Ross BD. Absolute Quantitation of Water and Metabolites in the Human Brain. I. Compartments and Water. J Magn Reson B. 1993;102(1):1-8. doi:10.1006/jmrb.1993.1055
3. Wansapura JP, Holland SK, Dunn RS, Ball WS. NMR relaxation times in the human brain at 3.0 tesla. J Magn Reson Imaging JMRI. 1999;9(4):531-538. doi:10.1002/(sici)1522-2586(199904)9:4<531::aid-jmri4>3.0.co;2-l
4. Mullins PG, McGonigle DJ, O’Gorman RL, et al. Current practice in the use of MEGA-PRESS spectroscopy for the detection of GABA. NeuroImage. 2014;86:43-52. doi:10.1016/j.neuroimage.2012.12.004
5. Harris AD, Puts NAJ, Edden RAE. Tissue correction for GABA-edited MRS: considerations of voxel composition, tissue segmentation and tissue relaxations. J Magn Reson Imaging JMRI. 2015;42(5):1431-1440. doi:10.1002/jmri.24903
6. Gong T, Hui SCN, Zöllner HJ, et al. Neurometabolic timecourse of healthy aging. NeuroImage. 2022;264:119740. doi:10.1016/j.neuroimage.2022.119740
7. Knight MJ, McCann B, Tsivos D, Couthard E, Kauppinen RA. Quantitative T1 and T2 MRI signal characteristics in the human brain: different patterns of MR contrasts in normal ageing. Magma N Y N. 2016;29(6):833-842. doi:10.1007/s10334-016-0573-0
8. Deelchand DK, McCarten JR, Hemmy LS, Auerbach EJ, Eberly LE, Marjańska M. Changes in the intracellular microenvironment in the aging human brain. Neurobiol Aging. 2020;95:168-175. doi:10.1016/j.neurobiolaging.2020.07.017
9. Oishi K, Faria A, Jiang H, et al. Atlas-based whole brain white matter analysis using large deformation diffeomorphic metric mapping: Application to normal elderly and Alzheimer’s disease participants. NeuroImage. 2009;46(2):486-499.
10.Beg MF, Miller MI, Trouvé A, Younes L. Computing Large Deformation Metric Mappings via Geodesic Flows of Diffeomorphisms. Int J Comput Vis. 2005;61(2):139-157. doi:10.1023/B:VISI.0000043755.93987.aa
11. Ceritoglu C, Tang X, Chow M, et al. Computational analysis of LDDMM for brain mapping. Front Neurosci. 2013;7. Accessed November 7, 2023. https://www.frontiersin.org/articles/10.3389/fnins.2013.00151
12. Mori S, Wu D, Ceritoglu C, et al. MRICloud: Delivering High-Throughput MRI Neuroinformatics as Cloud-Based Software as a Service. Comput Sci Eng. 2016;18(5):21-35. doi:10.1109/MCSE.2016.93
13. AKTAŞ DİNÇER H, AĞILDERE AM, GÖKÇAY D. T1 relaxation time is prolonged in healthy aging: a whole brain study. Turk J Med Sci. 53(3):675-684. doi:10.55730/1300-0144.5630
14. Hagiwara A, Fujimoto K, Kamagata K, et al. Age-Related Changes in Relaxation Times, Proton Density, Myelin, and Tissue Volumes in Adult Brain Analyzed by 2-Dimensional Quantitative Synthetic Magnetic Resonance Imaging. Invest Radiol. 2021;56(3):163-172. doi:10.1097/RLI.0000000000000720
15. Ndengera M, Delattre BMA, Scheffler M, Lövblad KO, Meling TR, Vargas MI. Relaxation time of brain tissue in the elderly assessed by synthetic MRI. Brain Behav. 2022;12(1):e2449. doi:10.1002/brb3.2449
Figures