4246
Mapping the Neural Dynamics of Light Sleep: EEG Microstates and fMRI Network Correlations in N1 and N2 Stages1Key Laboratory of Brain-Machine Intelligence for Information Behavior (Ministry of Education and Shanghai), School of Business and Management, Shanghai International Studies University, Shanghai, China, Shanghai, China, 2Center for MRI Research, Peking University, Beijing, China, Beijing, China
Synopsis
Keywords: fMRI Analysis, fMRI (resting state), fMRI (sleep)
Motivation: While the significance of light sleep in health is gradually acknowledged, yet the specific neural dynamics during this phase is unclear. Our research emphasizes EEG microstates as vital markers of light sleep's brain networks, crucial for therapeutic innovation.
Goal(s): We aimed to delineate the relationship between EEG microstates and corresponding fMRI networks during N1 and N2 sleep stages.
Approach: We combined EEG-fMRI with custom regressors and GLM analysis, alongside Group-ICA, to model BOLD responses linked to EEG microstates.
Results: Microstate D showed significantly lower activity across parameters in both sleep stages, with BOLD patterns revealing unique neural correlations for each microstate.
Impact: This study sheds light on sleep's neural intricacies via fMRI, linking EEG microstates to brain networks, with implications for sleep disorder diagnosis, treatment, and overall sleep quality improvement.
Background
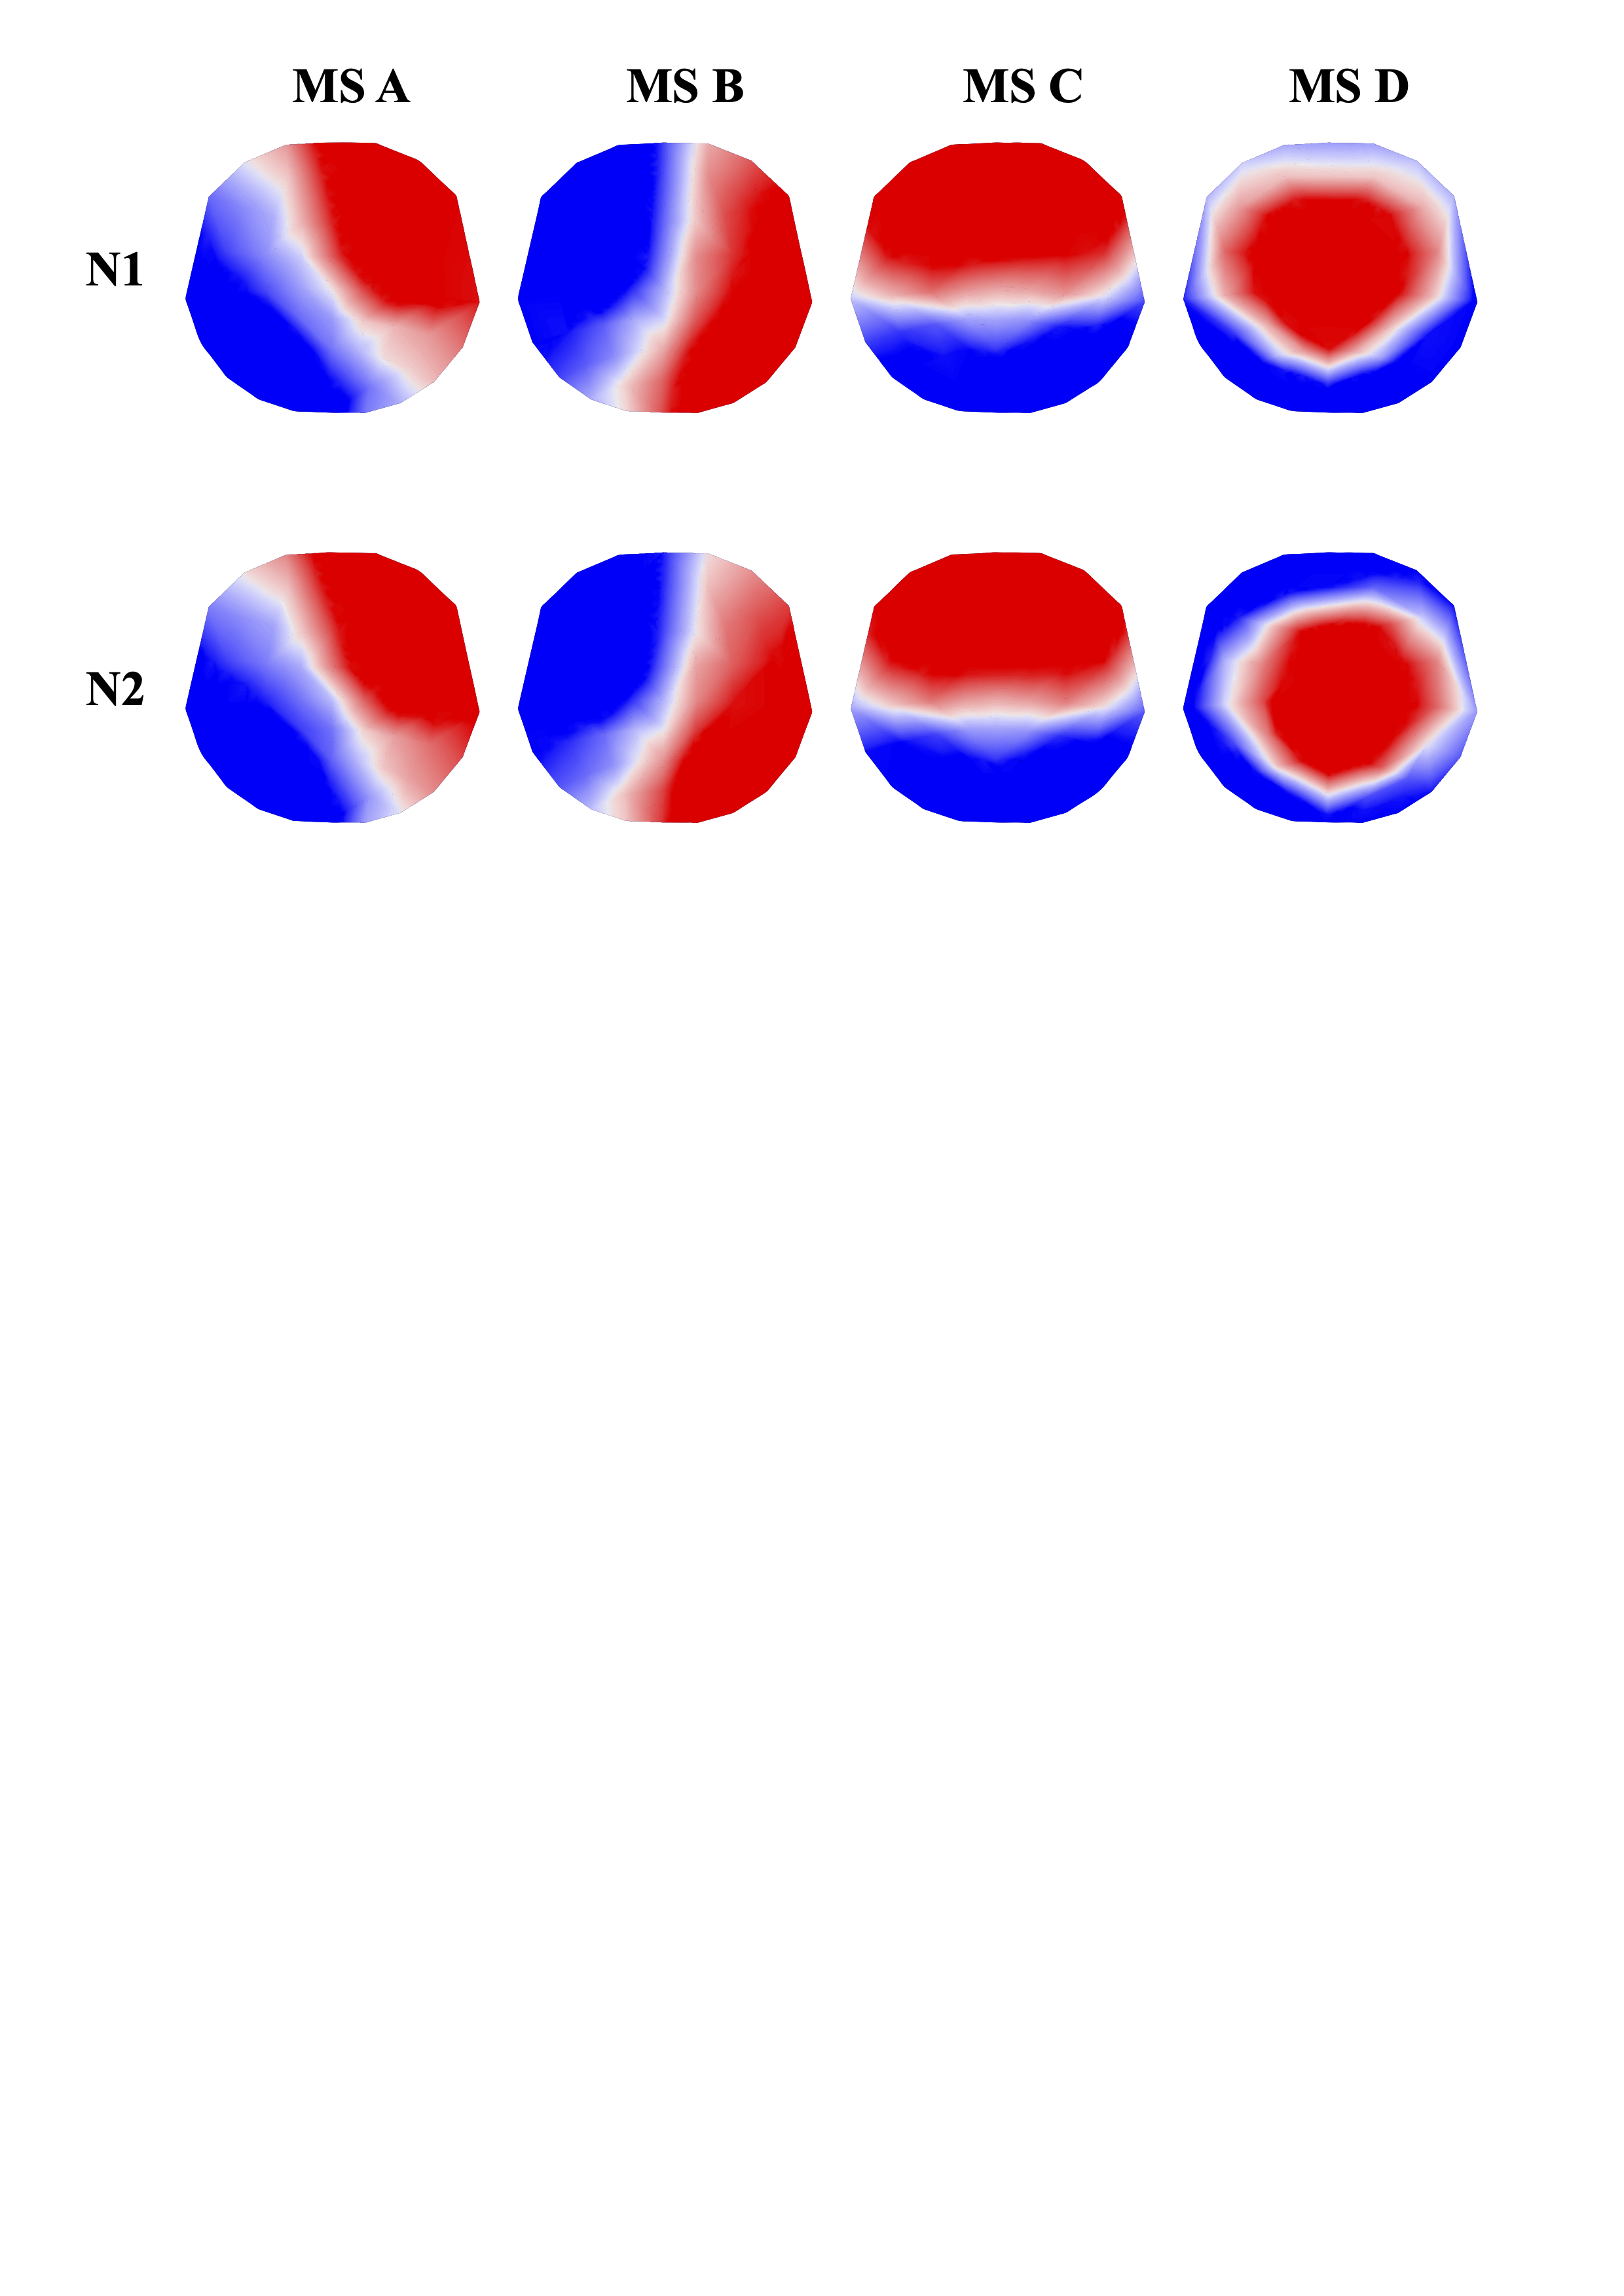
Light sleep, a pivotal element of human sleep architecture, is crucial for cognitive function and physical health, facilitating memory consolidation and serving as a gateway to deeper sleep stages necessary for recovery (Davies et al., 2019; Newman, 2001; Picchioni et al., 2023). Light sleep includes the non-rapid eye movement stages N1 and N2, with N1 characterized by slow eye movements and serving as the transitional phase from wakefulness to sleep, and N2 representing the initial substantial stage of sleep, occupying the majority of the sleep cycle. EEG microstates, brief quasi-stable periods of electric field topography, offer unique perspectives into these dynamic brain functions. In previous research, four consistent microstate maps (A-D), have been identified across wake and sleep stages (Brodbeck et al., 2012), and recent EEG-fMRI studies have linked these to resting-state networks (RSNs). However, their roles during N1 and N2 sleep stages are not fully understood.Results
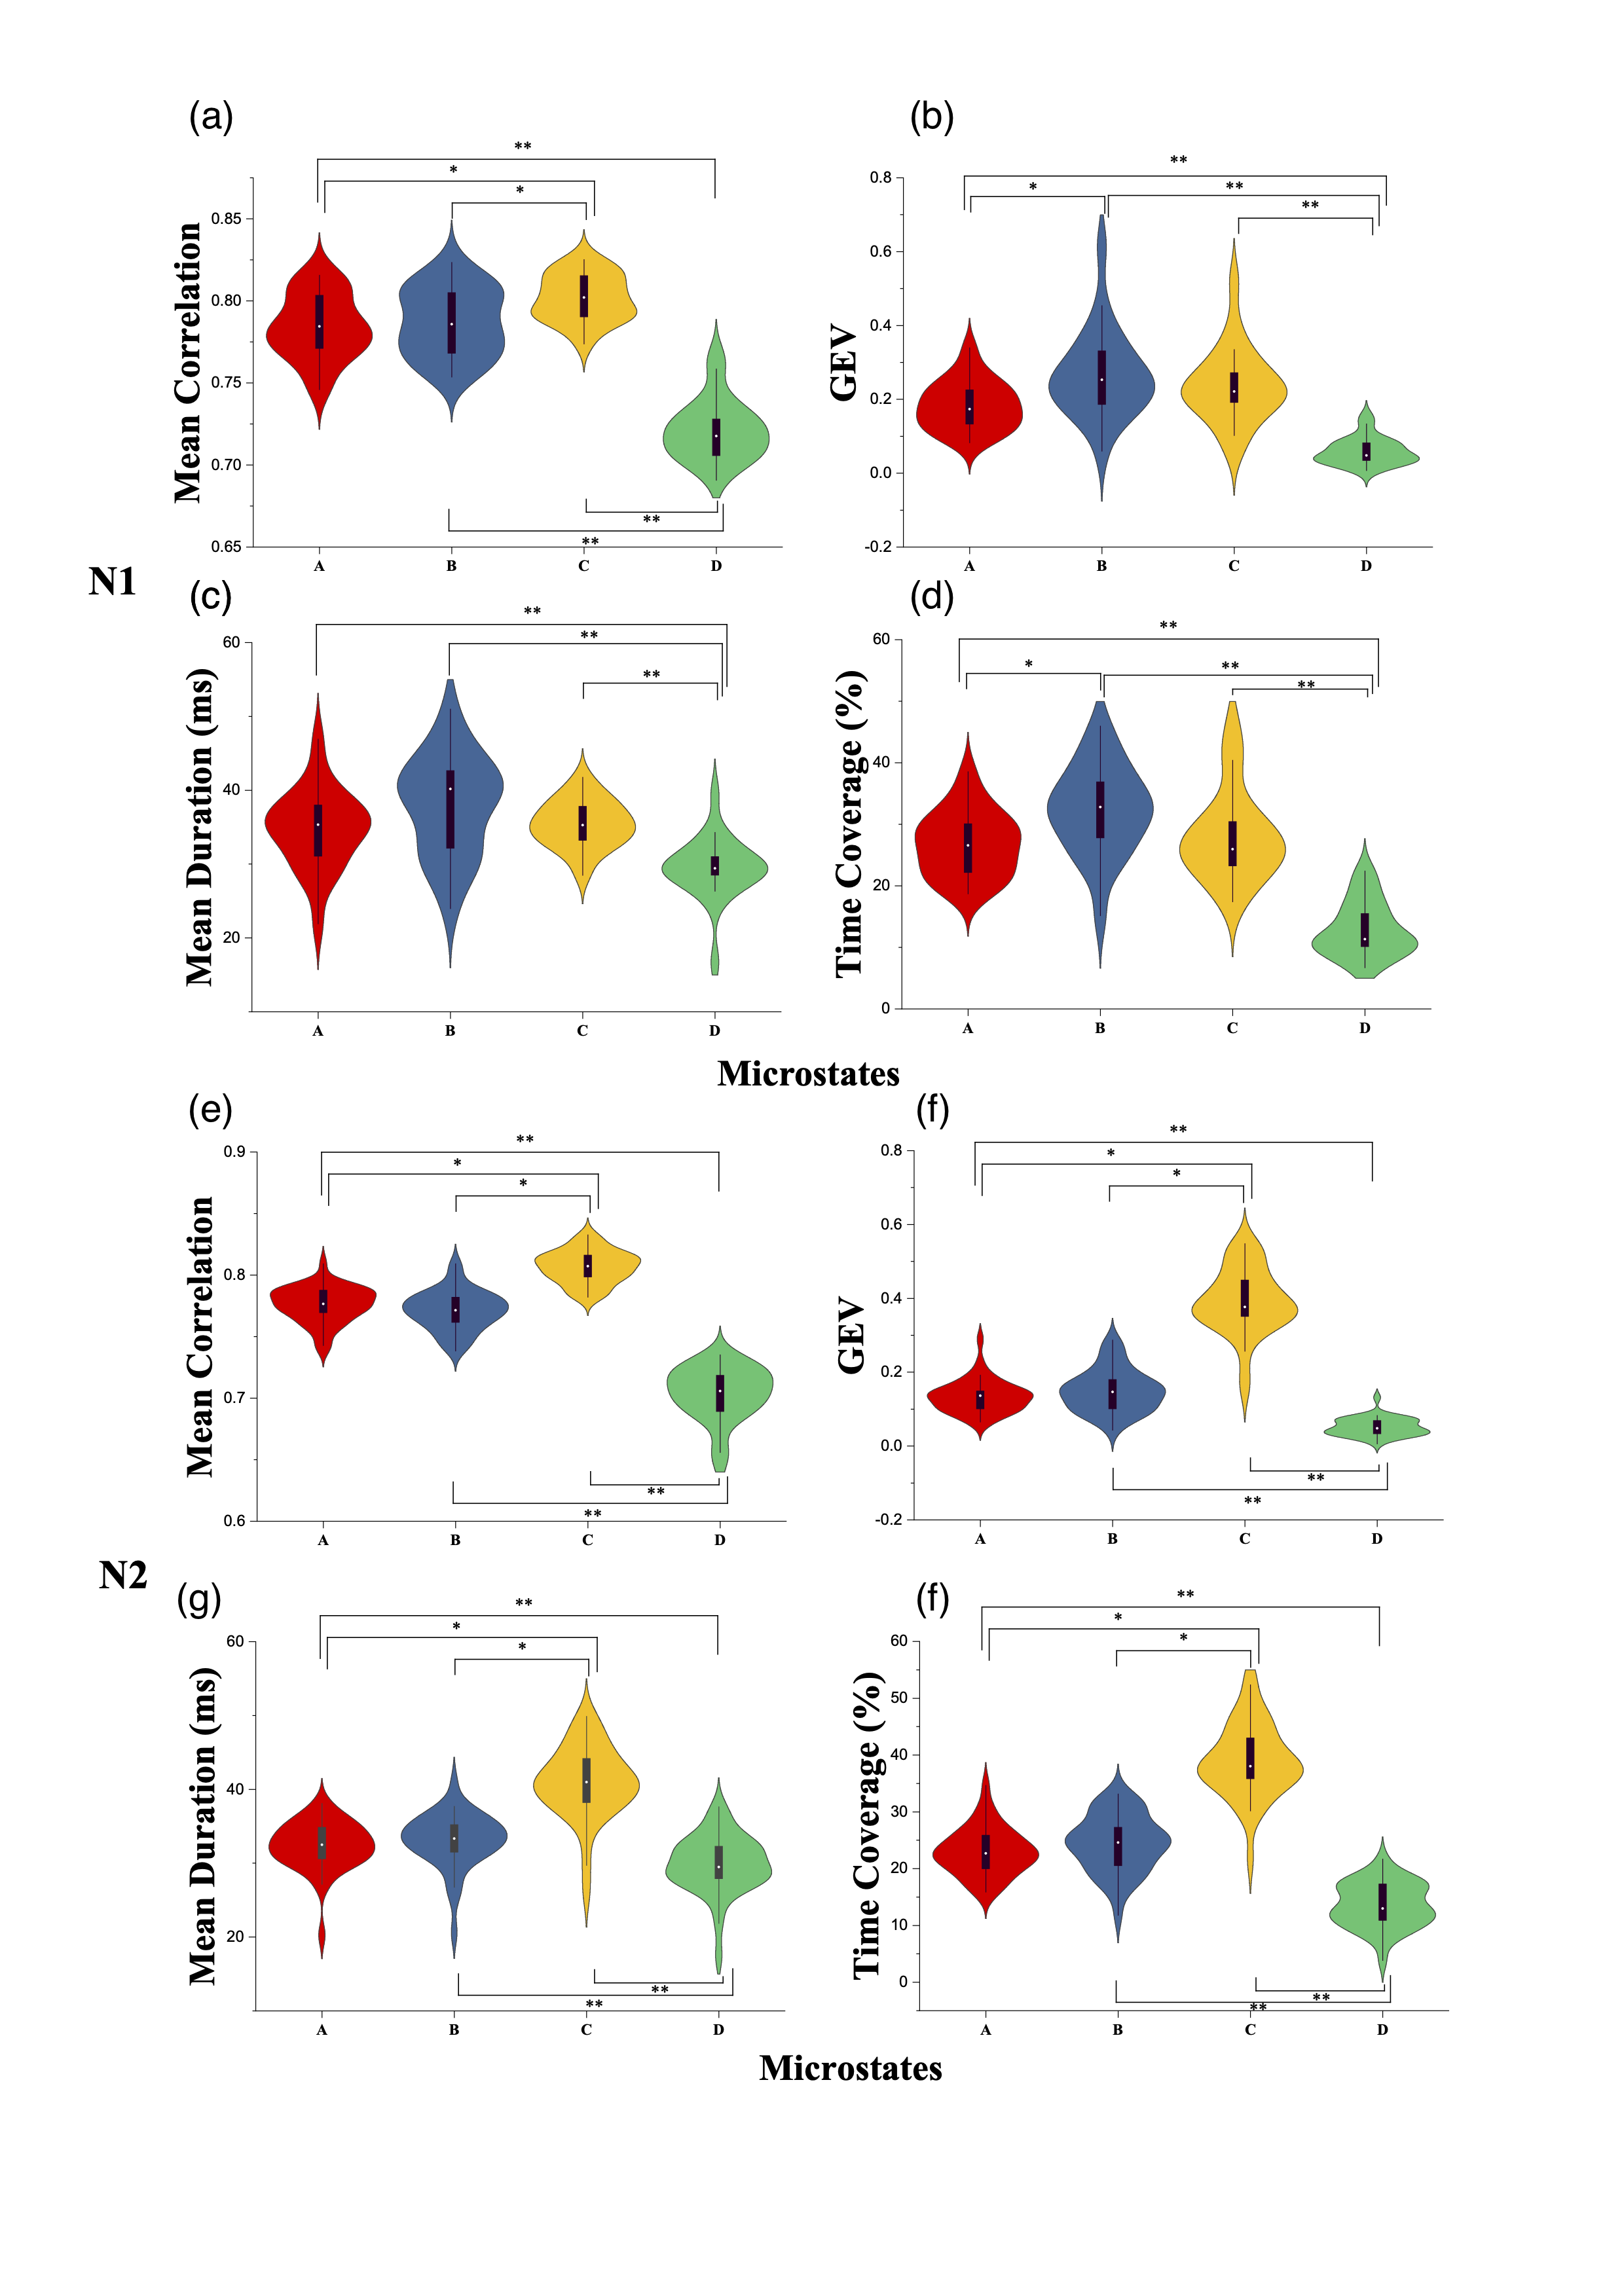
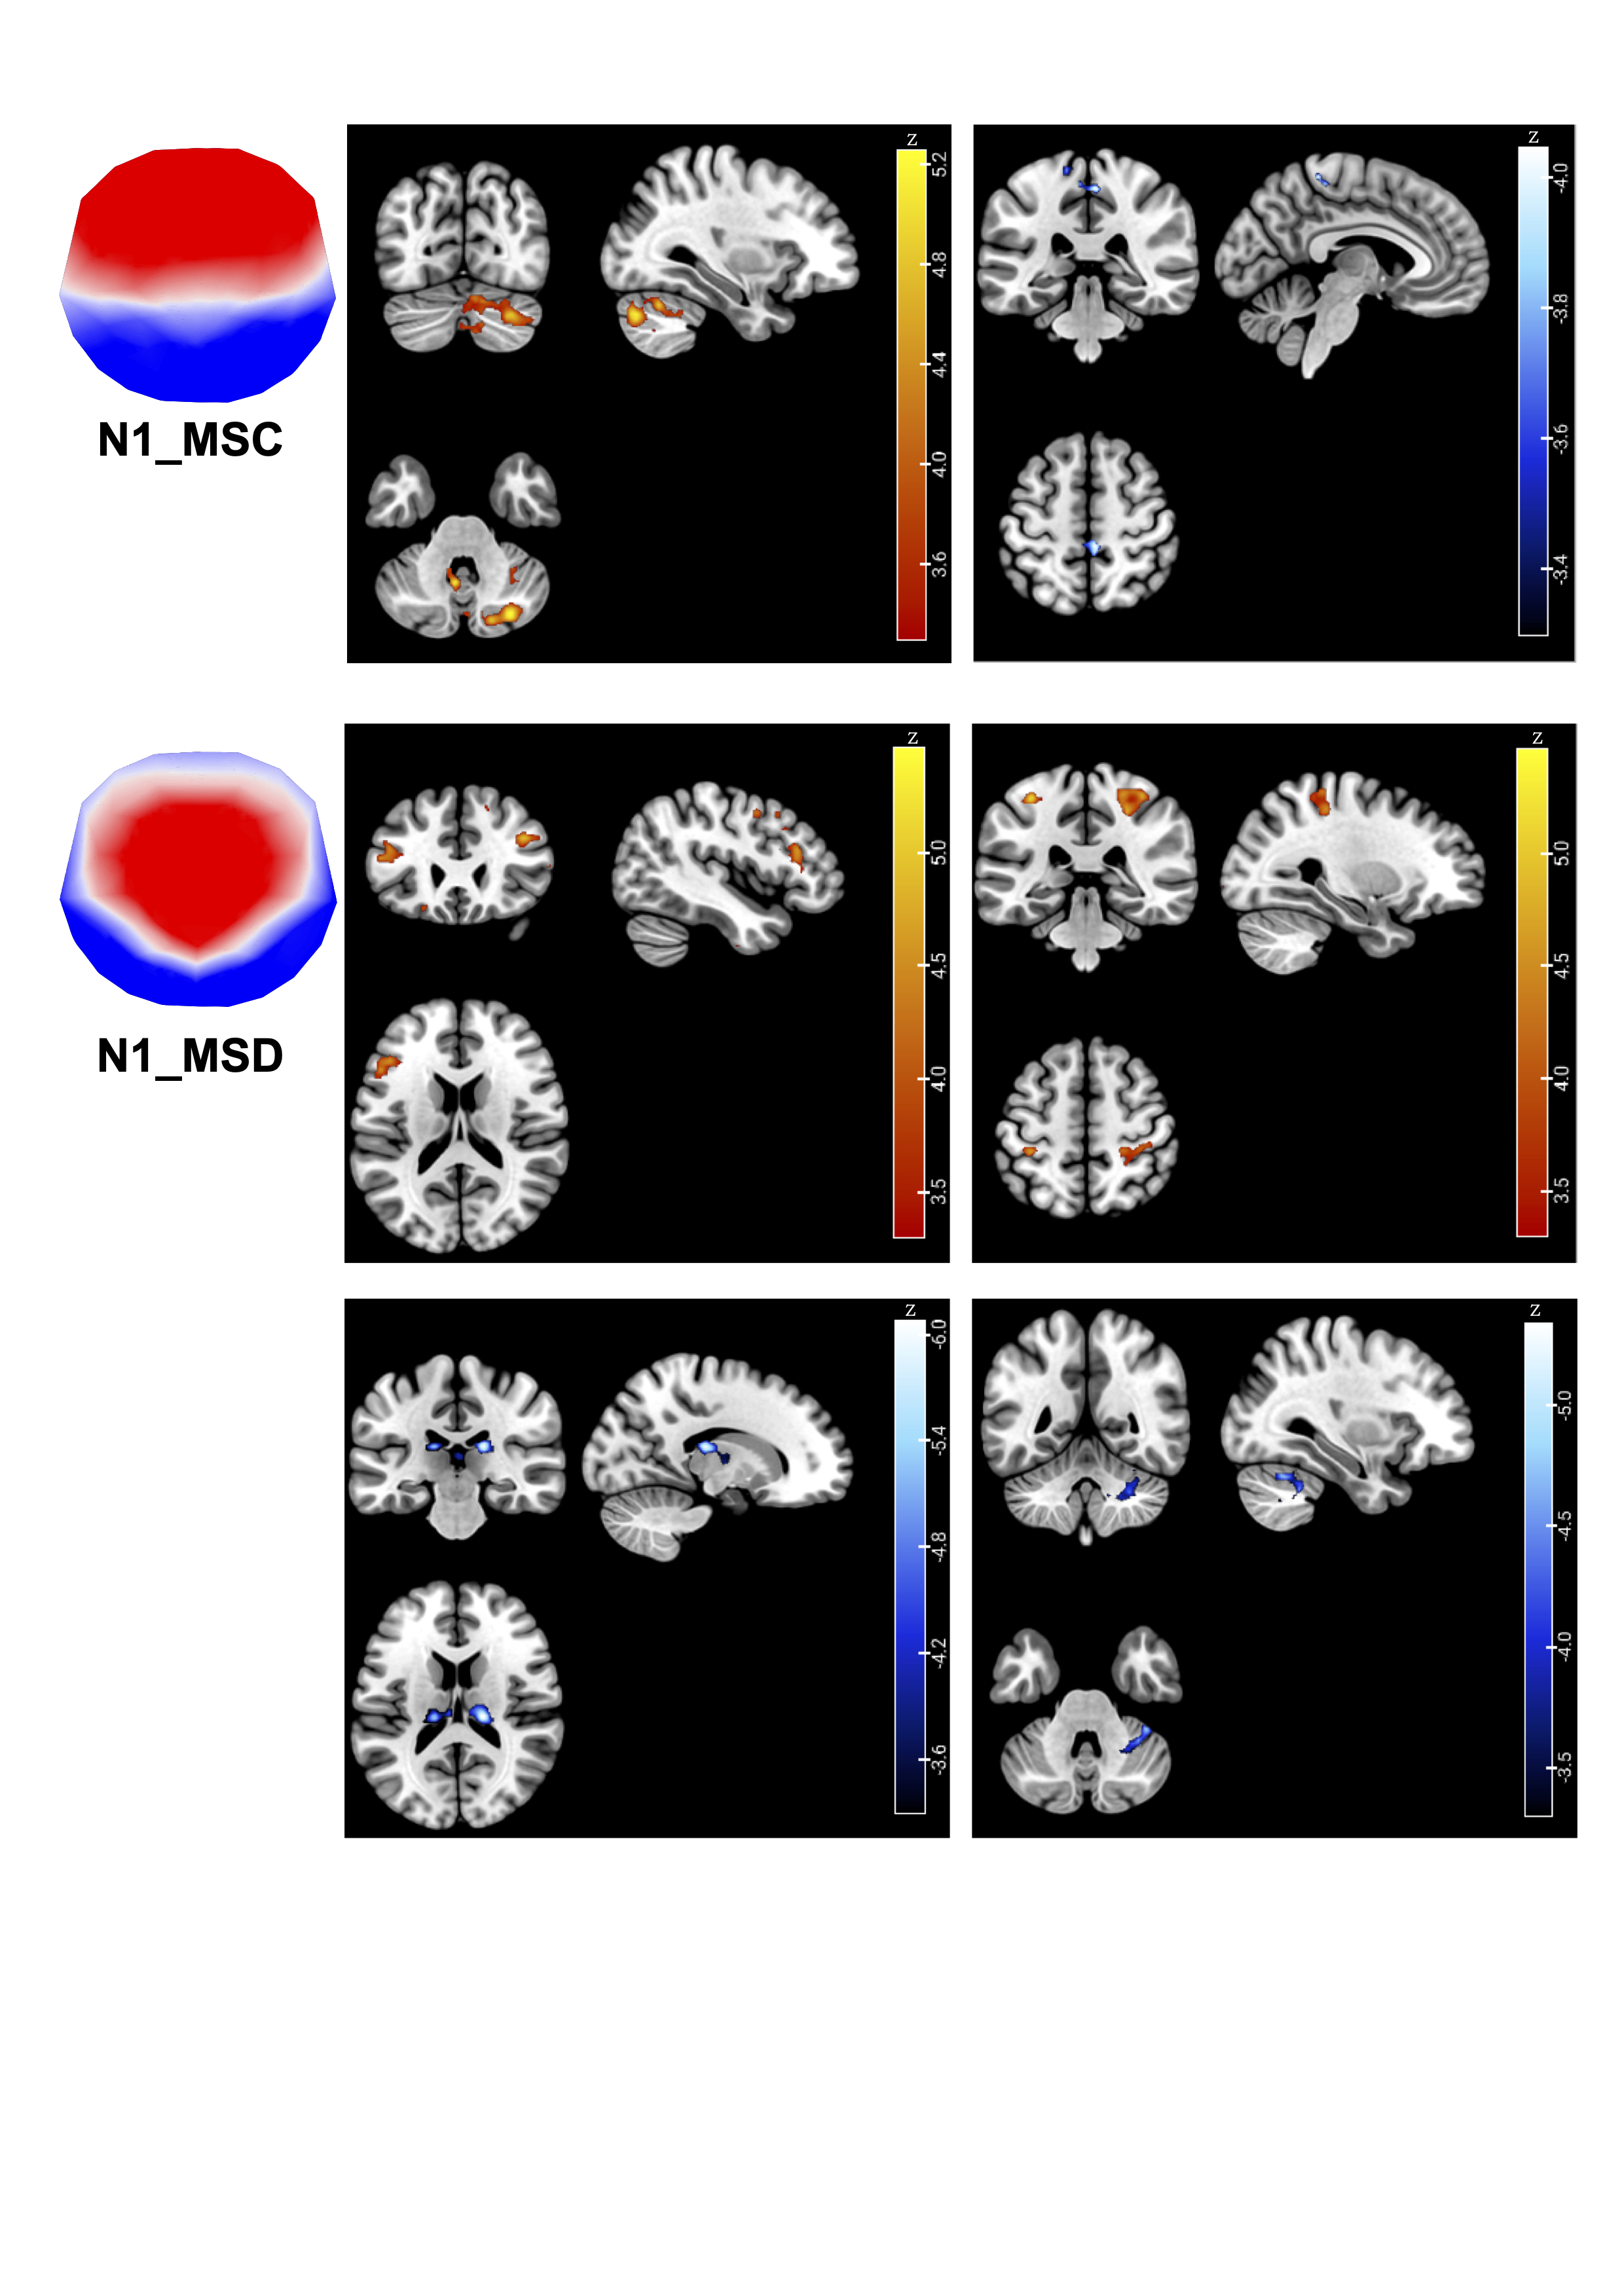
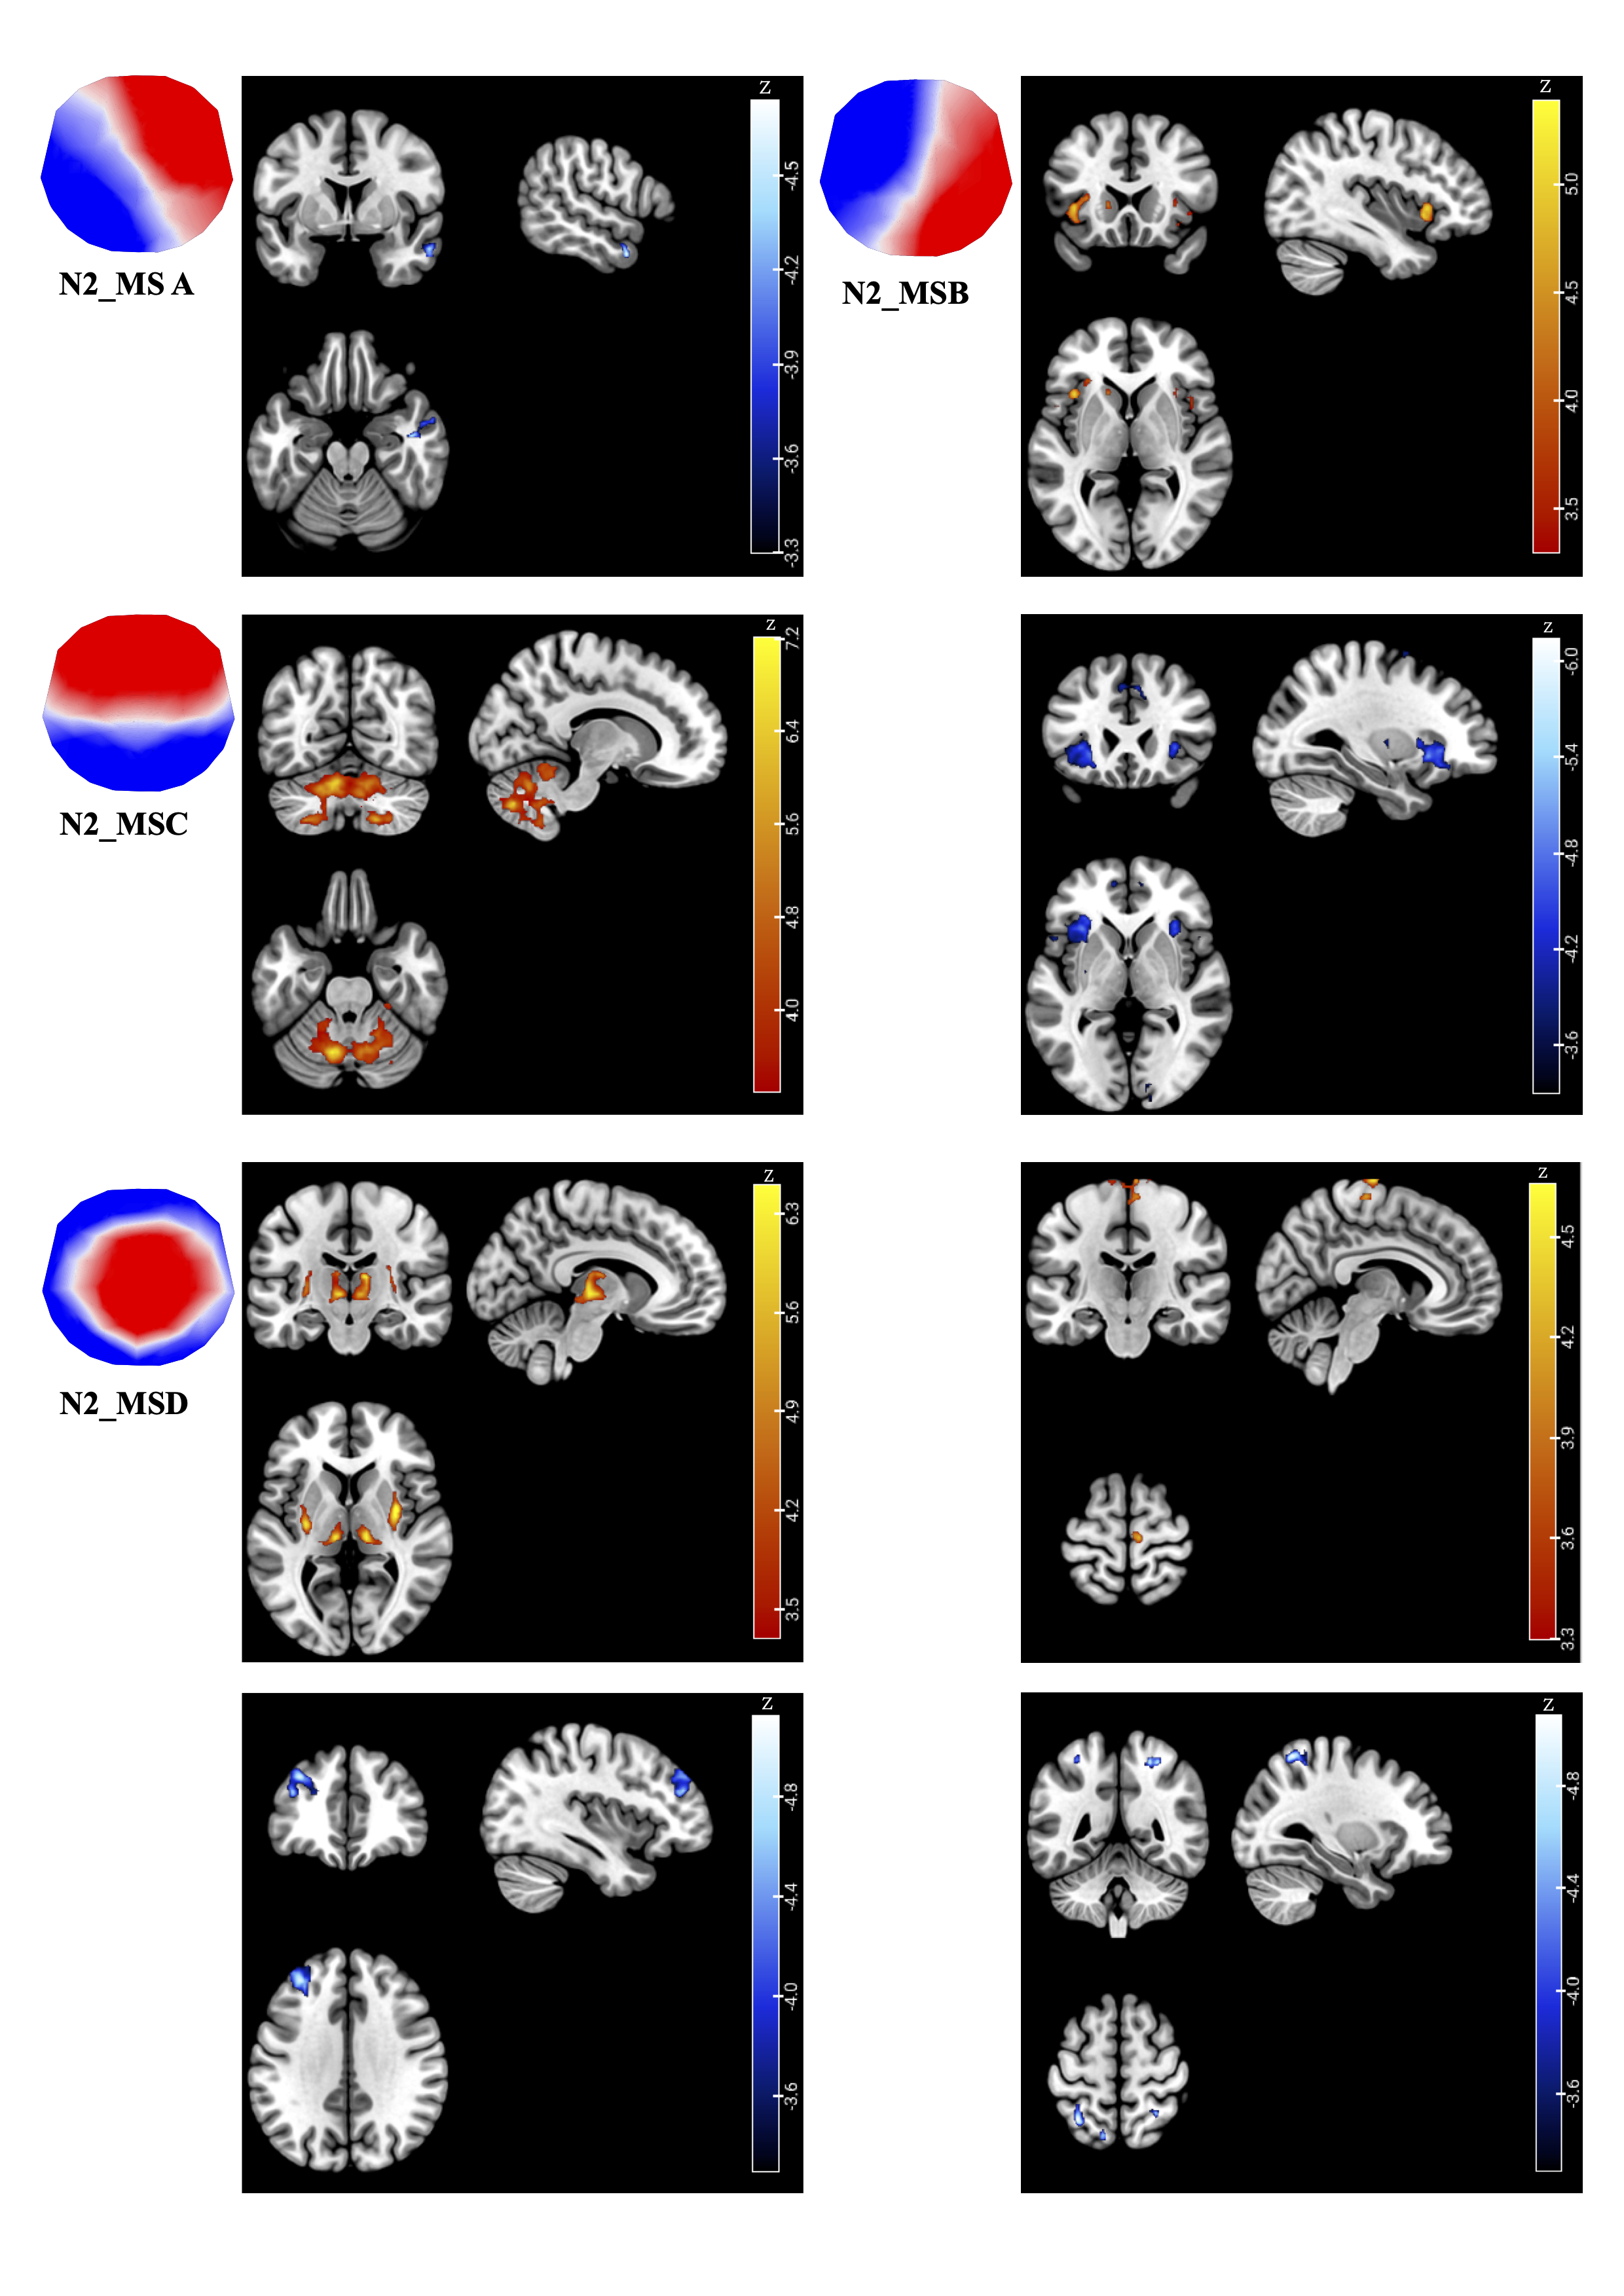
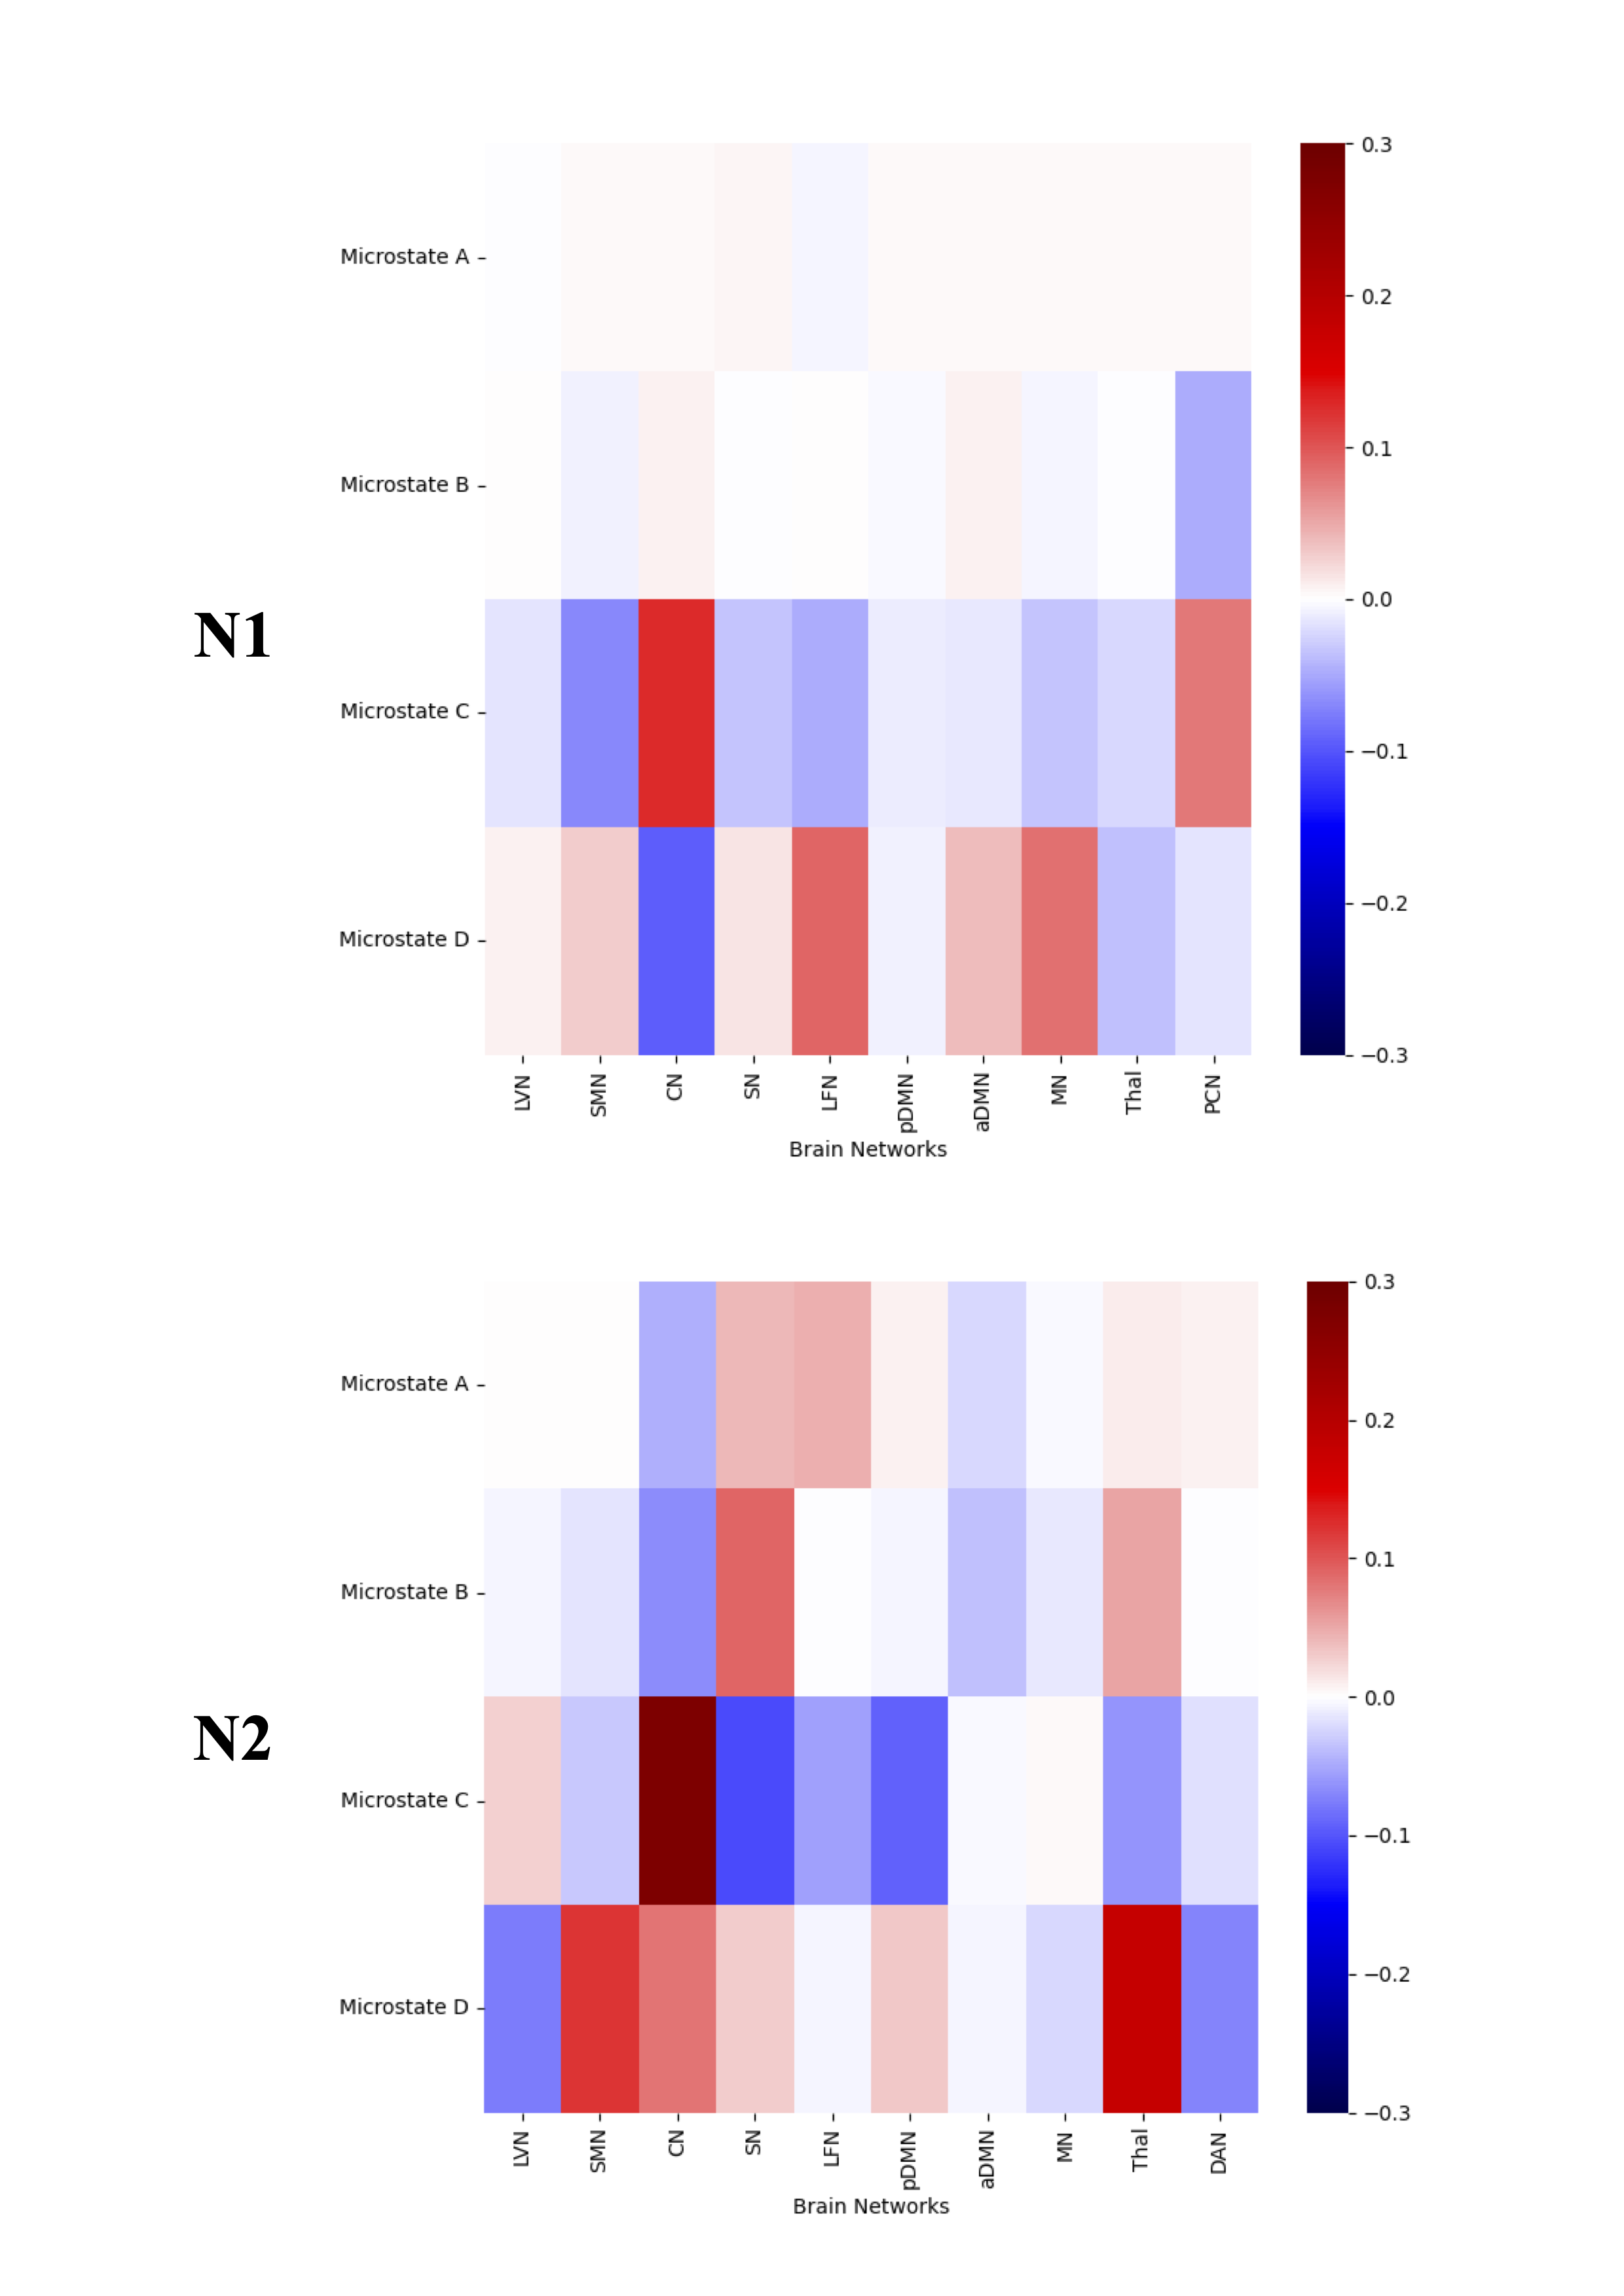
In this study, simultaneous EEG-fMRI data were acquired during the N1 and N2 stages to investigate the relationships between EEG microstates and fMRI networks. A one-way ANOVA conducted on the EEG microstates across N1 and N2 stages indicated significant differences (p < .01). Post hoc analysis showed that microstate D had significantly lower mean correlation, GEV, mean duration, and time coverage than other microstates in both stages.BOLD activation/deactivation patterns associated with EEG microstates revealed that during N1, microstate C positively correlated with the right cerebellum, and negatively with the primary motor cortex, while microstate D positively correlated with the bilateral frontal gyrus and right postcentral gyrus, and negatively correlated with the thalamus and cerebellum. During N2, microstate A correlated negatively with the middle temporal gyrus; Microstate B exhibited positive correlations with the bilateral anterior insula lobe; Microstate C was positively associated with the cerebellum, and negatively with the bilateral insula lobe; Microstate D positively corresponded with the thalamus and motor cortex, but negatively with the left frontal gyrus and bilateral superior parietal lobule. Group-level analysis revealed significant spatial correlations between the ten ICA component maps and four beta maps: during N1, microstate C showed the strongest significant correlations with the cerebellar and supplementary motor networks; microstate D was highly correlated with the left frontoparietal, motor, and cerebellar networks. For N2, microstate B was positively correlated with the salience network, microstate C with the cerebellar network, and microstate D with the thalamus and supplementary motor network. In summary, our study highlights the relationships between EEG microstates and functional brain networks during N1 and N2 sleep stages, underscoring EEG microstates as key electrophysiological indicators of these networks during light sleep.
Acknowledgements
This work was supported by National Key Research and Development Program of China (2018YFC2000603 and 2017YFC0108900), National Natural Science Foundation of China (81871427, 81671765, 81430037, 81727808, 81790650, 81790651, 71671115, 71942003 and 31421003), Beijing Municipal Science and Technology Commission (Z181100001518005 and Z171100000117012), Guangdong Key Basic Research Grant (2018B030332001), Guangdong Pearl River Talents Plan Innovative and Entrepreneurial Team (2016ZT06S220), Program for Professor of Special Appointment (Eastern Scholar) at Shanghai Institutions of Higher Learning (GZ2019003). We thank National Center for Protein Sciences at Peking University in Beijing, China, for assistance with MRI data acquisition and data analyses.References
Brodbeck, V., Kuhn, A., von Wegner, F., Morzelewski, A., Tagliazucchi, E., Borisov, S., Michel, C. M., & Laufs, H. (2012). EEG microstates of wakefulness and NREM sleep. NeuroImage, 62(3), 2129–2139. https://doi.org/10.1016/j.neuroimage.2012.05.060Davies, H. J., Nakamura, T., & Mandic, D. P. (2019). A Transition Probability Based Classification Model for Enhanced N1 Sleep stage Identification During Automatic Sleep Stage Scoring. 2019 41st Annual International Conference of the IEEE Engineering in Medicine and Biology Society (EMBC), 3641–3644. https://doi.org/10.1109/EMBC.2019.8856710
Newman, A. B. (2001). Relation of Sleep-disordered Breathing to Cardiovascular Disease Risk Factors: The Sleep Heart Health Study. American Journal of Epidemiology, 154(1), 50–59. https://doi.org/10.1093/aje/154.1.50
Picchioni, D., Schmidt, K. C., Loutaev, I., Pavletic, A. J., Sheeler, C., Bishu, S., Balkin, T. J., & Smith, C. B. (2023). Increased rates of brain protein synthesis during [N1,N2] sleep: L-[1-11C]leucine PET studies in human subjects. Journal of Cerebral Blood Flow & Metabolism, 43(1), 59–71. https://doi.org/10.1177/0271678X221121873
Figures