4245
Interpretable Deep Learning Model for Age Prediction Using Human Brain Cortico-Hippocampal Functional Connectivity1School of Biomedical Engineering, The University of Sydney, Sydney, Australia, 2School of Psychology, The University of Sydney, Sydney, Australia, 3Brain and Mind Centre, The University of Sydney, Sydney, Australia, 4Sydney Imaging, The University of Sydney, Sydney, Australia
Synopsis
Keywords: Functional Connectivity, Aging
Motivation: Normal aging involves human brain changes. Recognizing healthy aging patterns can advance age care, help understand unhealthy aging, and guide interventions.
Goal(s): We aim to characterise age-related functional changes and explore how they can be predicted and interpreted.
Approach: Using deep learning, we predicted age with cortical functional connectivity of the whole, anterior, and posterior hippocampus. LayerCAM generates the whole brain saliency map.
Results: Models yielded a mean prediction error of 6.9 years. Personalised saliency maps revealed highly contributing regions to age prediction, such as the precuneus. Models also capture the prediction and saliency difference between anterior and posterior hippocampal-cortical functional connectivity.
Impact: We introduced an interpretable deep learning approach to explore age-related brain functional changes. Our work generates new knowledge that could lead to early detection and better management of aging-related disorders.
Introduction
Normal aging is accompanied by changes in human brain structure and function [1, 2]. Understanding age-related brain changes helps enhance age care and provides a baseline to understand the effects of unhealthy aging, guiding targeted intervention development. Among various brain circuits, the connectivity between the cortex and the hippocampus is known to be associated with age-related cognitive deterioration and dementia [3, 4]. In this study, we explored the possibility of age prediction with cortico-hippocampal functional connectivity (FC) and 3D convolutional neural networks (CNN). Nevertheless, the intricate workings of deep learning models often resemble black boxes, lacking interpretation. To address this, we propose a more transparent methodology to make our findings more accessible and understandable.Methods
We used minimally preprocessed [5] resting-state functional magnetic resonance imaging (rs-fMRI) data from the Human Connectome Project Aging dataset [6], including 720 subjects aged between 36 and 100. Following additional preprocessing, including spatial smoothing and temporal filtering, we measured seed-based FC using the entire hippocampus. To delve deeper, we divided the hippocampus into anterior and posterior sections. Based on these more focal seeds, we calculated two additional sets of FC. Subsequently, we predicted individuals’ ages using three 3D CNN models with the same architecture based on the whole, anterior, and posterior hippocampal cortical FC patterns, respectively. All models were trained and validated through a 5-fold cross-validation to minimize the mean absolute error (MAE). Layer Class Activation Mapping (LayerCAM) [7] was adapted to interpret the behaviour of these CNN models and find brain regions that are relevant to normal aging, by generating high-resolution individual saliency maps. We then performed one-way t-tests to assess differences between saliency maps for two models using anterior and posterior hippocampal cortical FC. Z-scores were converted from the false discovery rate (FDR) corrected p-values.Results
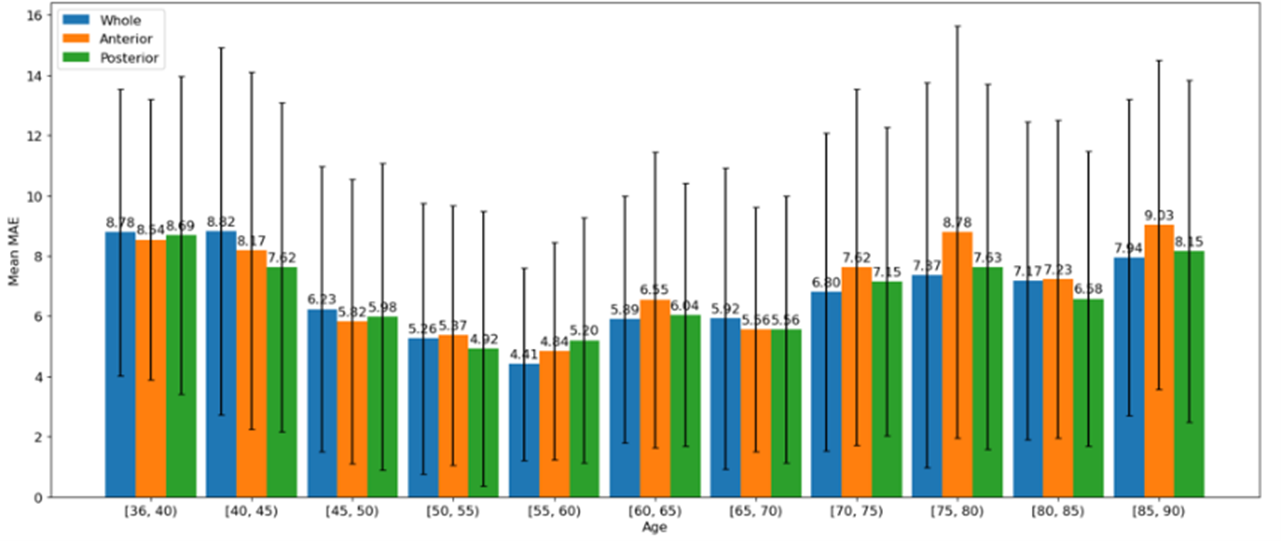
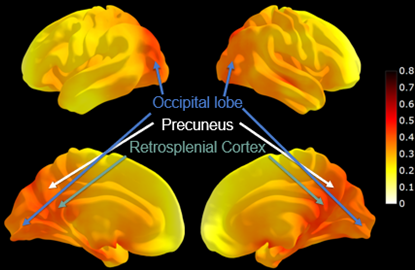
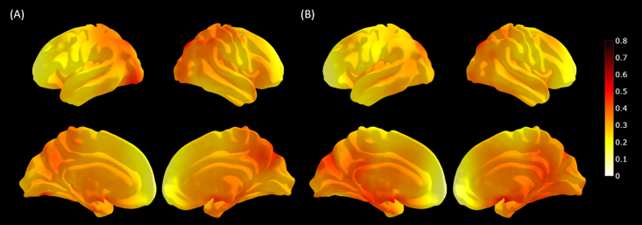
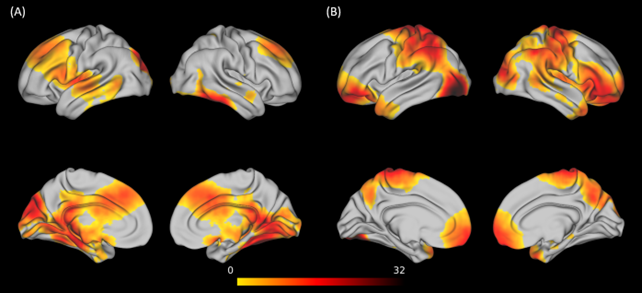
The CNN model achieved an overall age prediction MAE of around 6.9 years when using the whole hippocampal FC. The other two models based on the anterior or posterior hippocampal cortical FC achieved the MAE of approximately 7.1 and 6.8, respectively. Figure 1 shows models have similar performance across ages, with the most accurate prediction occurring for subjects aged 55 to 60, where the whole hippocampal cortical FC model achieved the lowest MAE at 4.4 years.Figure 2 illustrates the average saliency map generated from the whole hippocampal cortical FC based model, where the hotter (redder) regions have the higher contribution to the age prediction task. Mean saliency maps of the other two models using the anterior or posterior hippocampal cortical FC are displayed in Figure 3, showing differences between each other. These differences were visually illustrated by mapping z-scores to the brain surface, as displayed in Figure 4.
Discussion
While a similar recent study, focusing on a narrow age range (40-69), achieved the age prediction MAE of 4.8 years using the region-based FC with limited spatial resolution and CNN [8], our study used a wider age spectrum and seed-based whole-brain FC with finer spatial resolution. The averaged saliency map (Figure 2) indicates the FC between the whole hippocampus and precuneus, retrosplenial cortex and occipital lobe highly contributed to the prediction. As previously reported, precuneus is vulnerable to Alzheimer’s disease [9] and the hippocampal FC with retrosplenial cortex is associated with tau accumulation in the medial parietal region [10]. The occipital lobe was also stated to experience atrophy in healthy old adults [11].T-test results (Figure 4) reveal significant disparities in saliency maps generated from models based on anterior and posterior hippocampal FC. Specifically, FCs involving the lateral occipital cortex, precuneus, and medial prefrontal cortex with the anterior hippocampus were more influential on prediction compared to their connections with the posterior hippocampus. Conversely, the posterior hippocampal FC with cuneus had a more substantial impact on predicting age than the anterior hippocampus’s connectivity to the same region. Potential reasons for these differences could be differential aging effects and variability in functional roles between the anterior and posterior hippocampus. For instance, a previous study reported reduced FC between the posterior hippocampus and the medial prefrontal cortex [12].
Conclusion
In this study, we used CNN to predict age using cortico-hippocampal FC and employed LayerCAM to generate personalized saliency maps for model interpretation. Models can, to some extent, predict age, and regions that contributed the most to the prediction are relevant to aging or Alzheimer’s disease, such as the retrosplenial cortex. A more detailed analysis revealed differences in the contributions of anterior and posterior hippocampal cortical FC to age prediction. Our future work will concentrate on enhancing performance, validating results, and exploring clinical applications.Acknowledgements
Research reported in this publication was supported by the National Institute On Aging of the National Institutes of Health under Award Number U01AG052564 and by funds provided by the McDonnell Center for Systems Neuroscience at Washington University in St. Louis. The HCP-Aging 2.0 Release data used in this report came from DOI: 10.15154/1520707. Lv is supported by BMC Development Grant, BISA Flagship Grant, and MEV Schizophrenia program.References
[1] J. S. Allen, J. Bruss, C. K. Brown, and H. Damasio, "Normal neuroanatomical variation due to age: the major lobes and a parcellation of the temporal region," Neurobiology of aging, vol. 26, no. 9, pp. 1245-1260, 2005.
[2] T. A. Salthouse and E. Ferrer-Caja, "What needs to be explained to account for age-related effects on multiple cognitive variables?," Psychology and aging, vol. 18, no. 1, p. 91, 2003.
[3] C. L. Grady, A. R. McIntosh, and F. I. Craik, "Age‐related differences in the functional connectivity of the hippocampus during memory encoding," Hippocampus, vol. 13, no. 5, pp. 572-586, 2003.
[4] E. L. Dennis and P. M. Thompson, "Functional brain connectivity using fMRI in aging and Alzheimer’s disease," Neuropsychology review, vol. 24, pp. 49-62, 2014.
[5] M. F. Glasser et al., "The minimal preprocessing pipelines for the Human Connectome Project," Neuroimage, vol. 80, pp. 105-124, 2013.
[6] S. Y. Bookheimer et al., "The lifespan human connectome project in aging: an overview," Neuroimage, vol. 185, pp. 335-348, 2019.
[7] P.-T. Jiang, C.-B. Zhang, Q. Hou, M.-M. Cheng, and Y. Wei, "Layercam: Exploring hierarchical class activation maps for localization," IEEE Transactions on Image Processing, vol. 30, pp. 5875-5888, 2021.
[8] T. He et al., "Deep neural networks and kernel regression achieve comparable accuracies for functional connectivity prediction of behavior and demographics," NeuroImage, vol. 206, p. 116276, 2020.
[9] K. Zhang et al., "PET imaging of neural activity, β-amyloid, and tau in normal brain aging," European Journal of Nuclear Medicine and Molecular Imaging, pp. 1-13, 2021.
[10] J. Ziontz, J. N. Adams, T. M. Harrison, S. L. Baker, and W. J. Jagust, "Hippocampal connectivity with retrosplenial cortex is linked to neocortical tau accumulation and memory function," Journal of Neuroscience, vol. 41, no. 42, pp. 8839-8847, 2021.
[11] T. M. Harrison et al., "Longitudinal tau accumulation and atrophy in aging and alzheimer disease," Annals of neurology, vol. 85, no. 2, pp. 229-240, 2019.
[12] J. S. Damoiseaux, R. P. Viviano, P. Yuan, and N. Raz, "Differential effect of age on posterior and anterior hippocampal functional connectivity," Neuroimage, vol. 133, pp. 468-476, 2016.
Figures